Key Takeaways
- Understanding Beta: Beta measures a stock’s volatility compared to the market, helping investors understand how risky a stock is relative to overall market movements.
- Interpreting Beta Values: A beta above 1 means higher volatility than the market, below 1 means lower volatility, and a negative beta indicates the stock moves inversely to market trends.
- Benchmark and Sectoral Beta: StockEdge provides both Benchmark Beta and Sectoral Beta, allowing users to analyze volatility against the overall market or specific sectors for more accurate insights.
- Beta Scans on StockEdge: Paid users can access scans for high, low, and negative beta stocks against benchmark and sectoral indices, enabling targeted stock selection based on volatility.
- Investment Insight: Beta is an essential technical indicator in equity research, guiding investors to make informed decisions by understanding potential price movements relative to market or sector trends.
The Beta of a stock measures the stock’s volatility compared to the market or the benchmark index. It measure’s the price sensitivity of a stock in relation to a related benchmark index. The beta of an individual stock gives market participants an indication of how risky the stock is.
Beta is calculated as:
Beta = Correlation of Stock Price Return and Index Price Return * (Standard Deviation of Stock Price Return / Standard Deviation of Index Price Return)
The time frame and periodicity used to calculate beta is not fixed and can be altered based on the user’s needs. At StockEdge, we have calculated it using daily price returns for a period of one year. It gives an indication whether a stock will move in the same direction as the market and how risky or volatile it is in relation to the market. The beta of a market or the benchmark index is always 1.
A stock’s beta can be greater than 1, equal to 1, less than 1 and even 0. A value greater than one indicates that the benchmark index and the market will move in the same direction but the stock will be more volatile than the index while a value less than 1 indicates that the benchmark index and stock will move in the same direction but the stock will be less volatile than the index.
A negative value indicates that the price returns of the benchmark index and stock are inversely related and will move in opposite directions. For eg: Value of 1.4 indicates that the stock is 40% more volatile than the market and of 0.4 indicates that the stock is only 40% as volatile as the market.
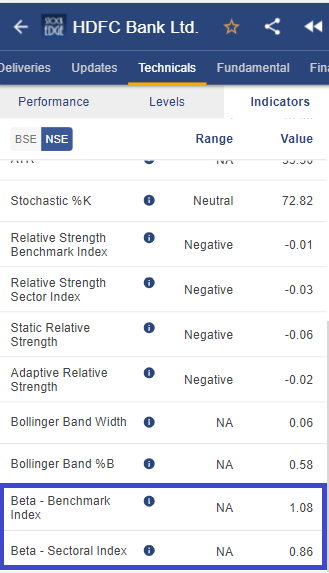
On StockEdge, with the new version update, free and paid users both can now see this useful information in the Technicals page under the Indicators tab. This value will be available against the benchmark index as well as the related sectoral index. Benchmark Beta will give users an idea of how volatile the stock is in relation to the overall market or the benchmark index. The Sectoral Beta will help users to conduct a deeper study to understand how volatile the stock is compared to the sector as a whole.
To aid equity research further, StockEdge is releasing 6 new scans for its paid users. These scans are:
1. High Beta – Benchmark Index: This scan will filter out stocks whose value is greater than 1.4 against the benchmark index.
2. Low Beta – Benchmark Index: This scan will filter out stocks whose value is less than 0.3 against the benchmark index.
3. Negative Beta – Benchmark Index: This scan will filter out stocks whose value is negative against the benchmark index.
4. High Beta – Sectoral Index: This scan will filter out stocks whose value is greater than 1.4 against the sectoral index.
5. Low Beta – Sectoral Index: This scan will filter out stocks whose value is less than 0.3 against the sectoral index.
6. Negative Beta – Sectoral Index: This scan will filter out stocks whose value is negative against the sectoral index.
It is an important indicator while doing equity research. At StockEdge, we continuously believe in improving the user’s experience and making the users more financially literate and introducing such useful information and feature is an attempt to move a step further to meet our objectives and goals. If you enjoy using StockEdge, don’t hold back from sharing it with your loved ones.
Check out StockEdge’s Premium Plans to get the most out of it.
Also, keep watching this space for our midweek and weekend editions of ‘Trending Stocks‘ and ‘Stock Insights‘.


Wow that’s Great to add Beta Scan. Heartiest Gratitude 🌹
Thank you