StockEdge.com
  • Products
    • StockEdge Premium
    • StockEdge Pro
    • StockEdge Club
  • Stories
StockEdge Blog
  • Trending Stocks
  • Insights
  • Technical Analysis
  • Fundamental Analysis
  • StockEdge Tutorials
  • Mutual Fund
No Result
View All Result
  • Trending Stocks
  • Insights
  • Technical Analysis
  • Fundamental Analysis
  • StockEdge Tutorials
  • Mutual Fund
No Result
View All Result
StockEdge
Home Insights
A graphic image featuring the logos and names of “stock insights” and “tata motors ltd. ” on a geometric, multi-shaded blue background.

Tata Motors Limited – Connecting Aspirations

StockEdge by StockEdge
November 15, 2024
Reading Time: 7 mins read
6.1k
VIEWS
Share on FacebookShare on XShare On WhatsApp

Table of Contents

  • Operational Highlights
  • Future Outlook:
  • Management Update
  • Product Segments
  • StockEdge Technical View
  • Bottom Line:
    • Disclaimer:

In today’s blog, we place the spotlight on Tata Motors Ltd, which is a leading global automobile manufacturing company. The company’s share price has gained a whopping rally of 264% from its recent low on 3rd April 2020. As of today’s date, this is Tata Motors share price.

The company is engaged in the manufacturing of cars, utility vehicles, pick-ups, trucks, and buses. Also, Tata Motors is India’s largest and the only OEM offering an extensive range of integrated, smart, and e-mobility solutions.

World-class manufacturing forms the essence of Tata Motors. The facilities of the company ensure that every step – from design to production to assembly – meets the highest quality standards in the manufacturing process.

A red car on a lift in a tata motors garage with two mechanics working on it.

The company is driven by a passion for excellence, which is reflected across all its operations. To offer the best vehicle experience to its customers, its passionate engineering and quality talent ensures the production of superior vehicles, which has led to the rapid growth in global demand for its products.

For decades, Tata has been a very common household name in India and was known for its commercial vehicles like buses, trucks, etc. After tasting the success in commercial vehicles, Tata Motors decided to enter the mass passenger car segment with the highly acclaimed Indica in 1998, which went on to become a huge success in India.

It has operations in various countries like India, the UK, South Korea, South Africa, China, Brazil,  Austria, and Slovakia through a strong global network of its subsidiaries, associate companies, and Joint Ventures (JVs), including Jaguar Land Rover in the UK and Tata Daewoo in South Korea.

Back in 2008, Tata Motors had acquired the iconic Jaguar Land Rover businesses from Ford Motor Company for a net consideration of US $2.3 billion, in an all-cash transaction.

An infographic showing the growth of tata motors from 1945 to 2019 in terms of employees, vehicles sold, and sales and service points

Tata Motors Commercial Vehicle (CV) offerings include sub-1-tonne to 55-tonne Gross Vehicle Weight (GVW) trucks and small, medium and large buses and coaches. The Passenger Vehicle (PV) offerings of TML include the NEW FOREVER range that reflects the design language of IMPACT 2.0 across cars and utility vehicles and is built using sustainable, pioneering technologies.

The company has the vision to become the most aspirational Indian Auto Brand.
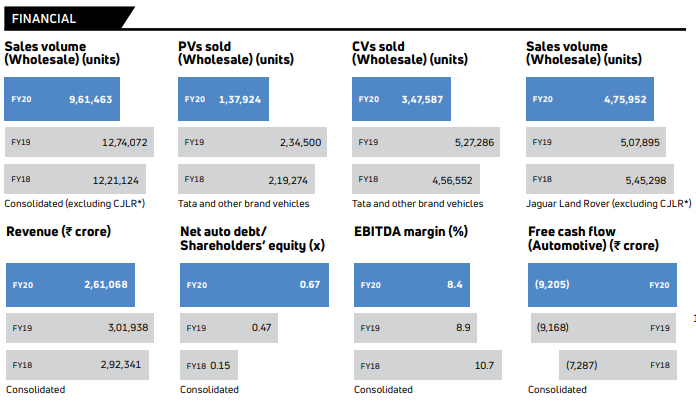
A table with financial data for tata motors and jaguar land rover for fy18-fy20, showing sales volume, revenue, net shareholders' equity, ebitda margin, pvs sold, cvs sold, and automotive free cash flow.
Source: Annual Report
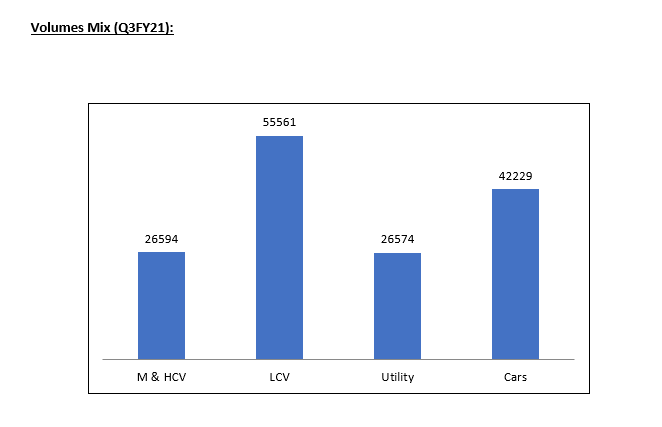
A bar graph showing the volumes mix of four categories in q3fy21. The categories are m & hcv, lcv, utility, and cars. The cars category has the highest volume of 55561, followed by the utility category with 42229, the m & hcv category with 26594, and the lcv category with 26574.

Operational Highlights

  • The revenues grew during Q3FY21 to Rs 75,653 cr as compared to Rs 71,676 cr in Q3FY20. The topline grew in a healthy manner on both Indian and JLR front.
  • The EBITDA grew to Rs 11,509 cr in Q3FY21 as compared to Rs 7,196 cr in Q3FY20. EBITDA margin came in robust amid less adverse RM costs as well as lower other expenses.
  • The PAT grew to Rs 3,222 in Q3FY21 as compared to Rs 1,954 cr in Q3FY20.
  • On a consolidated basis, Free Cash Flow generation for the quarter was at Rs 7,900 crore, with net external automotive debt as of December 2020 at Rs 48,700 crore vs. Rs 61,900 crore as of Q1FY21.
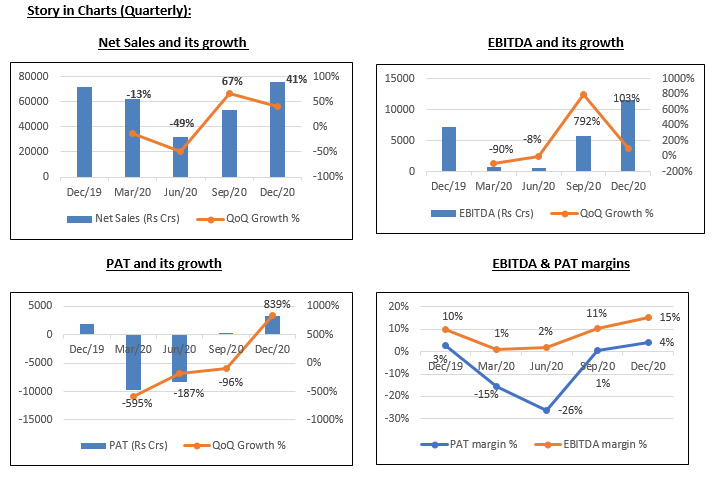
This chart shows the quarterly growth of net sales, ebitda, pat and pat margins for abc company.

Future Outlook:

  • Electric Vehicles forms 2% of total Passenger Vehicles sales thus far in FY21. Nexon EV has crossed 2,500 units sales since launch and formed 64% of total India EV industry volumes in 9MFY21
  • The company might have some short term pressure due to the shortage of semiconductors.
  • Standalone margins were at the highest level in seven quarters. India Free Cash Flow for Q3FY21 was at Rs.2,200 crore, with investment spends at Rs.547 crore
  • Ongoing product mix improvement (higher share of Land Rover; higher share of China and North America vs. Europe and UK) played a big part in profitability improvement.
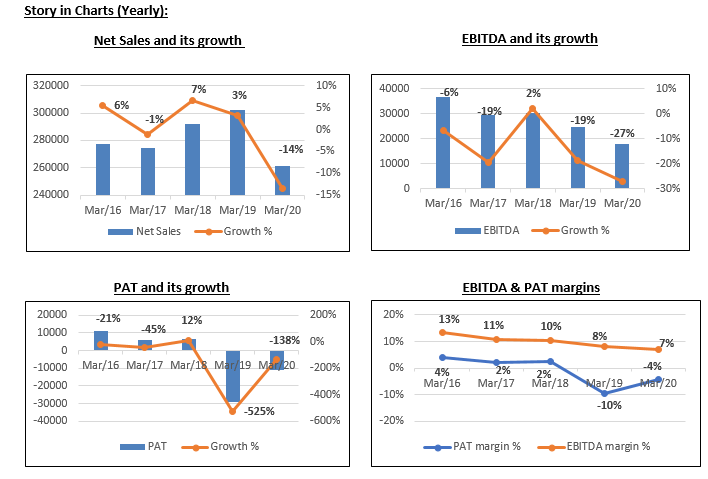
A set of four line graphs showing the yearly growth of net sales, ebitda, pat, and ebitda & pat margins from march 2016 to march 2020. The graphs have blue and orange lines representing the different metrics. The net sales graph shows a steady increase from 1,000 to 2,500 crores. The ebitda graph shows a fluctuating growth from 200 to 600 crores. The pat graph shows a sharp decline from 300 to -100 crores in march 2018, followed by a gradual recovery to 200 crores. The ebitda & pat margins graph shows a similar trend, with ebitda margin ranging from 15% to 25% and pat margin ranging from 10% to -5%.

Management Update

  • During 3QFY21, JLR said that it is back to pre-Covid levels of profitability at the EBIT level.
  • India CV revenues were up ~21% YoY despite ~8% volume decline due to better mix (higher truck, ILCV sales). CV EBITDA margins were placed at ~8%.
  • India PV sales were up 78.5% YoY on the back of ~86% volume growth achieved in Q3FY21. Margins at 3.8% compared to negative 4% in Q3FY20 while absolute EBITDA at the best level of the past 10 quarters.

Product Segments
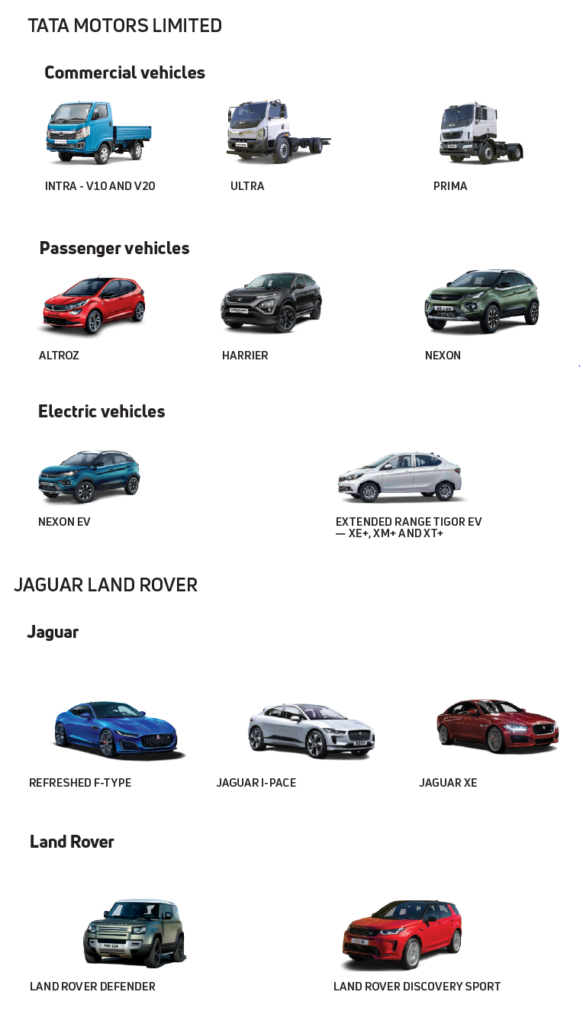
A collection of different types of vehicles from tata motors limited, including passenger vehicles, electric vehicles, and jaguar land rover vehicles.
Source: Annual Reports

StockEdge Technical View

Tata Motors trading above the weekly support zone and likely to stay positive till the stock stays above 290-300 zone. Probable resistance in the medium term comes at 375 level. Technical parameters look positive as of now. Likely to see further momentum above 342 level.
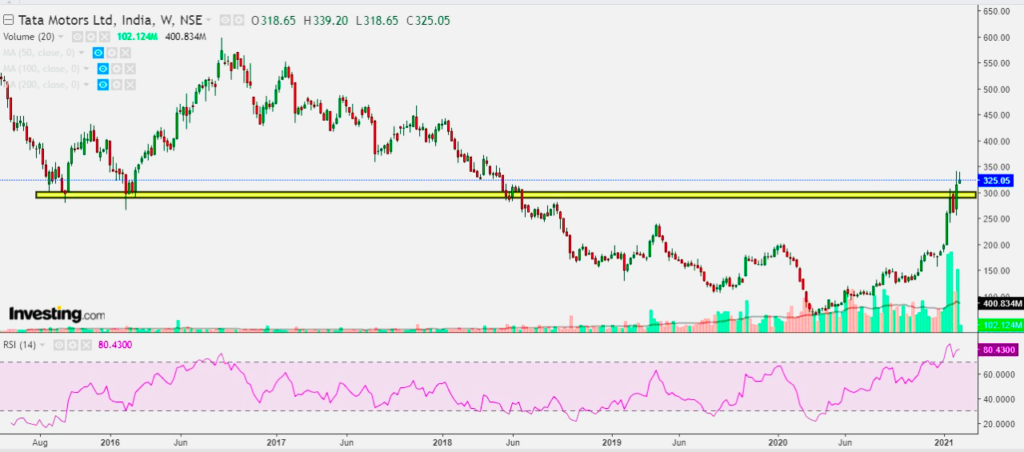
A line chart showing the stock price of tata motors ltd, india from august 2016 to june 2021, with the 50-day and 200-day moving averages and the rsi indicator.

Bottom Line:

India’s Passenger Vehicle performance in 9MFY21 has defied the industry translating into 300 bps market share gain and healthy profitability at EBITDA level. Commercial Vehicle segment is also recovering fast, aided by return of infrastructure and mining demand in trucks and LCV resilience. At JLR, China’s performance continues to lead the way in the post Covid period.

Strong liquidity; debt maturities well spread out; Promoters exercise their warrants amounting to Rs 2.6KCr in Jan 2021 increasing Tata Group shares (voting) to 45.82%. Standalone cash savings for 9MFY21 are at Rs 5,100 crore (vs. full year target of Rs 6,000 crore).

Investment reduction target of Rs 3,000 crore for the year is likely to be undershot as the company would not reduce capex related to growth (currently at Rs 1,600 crore). The company is performing well in both Indian operations and also on the JLR front.

Additionally, it is a part of Nifty 50, which is the India’s benchmark index. To know more about Nifty 50 stock read; All About NIFTY50, Components of NIFTY50, and How to Invest in it

Read our latest blog on Are Dividend Yield Funds a good option to invest in?

Disclaimer:

This document and the process of identifying the potential of a company has been produced for only learning purposes. Since equity involves individual judgements, this analysis should be used for only learning enhancements and cannot be considered to be a recommendation on any stock or sector. Our knowledge team has limited understanding and we all are learning the art and science behind this.

Tags: InvestingStockEdge InsightsTata Motors Ltd
ShareTweetSend
Open A Zero Brokerage Account In Kotak Open A Zero Brokerage Account In Kotak Open A Zero Brokerage Account In Kotak
Previous Post

Are Dividend Yield Funds a good option to invest in?

Next Post

Kalyani Group – Challenging the Conventional, Defying the Impossible.

StockEdge

StockEdge

StockEdge is a self-help Equity and Mutual Fund research tool. It empowers retail investors to identify investment opportunity with all the necessary data and analytics.

Next Post
A graphic showcases a collaboration between several business entities and kalyani group, a diversified company with interests in technology, engineering, and other sectors

Kalyani Group - Challenging the Conventional, Defying the Impossible.

An infographic about sector funds and their benefits to our portfolio. The background is a blue-green gradient. The infographic has a title “mutual fund” in white text and a subtitle “understanding sector funds and their benefits to our portfolio” in white text. The infographic has a small illustration of a person with a bag of money and a stack of coins. The infographic has a small illustration of a building with a rupee symbol on it

Understanding Sector Funds and their Benefits to our Portfolio

The dynamic and forward-looking axis bank logo, symbolizing growth and prosperity

Axis Bank Ltd - Just the Bank You Need

Comments 6

  1. Avatar of kesav reddy Kesav Reddy says:
    4 years ago

    Very insightful article. Thanx a ton for compiling it and presenting it to us.

    • Avatar of stockedge StockEdge says:
      4 years ago

      We are glad you liked the content. Keep following us on Twitter to read more such Blogs!

  2. Avatar of sunil sharma Sunil sharma says:
    4 years ago

    Shall I go for it for long term.

    • Avatar of stockedge StockEdge says:
      4 years ago

      We are glad you liked the content. Since the blog is for educational purpose, we suggest you to consult an investment advisor before investing as per your time horizon.

  3. Avatar of parthasarathi parthasarathi says:
    4 years ago

    Excellent explaination

    • Avatar of stockedge StockEdge says:
      4 years ago

      We are glad you liked the content. Keep following us on Twitter to read more such Blogs!

Disclaimer

StockEdge (Kredent InfoEdge Pvt. Ltd.) is a SEBI-registered Research Analyst (RA) entity (SEBI Registration No: INH300007493). The information provided in this article is for educational and informational purposes only and should not be considered as an offer to buy or sell any securities or investment products.

The stocks, securities, and investment instruments mentioned herein are not recommendations under SEBI (Research Analysts) Regulations, 2014. Readers are advised to conduct their own due diligence and seek independent financial advice before making any investment decisions.

Investments in securities markets are subject to market risks. Please read all related documents carefully before investing. Investing in Equity Shares,
Derivatives, Mutual Funds, or other instruments carry inherent risks, including potential loss of capital. StockEdge (Kredent InfoEdge Pvt. Ltd.) does not provide any guarantee or assurance of returns on any investments. Past performance is not indicative of future performance.

Contact Us
  • Timing (Mon-Sat): 10 am to 7 pm
  • Sales: +919830994463
  • Support: +919830994402
  • Club Support: +916289906895
  • Affiliate: +917003567131
Recent Posts
2 Ethanol Stocks in India
Top 2 Ethanol Stocks in India
Check out the Top 3 Consumption Stocks in India
Top 3 Consumption Stocks in India
Important Links
  • StockEdge.com
  • StockEdge Premium
  • StockEdge Pro
  • StockEdge Club
  • Compare Plans
An Initiative Of
Logo of KREDENT INFOEDGE with SEBI Registration no.

© 2025 Kredent InfoEdge Pvt Ltd.

Facebook-f Twitter Instagram Linkedin-in Youtube Pinterest-p Whatsapp Telegram

Get StockEdge App

No Result
View All Result
  • Home
  • Article Categories
    • Trending Stocks
    • Insights
    • Technical Analysis
    • Fundamental Analysis
    • StockEdge Tutorials
    • Mutual Fund
  • Stories
  • Products
    • StockEdge Premium
    • StockEdge Pro
    • StockEdge Club
  • Visit StockEdge.com

© 2024 Kredent InfoEdge Pvt Ltd.