Table of Contents
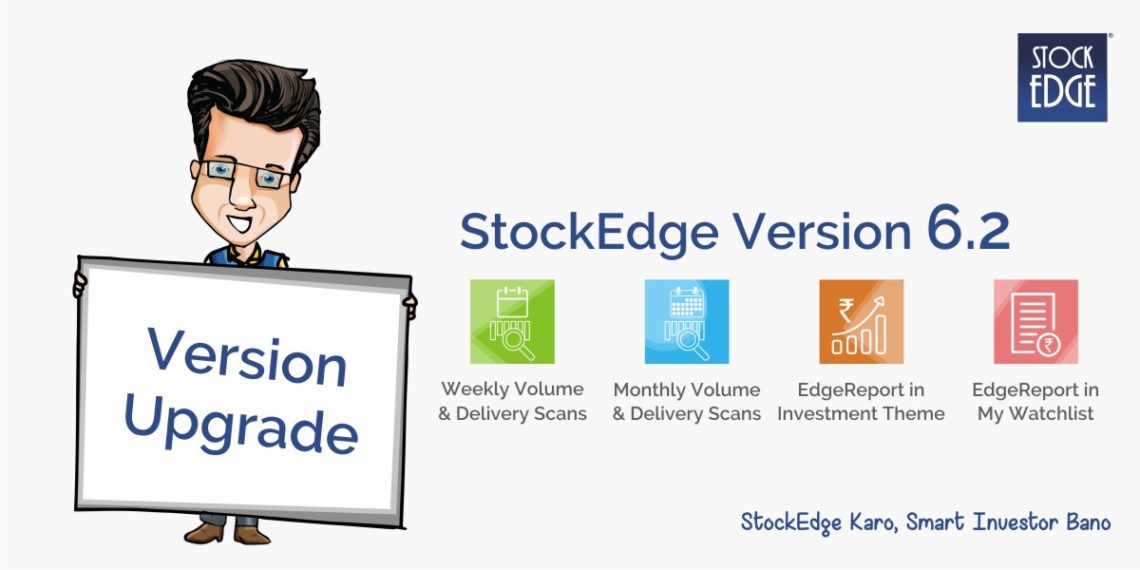
StockEdge is happy to release StockEdge Version 6.2., that Includes some new value additions as Premium content.
Premium features include
- Volume and Delivery Weekly Scans
- Volume and Delivery Monthly Scans
- Edge Reports in Investment Ideas
- Edge Reports in My Watchlists
- Enhancements in My General Notes
Now let us have a brief overview of what these features are all about.
Volume and Delivery Weekly and Monthly Scans
Volume and Delivery is a very important parameter in stock markets and holds key values in determining and analysing price trends and actions of a stock. Volume of a stock for a given period is the total number of shares of a stock that is being traded in that period, and delivery is the amount of shares in which there was an exchange of demat accounts between the participants of the trade.
StockEdge started providing Volume and Delivery data on a weekly and monthly basis in the previous release Version 6.1, so StockEdge came up with providing 10 powerful scans with respect to volume and delivery on a weekly and monthly basis(5 for each) in the latest release for enhancing and helping our users to upgrade their understanding and strengthening their analysis.
Let us check out the 10 new powerful scans of Volume and Delivery
Now let us understand each of the scan in details:
High Delivery Percentage this Week and High Delivery Percentage this Month
Delivery Percentage is the percentage amount of the shares that were delivered from one demat account to other out of the total volume of shares that is the number of shares traded. As we are speaking about Weekly and Monthly Periods , here we will be displaying the list of stocks that has a high delivery percentage all round the current week and the current month respectively. For any stock to be able to fulfill the criteria of these two scans, it must have a delivery percentage of more than 75% in that week or month, respectively.
Criteria to fulfill both the scans:
High Delivery Percentage this Week = (Delivered Quantity in the Current Week/ Traded Quantity in the Current Week) =>75%.
High Delivery Percentage this Month = (Delivered Quantity in the Current Month/ Traded Quantity in the Current Month) =>75%.
Check out the list of stocks having delivery percentage more than 75% in the week and month as on 25th June,2021.

High Delivery Quantity this Week and High Delivery Quantity this Month
Delivery Quantity is the total number of shares that the traders or investors are actually buying the ownership for and getting them transferred to their demat accounts from the demat accounts of sellers. High delivery quantity implies that investors are showing interest in these stocks with a belief of short term and long term bullish momentum in the respective stocks. So in the two respective scans, stocks will have to fulfill the criteria of their weekly and monthly delivery quantity being greater than 1.5 times the average quantity of last 5 weeks and last 5 months respectively for the two scans.
Criteria to fulfill both the scans:
High Delivery Quantity this Week = Delivered Quantity in the Current Week > 1.5 times of Average Delivery Quantity of last 5 Weeks
High Delivery Quantity this Month = Delivered Quantity in the Current Month > 1.5 times of Average Delivery Quantity of last 5 Months
Check out the list of stocks having high delivery quantity in the week and month as on 28th June,2021.

High Delivery Quantity and Percentage this Week & High Delivery Quantity and Percentage this Month
In these two scans, stocks will have to fulfill the dual criteria of having higher delivery quantity and percentage together for the week and the month to be able to get listed in these powerful two scans. It will generate less number of stocks which will be filtered out from around 5000 stocks and implying that investors are showing keen interest in these specific stocks and a bullish momentum is expected to reinforce the current trend.
Criteria to fulfill both the scans:
High Delivery Quantity and Percentage this Week = (Delivered Quantity in the Current Week/ Traded Quantity in the Current Week) =>75%, and Delivered Quantity in the Current Week > 1.5 times of Average Delivery Quantity of last 5 Weeks
High Delivery Quantity and Percentage this Month = (Delivered Quantity in the Current Month/ Traded Quantity in the Current Month) =>75%. and Delivered Quantity in the Current Month > 1.5 times of Average Delivery Quantity of last 5 Months
Check out the list of stocks having high delivery quantity and percentage in the week and month as on 28th June,2021.

High Trade Quantity this Week and High Trade Quantity this Month
Trade Quantity is the total volume of shares traded of a stock for the respective period. It indicates the action and movements in the stock, higher the trade quantity, higher the volatility and movement and vice versa. High Trade Quantity this week and this month implies that there is a lot of action and trades happening in the respective period and the respective stock is in momentum for a trend reinforcement or reversal. For stocks to qualify under these two scans, stocks will have to have trade quantity higher than 1.5 times the average trade quantity of last 5 weeks and last 5 months respectively. Stocks displayed under this scan implies that a lot of traders are taking positions and showing interest in the stock and it is well used along with the price trend to analyse the upcoming price movements.
Criteria to fulfill both the scans:
High Trade Quantity this Week = Traded Quantity in the Current Week > 1.5 times of Average Traded Quantity of last 5 Weeks
High Trade Quantity this Month = Traded Quantity in the Current Month > 1.5 times of Average Traded Quantity of last 5 Months
Check out the list of stocks having high trade quantity in the week and month as on 28th June,2021.

High Trade and Delivery Quantity this Week & High Trade and Delivery Quantity this Month
In these two scans, stocks with their current week and current month’s trade and delivery quantity is both higher than the 1.5 the average trade and delivered quantity of last 5 weeks and last 5 months respectively. These two scans generate very strong and powerful results with stocks with high amount of interest and action implying traders and investor’s belief in them for intraday as well as short term momentum trading.
Criteria to fulfill both the scans:
High Trade and Delivery Quantity this Week = Traded and Delivered Quantity in the Current Week > 1.5 times of Average Traded and Delivered Quantity of last 5 Weeks and last 5 months,respectively
High Trade and Delivery Quantity this Month = Traded and Delivered Quantity in the Current Month > 1.5 times of Average Traded and Delivered Quantity of last 5 Weeks and 5 Months, respectively.
Check out the list of stocks having high delivery quantity in the week and month as on 28th June,2021.

Edge Reports in Investment Ideas
Investment Ideas is one of the topmost premium features of StockEdge providing ready made watchlists based on different themes, sectors, government policies and schemes and varied other factors and StockEdge is enhancing the value of this feature by incorporating a new tab by the name “Edge Reports’. In this tab, all the edge cutting reports prepared by our team of esteemed analysts on the stocks part of the respective watchlist will be available here. These reports will include case studies, con call analysis, infographics related to the stocks part of the watchlist to help our users to strengthen their research and analysis in a correlative perspective of the respective investment idea.

Edge Reports in My Watchlists
StockEdge is incorporating a new tab named’ Edge Reports’ in the My Watchlists section of My StockEdge specially for all those investors who like to analyse and research on their own so that they can get an edge over other participants in the markets with the help of different type of powerful and strengthening analysis reports on stocks added in their respective watchlists.

Enhancements in My General Notes
Some key enhancements and improvements have been made in this latest release in the My General Notes section which will enable our users to create and edit their notes on any page of the app and our web platform and store them in a easy to access manner.

Many more interesting features have been added to make your experience all the more beautiful.
So do not miss the chance to use this powerful tool, using which you can become an Independent Investor/trader.
Click here to download the latest version of StockEdge App to make your analysis faster, better and easier within minutes.
Read our previous version update StockEdge Version Update 6.1 to stay up to date with latest features and updates.


Good morning sir
This vedio is very important fr bigners
Thank you so much sir
Good coverage