Table of Contents
StockEdge welcomes all the investors and traders! Are you ready to take your investment decisions to the next level? We have some exciting news for you. Today, we are thrilled to announce the release of our latest features that will empower and strengthen your investment strategies like never before. With these powerful tools at your disposal, get ready to make smarter and more informed choices in the dynamic world of finance. So, buckle up as we unveil a game-changing update designed exclusively for astute investors like yourself!
Introduction to StockEdge New Version Release 11.2
StockEdge, the leading stock market analysis and research platform, has recently released its newest version – 11.2. This updated version comes with powerful features that are designed to strengthen your investment decisions and help you make more informed choices in the stock market.
StockEdge has been a trusted companion for investors, both beginners and seasoned professionals alike, providing valuable insights, comprehensive market data, and intuitive tools to make informed decisions.
With over 5 million downloads and a user base of 500,000 active traders and investors, StockEdge has become one of the most trusted and reliable sources for stock market data and analysis. The new version aims to further enhance the user experience by introducing advanced tools and features that cater to the evolving needs of investors.
In this blog post, we will delve into the exciting new features and upgrades that StockEdge Version 11.2 brings to the table. Let’s explore how this update will empower you to navigate the dynamic world of investing with greater precision, confidence, and profitability.
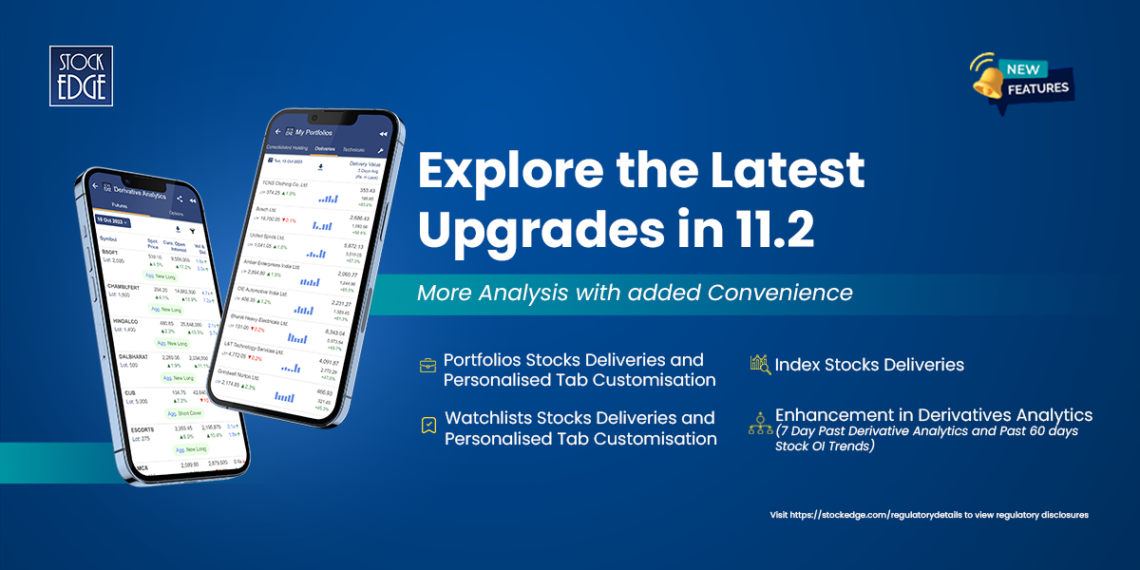
In this 11.2 release, we introduce the following most awaited features for our users:
- Indexes – Stock Deliveries
- Portfolio & My Watchlists – Stock Deliveries
- Portfolio & My Watchlists – Personalized Tab Customization
- Enhancement in Derivatives Analytics
Continue reading for a more detailed study of the above-mentioned features:
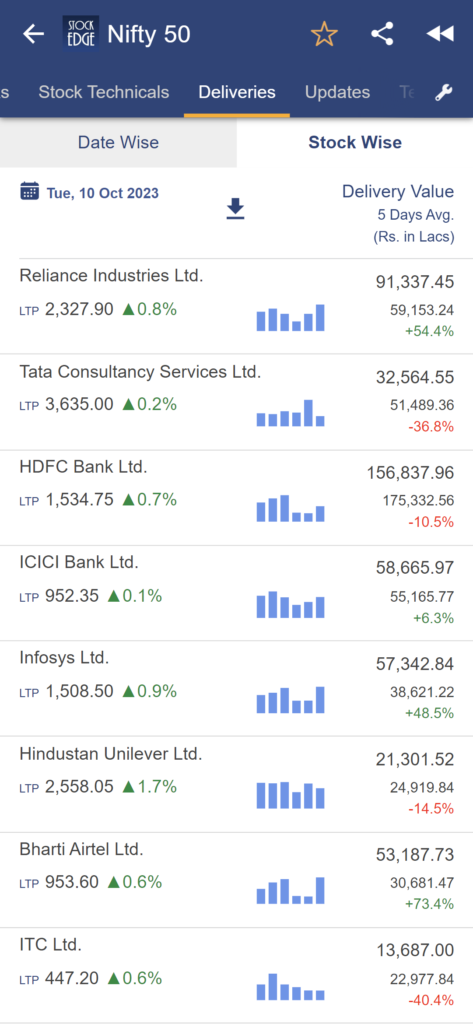
Indexes – Stock Deliveries
Analyzing the delivery data of constituent stocks of indices can provide valuable insights into the behaviour and sentiment of investors in those stocks.
- Check and track the delivery trends of stocks in an index and identify stocks with higher delivery-based accumulation or speculation.
- Compare the delivery data of constituent stocks to the overall index’s deliveries. Are there any patterns or anomalies? For example, if an index delivery is rising while most of its constituent stocks are seeing declining delivery values, it could suggest a bearish divergence.
- Identify the stocks with the highest change in delivery trends with increase or decrease in delivery value.
- Correlate the delivery data with significant news or events related to individual stocks or the overall market. This can help you understand the reasons behind changes in delivery patterns.
- Consider how delivery data relates to market sentiment. High delivery percentages may indicate investor confidence, while low deliveries could suggest speculative trading.
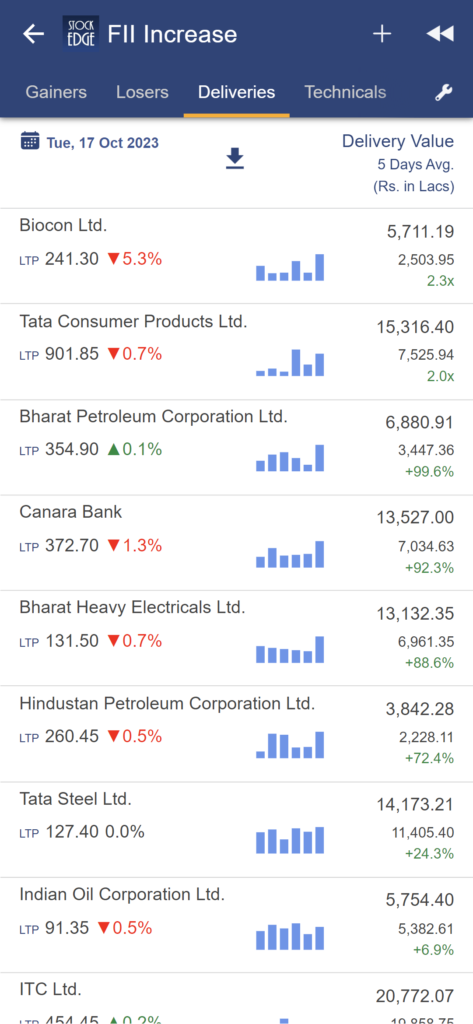
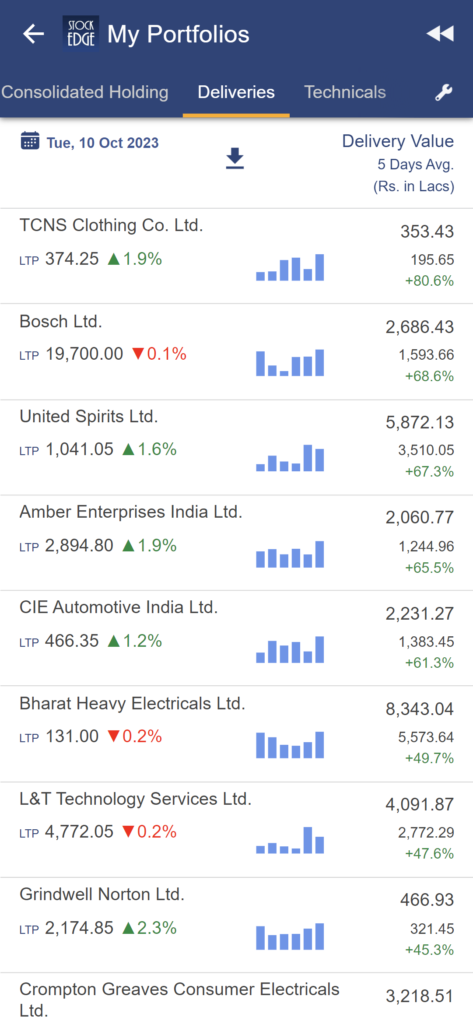
Portfolio – Stock Deliveries
Analyzing the delivery data of stocks in your portfolio can provide valuable insights into your investment strategy and the market behaviour of the stocks you own.
- Stocks with High and increasing delivery value indicates strong and increasing increasing of market participants in those stocks.
- Track changing delivery trends in your portfolio stocks and identify stocks in momentum
- Also , track and compare the delivery trends of stocks in your portfolio with overall market trends for better investment decisions.
- Compare the delivery data with the price movement of the stocks in your portfolio. High delivery percentages during an uptrend might indicate strong bullish sentiment, while high delivery percentages during a downtrend could be a sign of selling pressure.
- Examine any news or events related to the stocks in your portfolio. Major announcements, earnings reports, or market-moving news can impact delivery value. High and increasing delivery value following positive news could be a bullish sign, while high delivery percentages after negative news may indicate bearish sentiment.
- Assess the diversification of your portfolio. A well-diversified portfolio may have stocks with varying delivery percentages. A concentration of high delivery stocks might indicate a particular focus or sector preference in your portfolio.
Watchlist – Stock Deliveries
Analyzing the delivery data of stocks in your watchlist can provide insights into potential investment opportunities or changes in market sentiment.
- Stocks with High and increasing delivery value indicates strong and increasing increasing of market participants in those stocks.
- Track changing delivery trends in your watchlist stocks and identify stocks in momentum
- Also , track and compare the delivery trends of stocks in your watchlists with overall market trends for better investment decisions.
- Compare the delivery data with the price movement of the stocks in your watchlists. High delivery percentages during an uptrend might indicate strong bullish sentiment, while high delivery percentages during a downtrend could be a sign of selling pressure.
- Examine any news or events related to the stocks in your watchlists. Major announcements, earnings reports, or market-moving news can impact delivery value. High and increasing delivery value following positive news could be a bullish sign, while high delivery percentages after negative news may indicate bearish sentiment.
- Assess the diversification of your watchlists. Well-diversified watchlists may have stocks with varying delivery percentages. A concentration of high-delivery stocks might indicate a particular focus or sector preference in your watchlists.
Portfolio and Watchlists – Tab Customisation
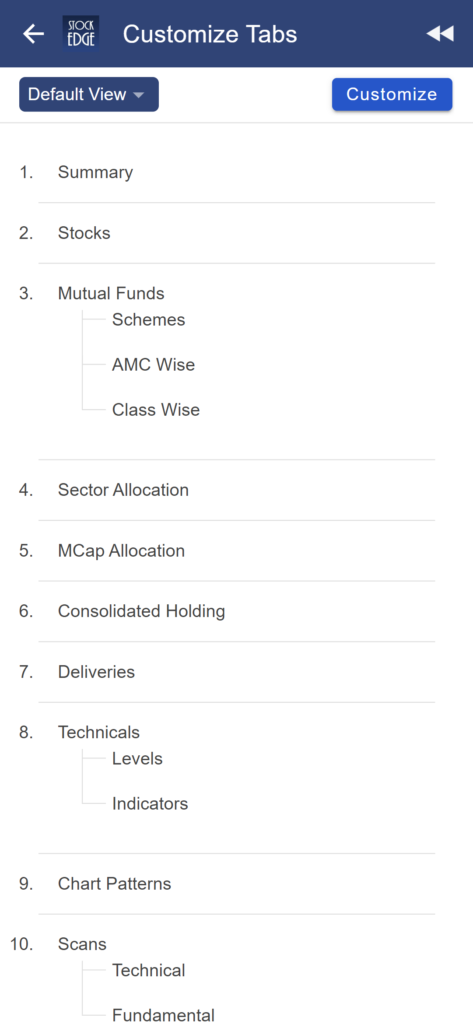
Now Stockedge provides the feature to all its users for customizing their watchlist and portfolios section as per their own preferences. All the investors and traders can customize, hide, relocate the tabs as per their convenience and ease of use. The ease of using the Watchlist and Portfolio section increases effectively with the personalised customisation enhancement. For example, an investor can prioritise only the tabs showing information useful for them and hide the tabs that they don’t wish to track.
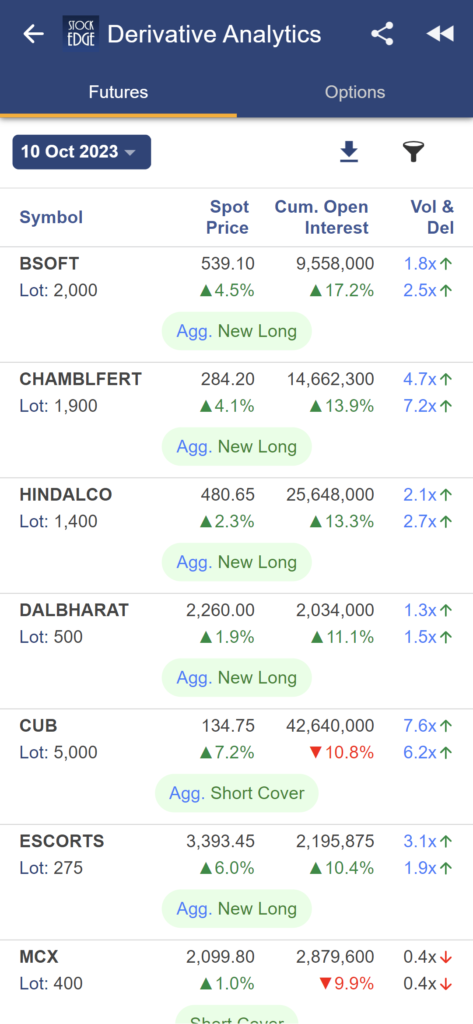
Enhancements in Derivative Analytics
Tracking stock-wise past open interest trends can provide valuable insights for traders and investors. Open interest is the total number of outstanding or open futures or options contracts for a particular security. By analyzing historical open interest data, you can gain a better understanding of market sentiment, potential price movements, and the level of participation in a specific stock.
Open interest data is usually presented as a time series, showing how open interest has changed over time. You can analyze this data to identify trends, patterns, and anomalies.
Get access to derivatives analytics data for the last 1 week to interpret and analyse trends and also get access to the last 60 days of OI trend data for futures and options for all stocks which will enable you to track the Open Interest trends in relation to market movements for the stocks driving your analysis stronger.
We’re excited to deliver these new features to you, and we believe they will significantly enhance your trading and investing journey. At StockEdge, we’re committed to continuous improvement and innovation, and this update is a testament to that commitment. Whether you are a seasoned trader or a beginner taking your first steps, StockEdge Version 11.2 is designed to enhance your investment journey and empower you to make better-informed decisions.ng StockEdge as your go-to platform for market analysis and decision-making. We value your feedback, and if you have any suggestions or queries, please don’t hesitate to reach out to our support team.
If you enjoy using StockEdge, don’t hold back from sharing the platform with your near and dear ones.
Check out StockEdge’s Premium Plans to get the most out of it. Also, watch this space for our midweek and weekend editions of ‘Stock Insights‘.
Happy Investing and Trading with StockEdge Version 11.2!
-The StockEdge Team


