Table of Contents
Welcome to the official release blog of StockEdge Version 10.0! We are thrilled to announce the latest update to our powerful investment research and analysis platform. With a relentless commitment to empowering investors and traders, StockEdge has undergone a significant transformation, bringing forth an array of cutting-edge features and enhancements to revolutionize your investment journey.
StockEdge has been a trusted companion for investors, both beginners and seasoned professionals alike, providing valuable insights, comprehensive market data, and intuitive tools to make informed decisions.
Now, with the advent of Version 10.0, we have taken a giant leap forward in delivering an unmatched experience that combines the prowess of artificial intelligence, advanced analytics, and a user-centric approach.
In this blog post, we will delve into the exciting new features and improvements that StockEdge Version 10.0 brings to the table. Let’s explore how this update will empower you to navigate the dynamic world of investing with greater precision, confidence, and profitability.
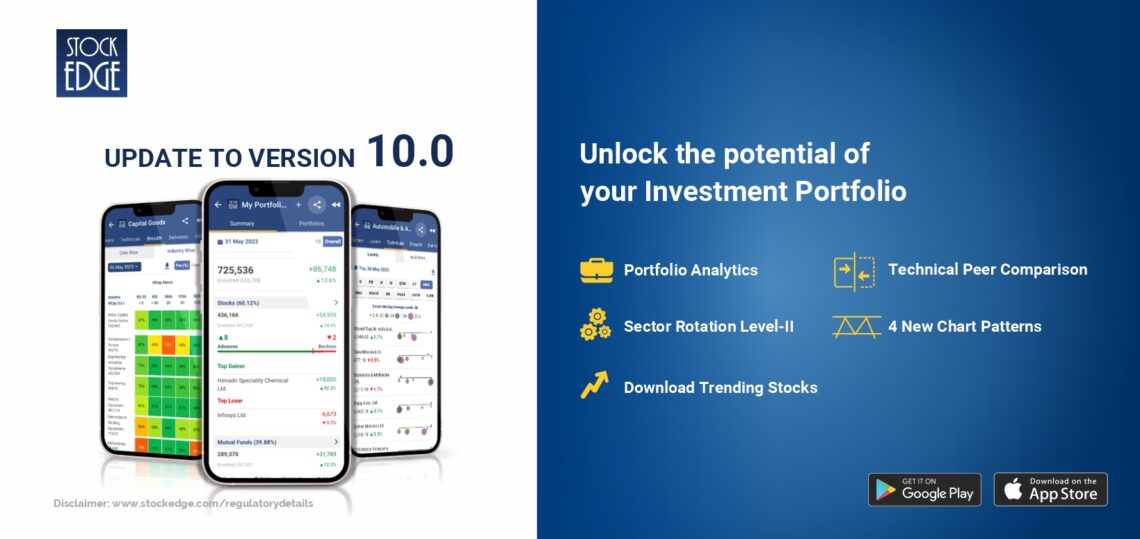
In this 10.0 release, we introduce the following most awaited features for our users:
- Portfolio Analytics
- Technical Peer Comparison
- Sector Rotation – Level II
- 4 New Chart Patterns
- Download to CSV – Trending Stocks
Continue reading for a more detailed study of the above-mentioned features:
Portfolio Analytics
Finally, in response to frequent customer requests, StockEdge has made its one-of-a-kind Portfolio Analytics feature available to all users, enabling them to easily add, track, and evaluate their portfolios effortlessly.
Users can access the My Portfolios option under the My StockEdge section, where they can manually enter their portfolios or upload them through CSV in a predetermined format.
After the addition of portfolios, you will find two different sections, namely:
Summary: Here you will find the consolidated summary of your entire portfolio along with the composition of equity and mutual funds in the same.
Portfolios: Here is the list of all your different portfolios added.
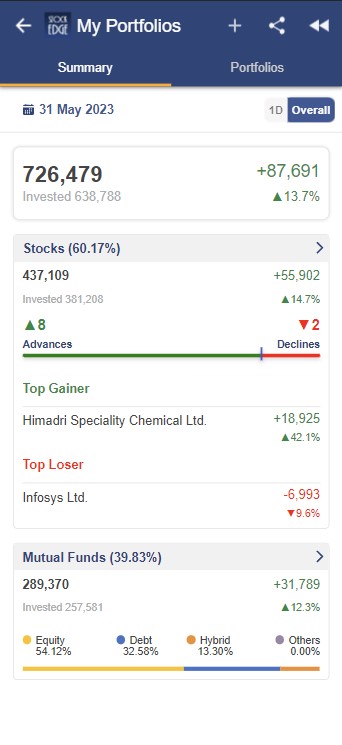
In the Summary Section, upon clicking on the Stocks/ Mutual Funds Widget, you will be redirected to the inside section of the summary tab wherein you will find all the relevant consolidated data and analytics of all your different portfolios at one place.
You will find the following data in the Summary Section:
Stocks: For daily and overall portfolio tracking, locate a list of all the stocks that have been combined from all of your various portfolios together with your investment information.
Mutual Funds: This section contains a list of all of your mutual fund investments along with their basic information.
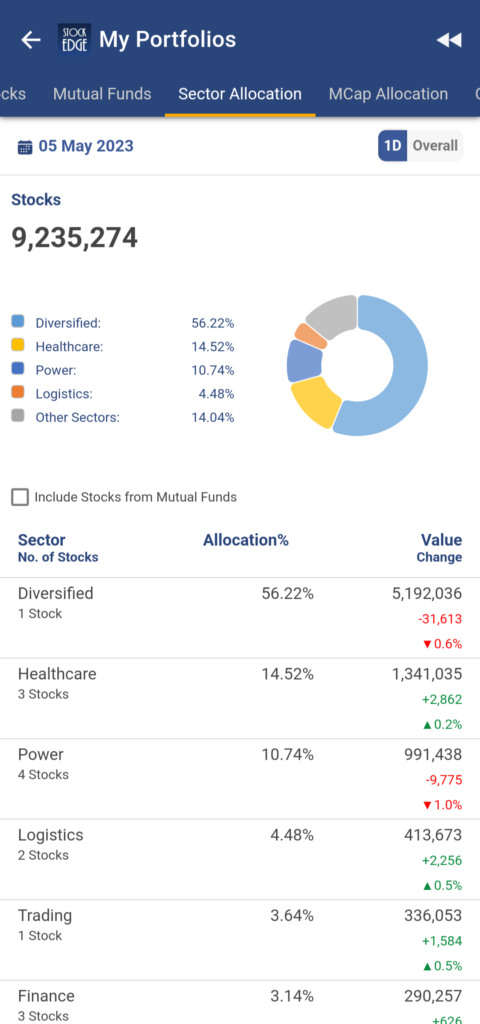
Sector Allocation: You will find the sector allocation of your entire portfolio including all stocks from all your portfolios. You also have the option to include stocks from your mutual fund investments to check and analyse your overall portfolio sector allocation.
MCap Allocation: Market Cap Allocation on the basis of Large Cap, Mid Cap and Small Cap is provided for your equity stock investments. Also, there is an option to include your mutual fund holdings for combined market cap allocation.
Consolidated Holding: Your entire investments including equity and mutual fund holdings will be provided along with your respective holding details and percentage.
Also, there are many other analytics tools and relevant data provided under Chart Patterns, Scans, Edge Reports, News and announcements, Corporate Actions, Results, and Deals.
Manage: Over here, you can manage your different portfolios effortlessly.
Now if you want to track and analyse your individual portfolios then you can go via the Portfolios tab wherein you can select your respective portfolio and find the above-mentioned analytics and key data points for them respectively in the same manner.
For a more deep understanding of the Portfolio Analytics Feature, Kindly go to blog.stockedge.com
Technical Peer Comparison
On the basis of important technical levels and indicators, StockEdge has developed the capability of comparing and studying companies with their counterparts in a sector or industry.
Prior to the addition of this function, Stockedge only offered fundamental indicator-based comparisons of companies within a sector or industry. However, this tool now also satisfies our users’ demand for the ability to compare and do technical analysis.
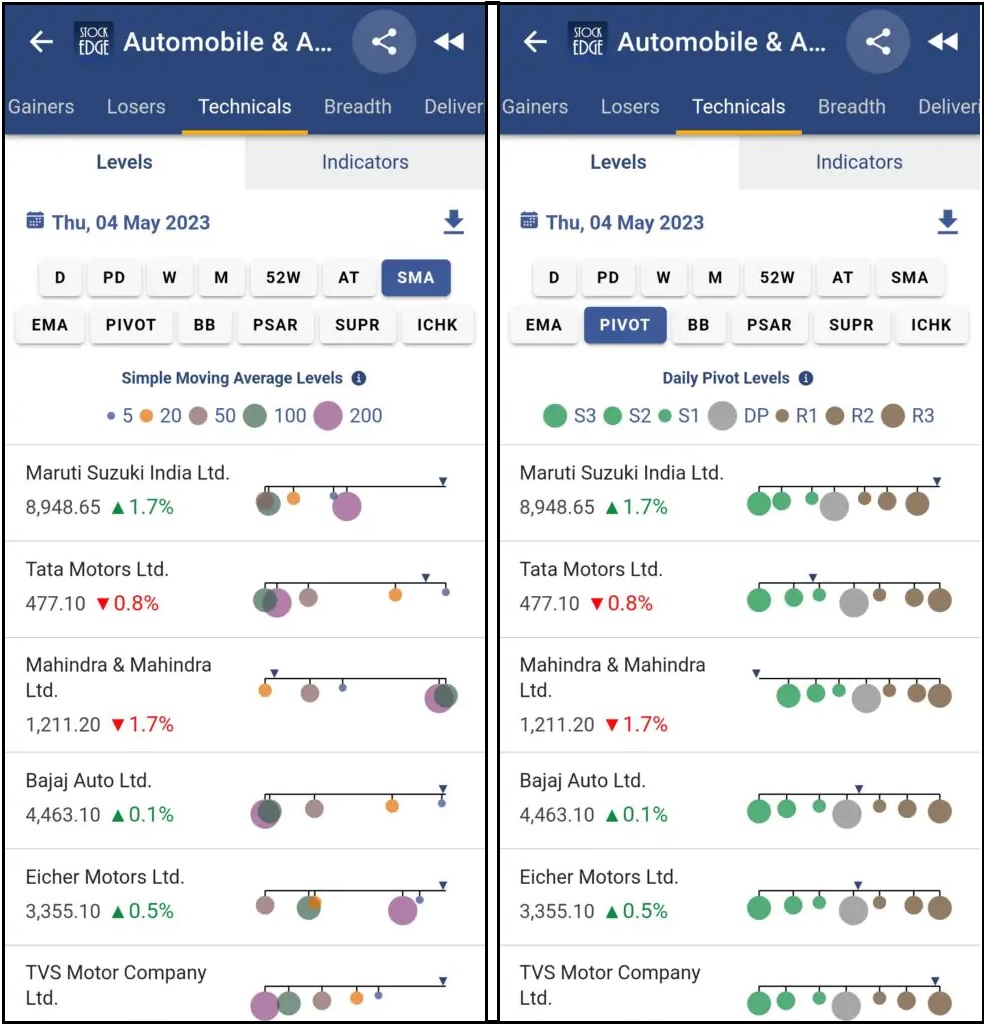
All sectors and industries now have a new tab called Technicals, which contains two sub-tabs called Levels & Indicators.
You may easily advance your technical analysis by using the key price and technical levels for all stocks in the relevant sector or industry that are presented in the Levels section.
Periodic High/Low Levels, SMA, EMA, PIVOT, Bollinger Bands, Parabolic SAR, Supertrend, and Ichimoku are among the key levels offered here.
You may compare all the companies in a sector or industry using the primary technical indicators in the Indicators section, which are divided into four main categories:
Momentum: RSI, CCI, MFI, ROC, Stochastic %K, William % R
Relative Strength: RSMKT, SRS, ARS, RSSEC
Trend: ADX, MACD
Volatility: ATR, Bollinger Band Width, Bollinger Band %B, MB Beta, SB Beta, STD
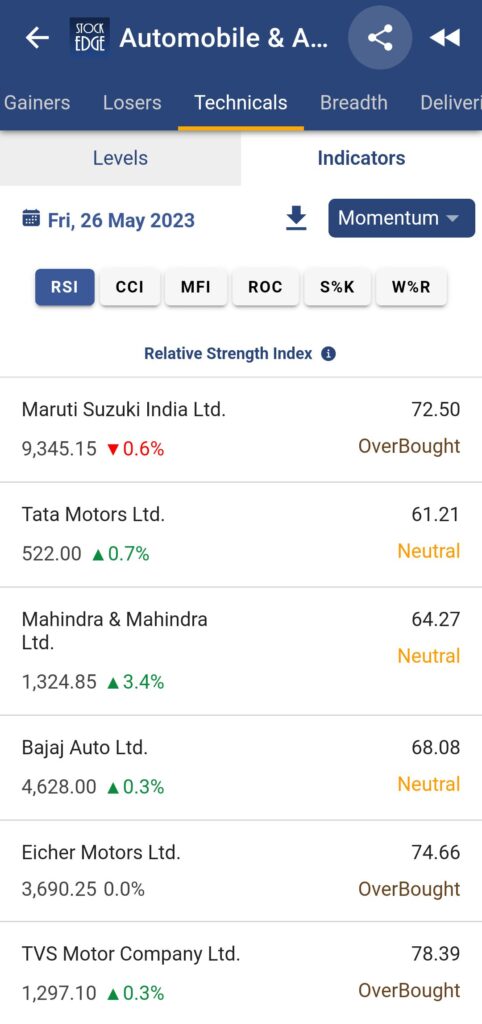
For more in-depth information on how to use and interpret the value from the key insights generated from this output, kindly refer to ——-
Sector Rotation – Level II
Sector rotation is a top-down investing strategy involving moving money from one industry sector to another in anticipation of different business cycle stages to beat the market.
StockEdge has released Sector Rotation Level – II in order to improve the user experience and credibility of the Sector Rotation function, which will assist our users in continuing their flow of analysis of sector rotation – leading to industry rotation and then delving deeper into stock selection.
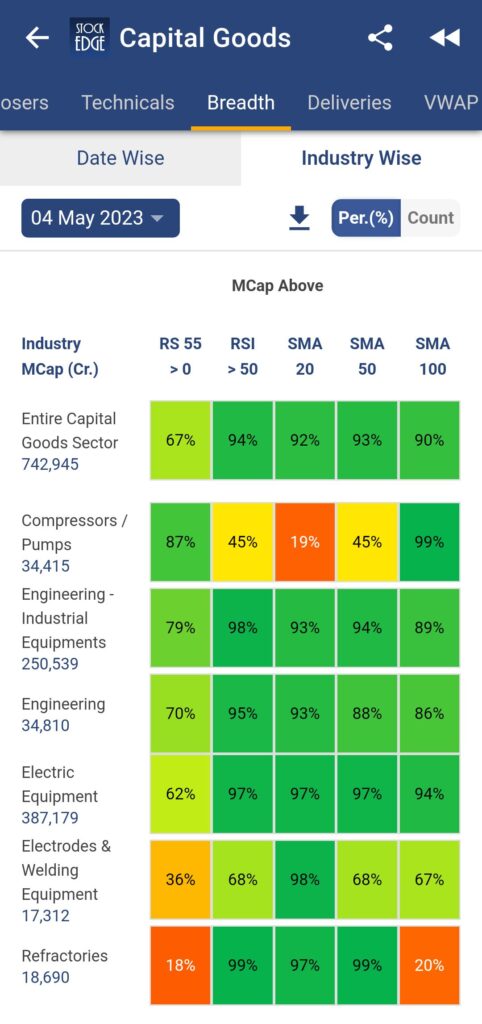
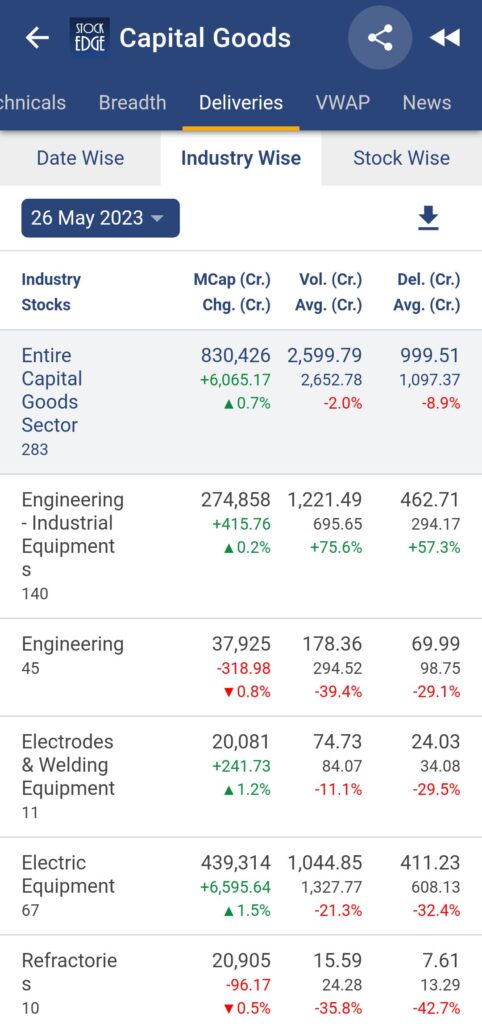
While clicking on the bar of a specific sector, you will be redirected to the inside section of that sector wherein you will also find three tabs: Breadth, Delivery and VWAP.
Breadth Section includes two sub-sections: Date Wise and Industry Wise
The Delivery Section includes three sub-sections: Date Wise, Industry Wise, Stock Wise
VWAP includes two sub-sections: Date Wise & Industry Wise
This feature will assist you in conducting in-depth research on the movement of capital across industries and sectors, which will help you find high-quality stocks.
4 New Chart Patterns
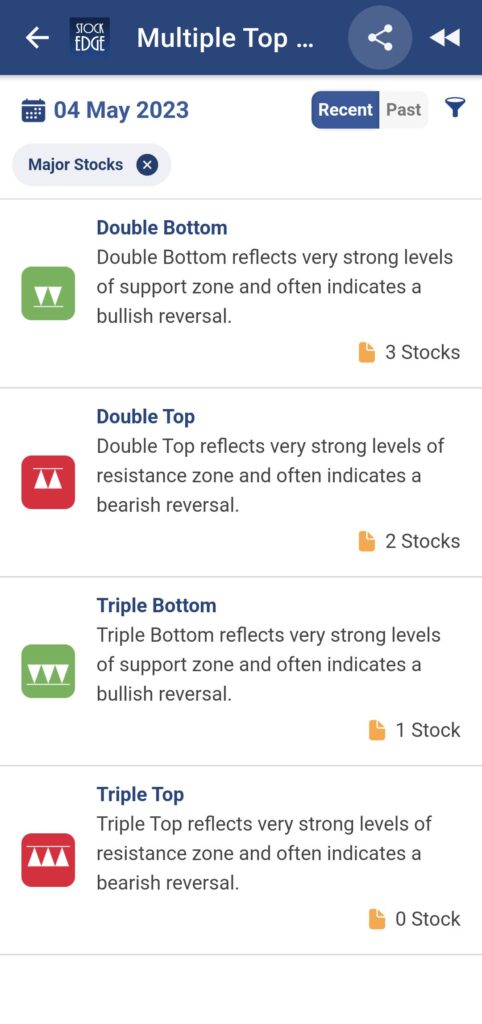
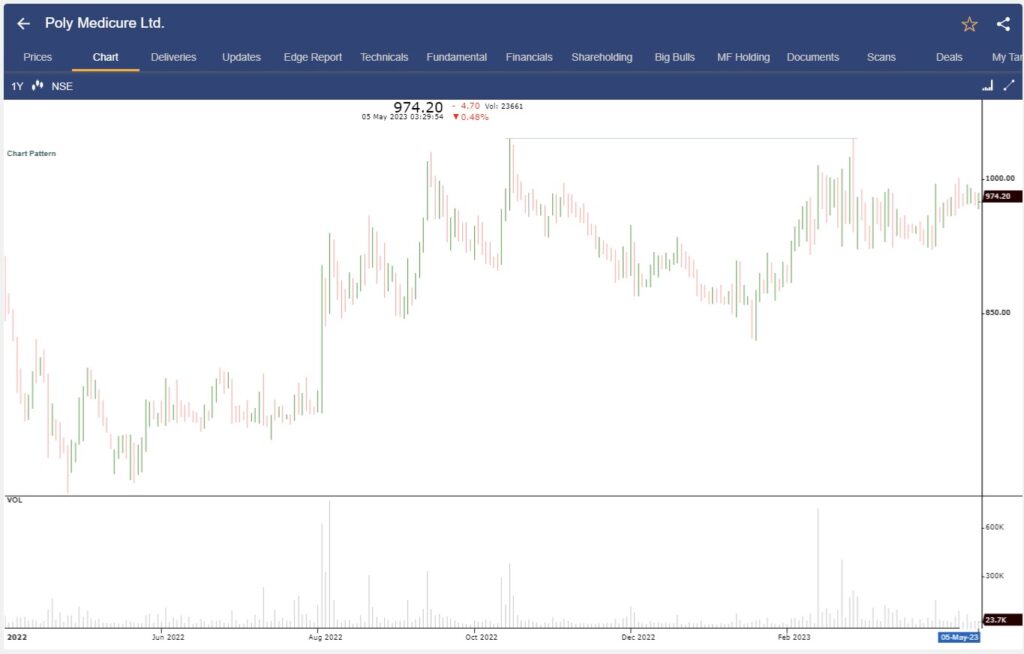
Since everyone is familiar with StockEdge’s initial Pro feature and its amazing results, we’ve included a new category called Multiple Tops and Bottoms, which includes the following four new chart patterns, to increase productivity and output credibility.
Double Bottom: This pattern reflects two strong levels of the support zone and often indicates a bullish reversal.
Double Top: This pattern reflects two strong levels of resistance zone and often indicates a bearish reversal.
Triple Bottom: This pattern reflects three strong levels of the support zone and often indicates a strong bullish reversal.
Triple Top: This pattern reflects three strong levels of resistance zone and often indicates a strong bearish reversal.
Download to CSV – Trending Stocks
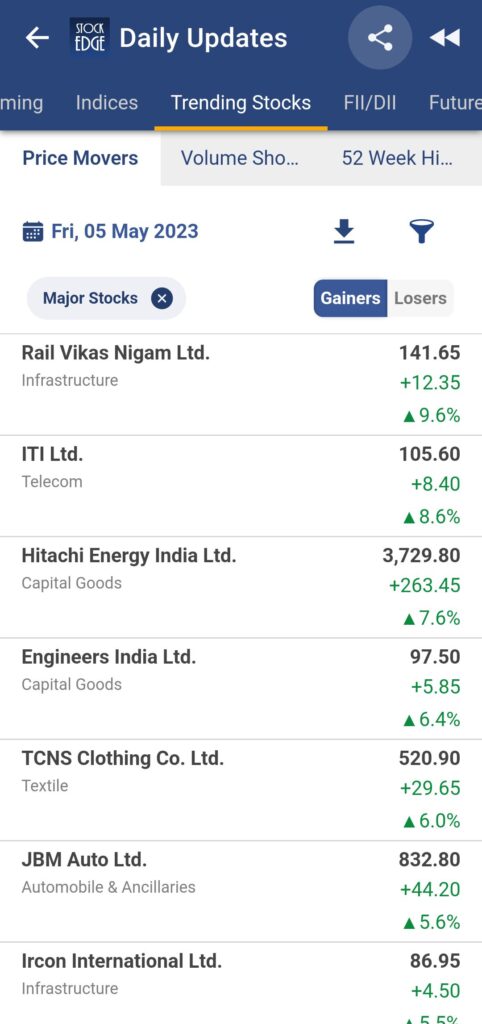
We have made available the feature for all of our customers to download the trending stock data in a CSV file, as many of you requested. This includes Price Movers, Volume Shockers, and 52W High/Low.
Now that the data indicated above is available in real-time, you may use it to drive intraday trading with better insight and successful results.
These are just a few highlights of what StockEdge Version 10.0 has to offer. We have focused relentlessly on harnessing the power of data-driven investing to equip you with the tools and insights necessary to outperform the market. Whether you are a seasoned trader or a beginner taking your first steps, StockEdge Version 10.0 is designed to enhance your investment journey and empower you to make better-informed decisions.
Stay tuned for upcoming blogs where we will dive deeper into the new features, provide tutorials, and share valuable insights from industry experts. StockEdge Version 10.0 is set to redefine the way you invest, so buckle up and get ready to unlock a world of possibilities.
If you enjoy using StockEdge, don’t hold back from sharing the platform with your near and dear ones.
Check out StockEdge’s Premium Plans to get the most out of it. Also, watch this space for our midweek and weekend editions of ‘Stock Insights‘.
Happy investing with StockEdge Version 10.0!
-The StockEdge Team
Disclaimer: Kredent Infoedge Private Limited is a SEBI registered Research Analyst and Investment Advisor. Research Analyst SEBI Registration Number – INH300007493. Investment Advisor SEBI Registration Number – INA000017781. Registered Office Address: J-1/14, Block – EP and GP, 9th Floor, Sector V Saltlake City, Kolkata WB 700091 IN. CIN: U72400WB2006PTC111010
Investments in the securities market are subject to market risks. Read all the related documents carefully before investing. Registration granted by SEBI, membership of BASL and certification from NISM in no way guarantee the performance of the intermediary or provide any assurance of returns to investors. “The securities displayed are for illustration only and are not recommendatory” should be mentioned.


