StockEdge is happy to release StockEdge Version 6.0. Includes value additions in free as well as Premium content.
StockEdge Premium features include
- 6 Adaptive and Static Relative Strength Scans
- 2 New SuperTrend Scans
- Spider Chart in Edge Reports
- Sentiment Score of ConCall Analysis
- News and Updates in Business Houses
- New Mutual Fund Investment Theme on Focused Funds
Free Features include
- Mark your favorite watchlist as default to get to view the price movements of stocks in your watchlist on the My StockEdge homescreen.
- Volume Weighted Average Price (VWAP)
- Blogs In StockEdge Homepage
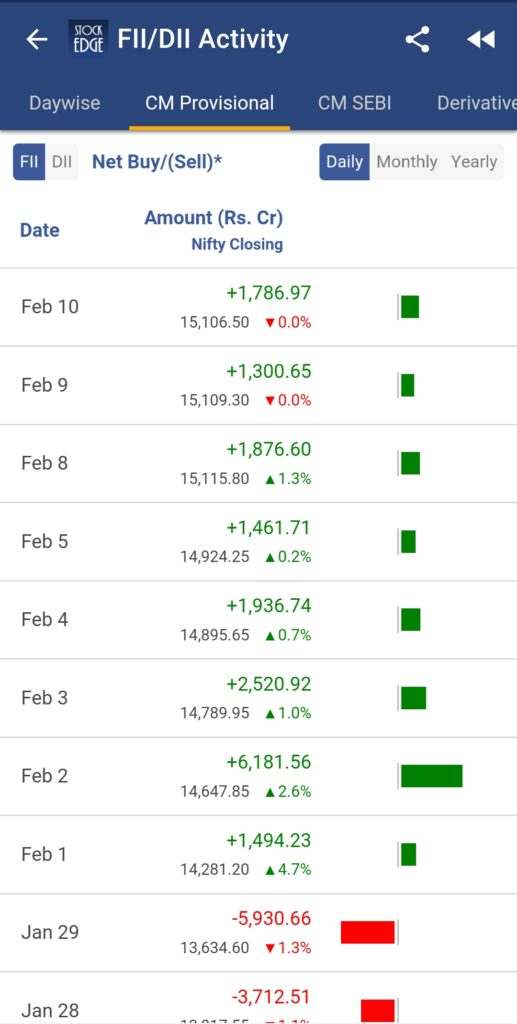
- Nifty Price and Change% in FII Activity
- Future OI Increase/Decrease Scans from Homepage
Now let us have a brief overview of what these features are all about.
Adaptive and Static Relative Strength
What Is Adaptive Relative Strength (ARS)?
Adaptive Relative strength is a momentum indicator that measures the strength of the price movement of a stock vis-a-vis the benchmark index (Nifty/Sensex). The benchmark date considered here has been predefined by StockEdge based on the last major market trend change date. These dates can be seen by plotting ARS in Edge Chart.
If a Stock has performed better than the benchmark then ARS is positive, ARS 0 signifies exact same movement of the stock and negative ARS signifies Stock has underperformed benchmark index.
The indicator can also be used to compare two companies in the same industry or Index. This comparison examines the relative strength performance of two stocks with respect to their benchmark or sector and can help to decide whether one should hold, buy, or sell the other.
What Is Static Relative Strength (SRS)?
Static Relative strength is a momentum indicator that measures the strength of the price movement of a stock vis-a-vis the benchmark index (Nifty/Sensex) over a period of 123 trading days.
If a Stock has performed better than the benchmark then SRS is positive, SRS 0 signifies exact same movement of the stock and negative ARS signifies Stock has underperformed benchmark index.
In StockEdge there are mainly 6 scans available for filtering out stocks for trading:
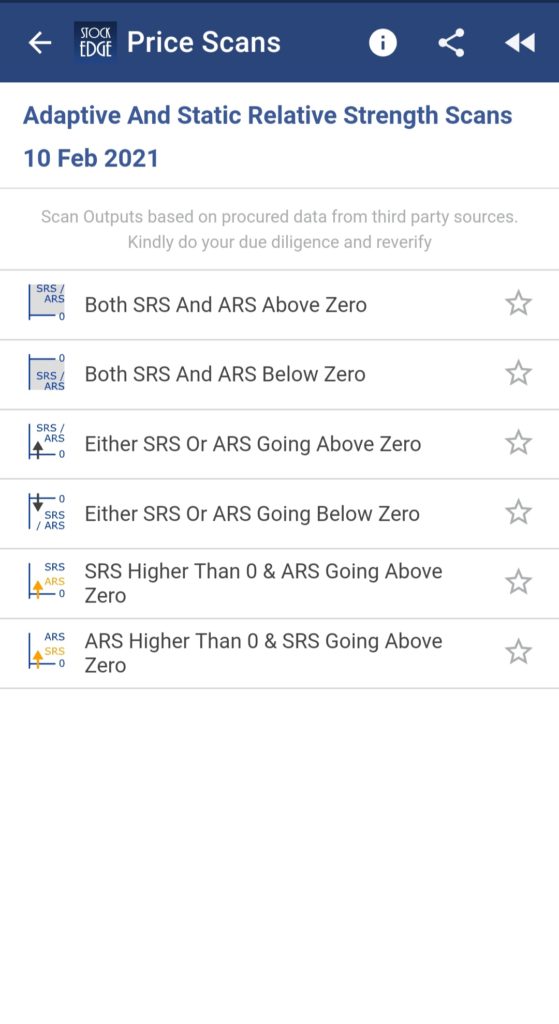
To study more about these scans – blog.stockedge.com.
2 NEW SuperTrend Scans
A SuperTrend is a trend following indicator. It is plotted on price and the current trend can simply be determined by its placement vis-a-vis price. This is a very simple indicator and is constructed with the help of just two parameters- period and multiplier.
The default parameters which are taken is 10 for Average True Range (ATR) and 3 for its multiplier for the construction of SuperTrend Strategy. The average true range (ATR) plays an important role in ‘SuperTrend’ as the indicator uses ATR to compute its value and it signals the degree of price volatility.
StockEdge is glad to add 2 more new scans in SuperTrend Scans which are :
- Price Nearing SuperTrend Support
- Price Nearing SuperTrend Resistance
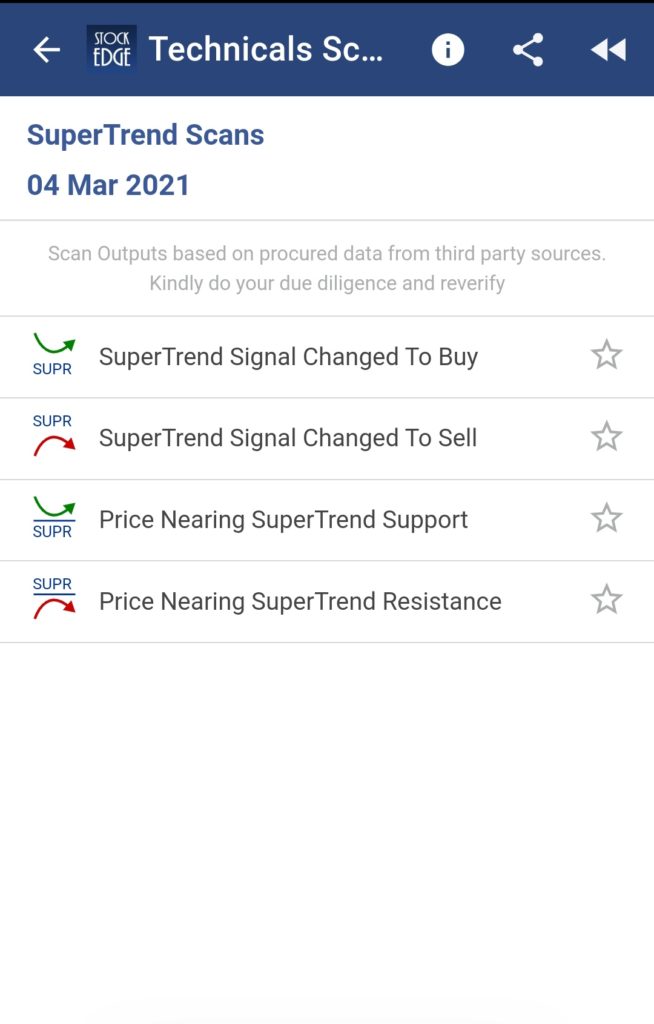
To study more and increase your understanding of the above scans, kindly Click Here.
Volume Weighted Average Price (VWAP)
Volume Weighted Average Price (VWAP) as explained in its name is the average price of the stock calculated on the basis of its volume and price throughout the trading session. It is calculated for each stock by dividing the total value of the shares of that respective date by the total volume of shares traded on that day.
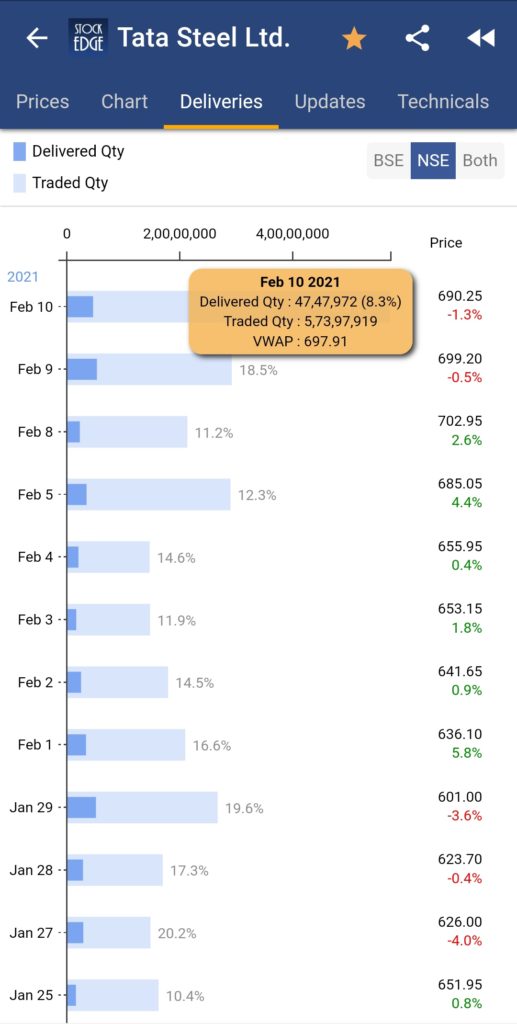
VWAP helps in determining the average price of the stock for the previous trading day which can be then compared to its closing price for the respective date to spot and analyse the price trend for the upcoming trading session as in when the closing price is above VWAP, it may indicate a positive trend i.e traders will take long positions and When the price is below VWAP it may indicate a negative trend, i.e traders taking short positions.
Blogs in StockEdge Home Page
StockEdge is glad to introduce its blogs section designed and incorporated in the StockEdge Home Page for our traders and investors for increasing their knowledge and understanding about Stocks, Fundamental and Technical Scans, Mutual Funds and StockEdge Tutorials through our varied categories of blogs.
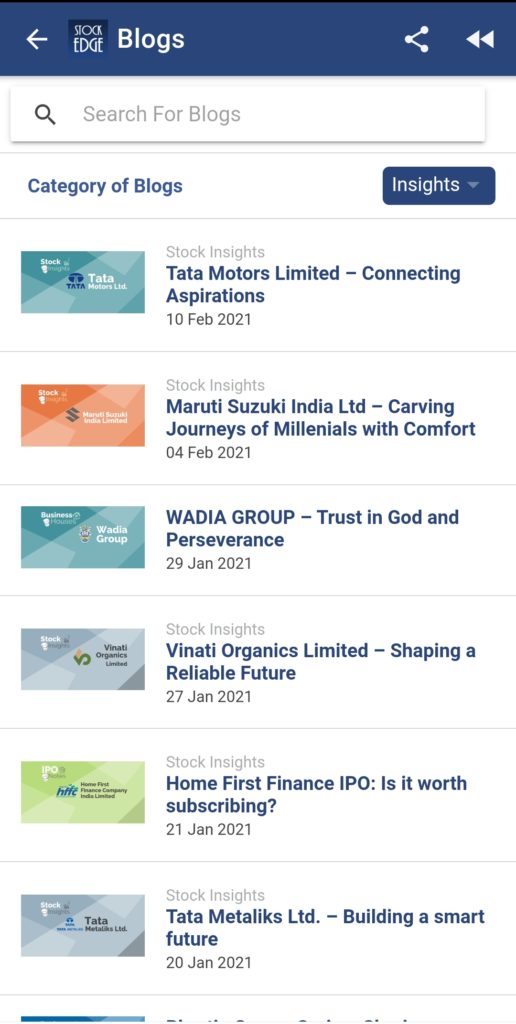
Kindly Click StockEdge Blogs for enriching your knowledge and understanding about the above mentioned topics.
Nifty Price and Change% in FII Activity
Price of the NIFTY 50 Index along with its Change % in the CM Provisional Tab in the FII/DII Activity. This addition will help the users to compare the provisional FII/DII activity in the cash market with the movement in the Nifty 50 Index to observe and analyse the impact of Foreign Institutional Investors(FII) in deciding the trend of the current and upcoming trading sessions.
Spider Chart in Case Studies in Edge Reports
Spider chart is an unique spider shaped chart creatively designed to provide a brief overview of the company depending upon 6 crucial business parameters : Growth, Profitability,Efficiency,Solvency,Valuation and Quality.
All Case Studies present in our Edge Reports are formulated keeping in mind these six aspects of business and are fundamentally researched and in depth analysed by our own team of Analysts who give a score to the company on each parameter in which 5 being the highest and 1 being the lowest score. Therefore the spider chart involves the score given by our team for each parameter and summing up all the scores gives us the Edge Meter Score of the stock out of 30. (6 Parameters *Max Value(5) = 30).
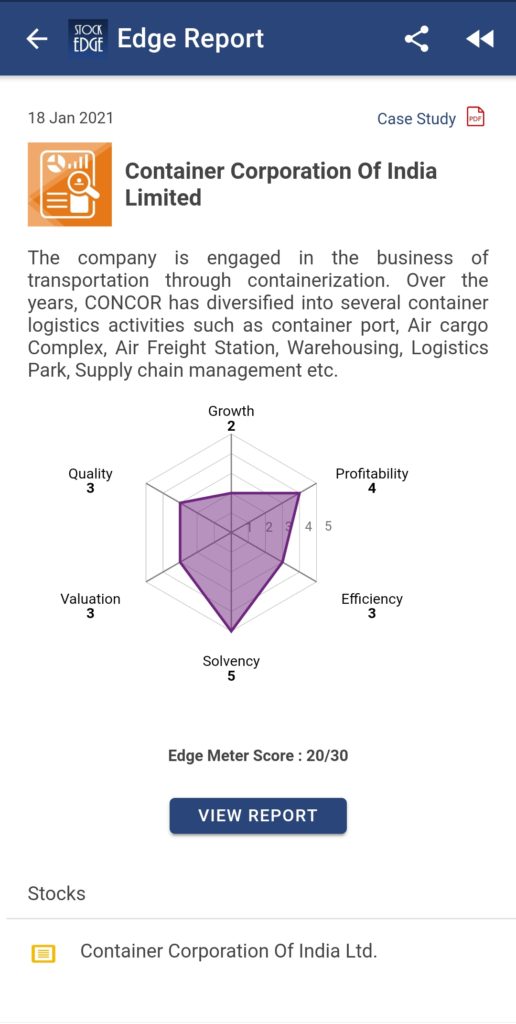
A stock having a score of 20 & above is considered to be a good stock in comparison to safety, risk-reward ratio and fundamentally strong.
Sentiment Score of ConCall Analysis
Sentiment Score added to ConCall Analysis which provides an indication about the company’s concall analysis keeping in mind its current and future prospects discussed in its concall. Sentiment Score is the measurement score of the stock in the riskometer bar ranging from -1(Negative) to +1 (Positive). This score is based on automated language processing. It is not any indication to buy or sell from StockEdge.
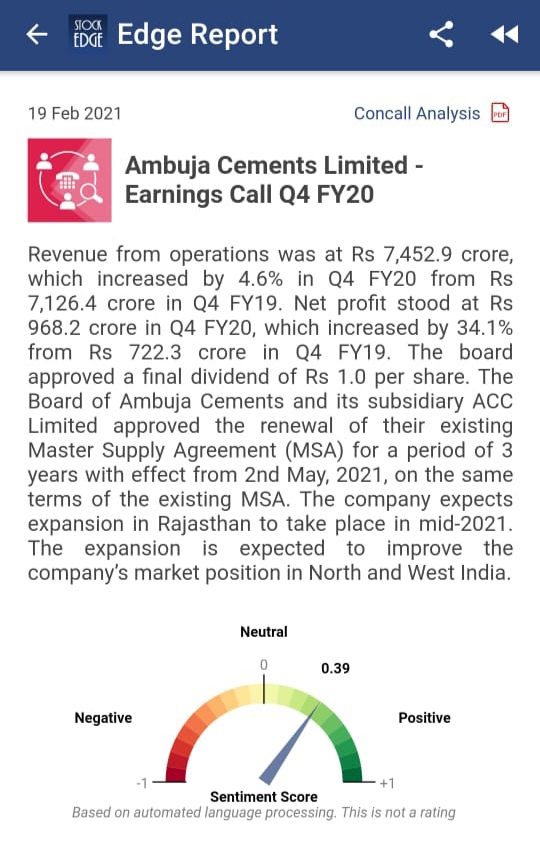
Higher the score, better is the chances of Company’s growth and future developments which will help our investors to take their calls accordingly as this score says a lot about the company’s current and future scenario and it is calculated with deep research and analysis of the ConCall Event by our knowledgeable team of analysts.
News and Updates in Business Houses
Two new tabs are being added in our Business Houses Section – News and Updates
News Tab – This tab will provide all news relative to all the stocks with respect to the relative Business House.
Updates Tab – This tab will provide all Announcements and Updates about all the stocks which are part of the respective Business House.
New Mutual Fund Investment Theme
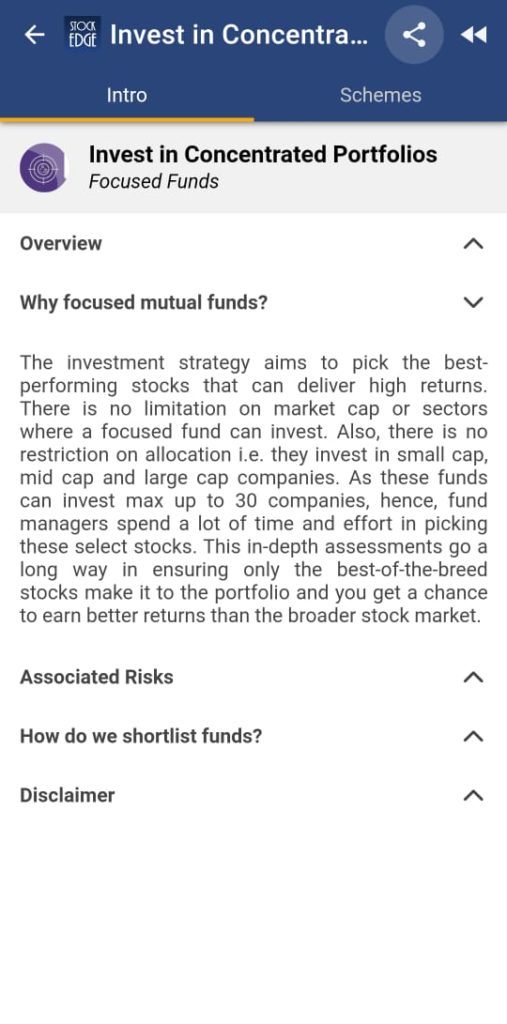
Our Team of Analysts has added a new Mutual Fund Investment Theme in the MF Investment Themes Section in the MF Homepage after thorough and in depth research for helping our users to invest in Concentrated Portfolios as in Focused Funds. This theme will provide you with the list of best of all Focused Funds.
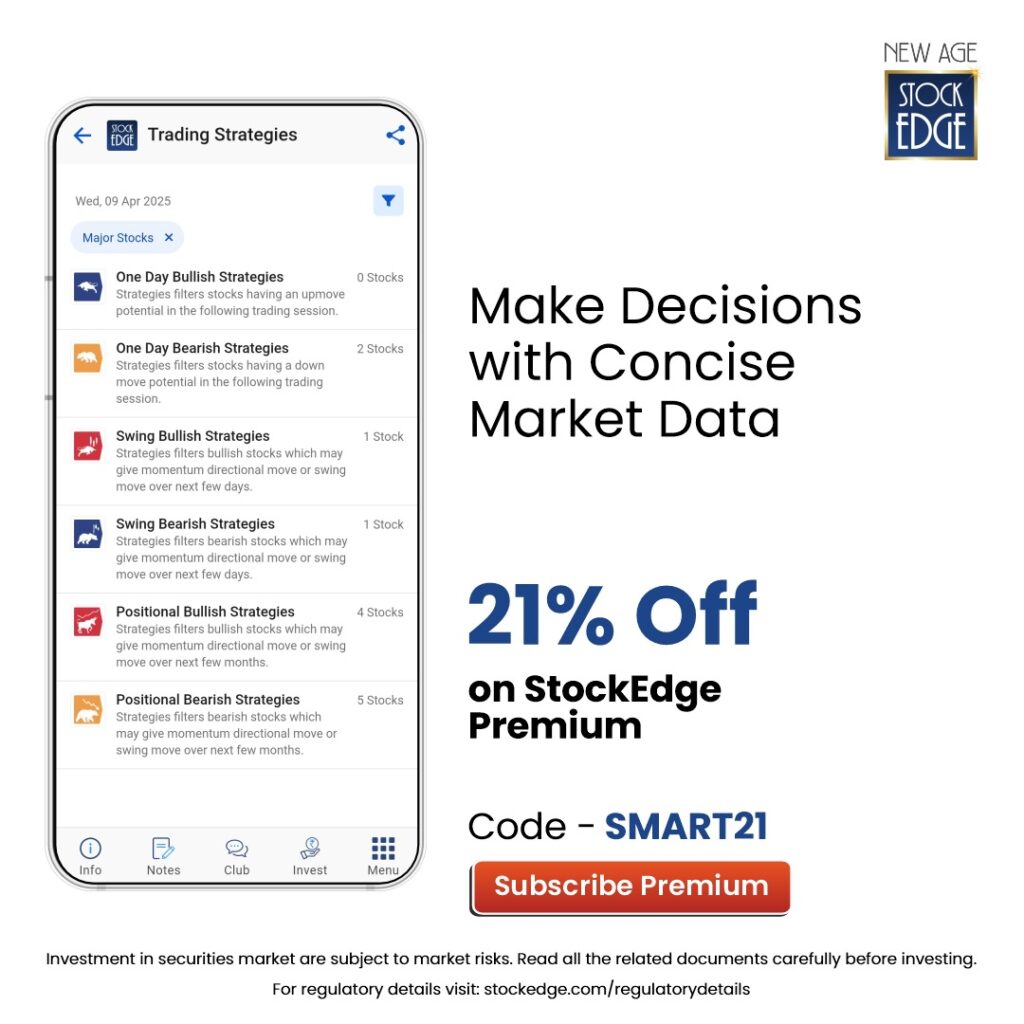
Check out StockEdge Premium Plans.
Many more interesting features have been added to make your experience all the more beautiful. So do not miss the chance to use this powerful tool, using which you can become an Independent Investor/trader.
Click here to download the latest version of StockEdge App to make your analysis faster, better and easier within minutes.





Dear vivikji I don’t have words about yours apps .I will say I earned a good money by yours apps i hated share market I was zero before four years when I got this apps slowly slowly I was learned some lesson then I interned in this field.thanks a lots of thanks brilliant .I salute you and your brilliant team.thanks thanks…….
We are glad you liked our application and content. Keep following us on Twitter to read more such Blogs!
Very good for knowledge
We are glad you liked the content. Keep following us on Twitter to read more such Blogs!