StockEdge.com
  • Products
    • StockEdge Premium
    • StockEdge Pro
    • StockEdge Club
  • Stories
StockEdge Blog
  • Trending Stocks
  • Insights
  • Technical Analysis
  • Fundamental Analysis
  • StockEdge Tutorials
  • Mutual Fund
No Result
View All Result
  • Trending Stocks
  • Insights
  • Technical Analysis
  • Fundamental Analysis
  • StockEdge Tutorials
  • Mutual Fund
No Result
View All Result
StockEdge
Home StockEdge Version Updates
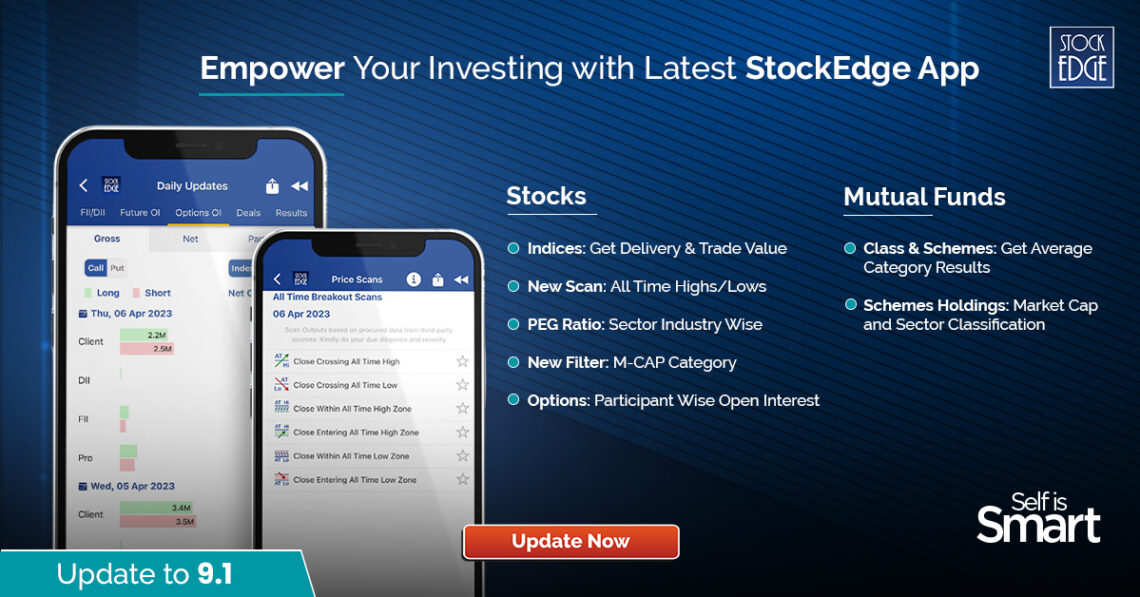
A promotional image for the latest stockedge app version 9. 1, showcasing its interface on two smartphones against a dark blue background. The app provides daily updates, price scans, and information on stocks and mutual funds

StockEdge Version Update: 9.1 – Empower Your Investing

StockEdge by StockEdge
December 19, 2023
Reading Time: 9 mins read
1.5k
VIEWS
Share on FacebookShare on XShare On WhatsApp

Table of Contents

  • All-Time Breakout Scans 
  • Inclusion of New Filters – MCap Category and BSE PSU
  • MF Category Average Return in Classes and Schemes
  • MF Category Wise & Scheme Wise Key Parameters
  • Market Cap and Sector Classification in Mf Schemes Holding
  • Delivery Data of Indices
  • Participant Wise Open Interest – Options
  • PEG Ratio of Stocks in Sector

StockEdge launches its latest version 9.1 including new features, bug fixes and improvements over the previous version.

We incorporate a few new features into each release that help StockEdge users better understand the financial markets.

And in this most recent version, StockEdge is happy to add some key features in the Mutual Fund Section along with some more powerful additions in the equity section:

In this release, we introduce the following features to our users: 

  1. All-Time Breakout Scans
  2. Inclusion of New Filters – MCap Category and BSE PSU
  3. MF Category Average Return in Classes and Schemes
  4. MF Category Wise & Scheme Wise Key Parameters
  5. Market Cap and Sector Classification in Mf Schemes Holding
  6. Delivery Data of Indices
  7. Participant Wise Open Interest – Options
  8. PEG Ratio of Stocks in Sector

Continue reading for a more detailed study of the above-mentioned features:

All-Time Breakout Scans 

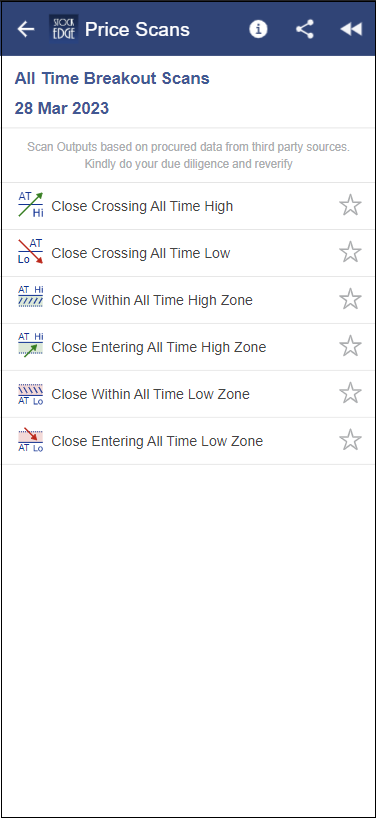
All Time breakout scans are price scans that will enable you to filter out stocks on the relation of their current and all-time high and low prices.

This scan category has been displayed after 5 Year Breakout Scans and includes 6 new Scans to the family.

The respective Scans are : 

A screenshot of a list of stock prices scans as of 28 march,2023. The list is titled as

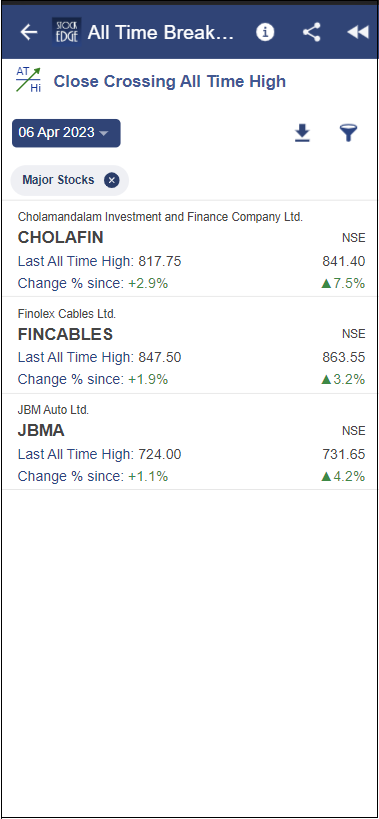
Close Crossing All-Time High

This scan filters out stocks that have crossed their all-time high prices and closed above them respectively.
A screenshot of the stockedge app showing the performances of different stocks according to their

Like we can see in the above image Cholamandalam Investment and Finance Company Ltd has crossed its All-Time High of 817.75 and closed above it at 841.40, giving an all-time breakout.

Close Crossing All-Time Low

This scan filters out stocks that have crossed their all-time low prices and closed below them respectively.
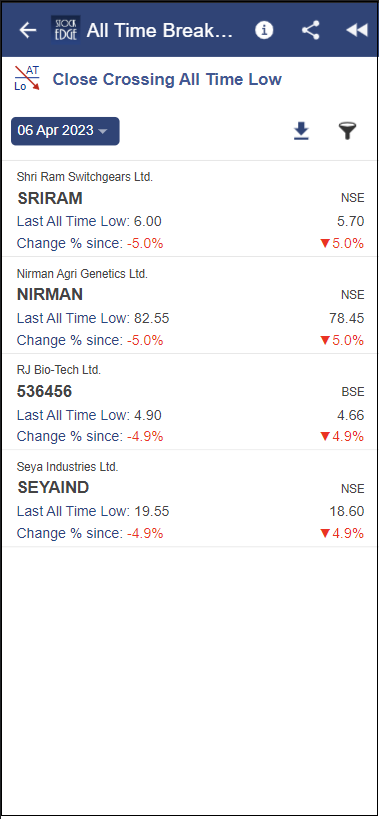
A screenshot of the stockedge app showing the performances of five different stocks according to their all time low as of 06 april,2023.

Closed Within All Time High Zone

This scan filters out stocks that have closed within the range of 15% of their All Time High prices and have high chances of reaching out for an all-time breakout.
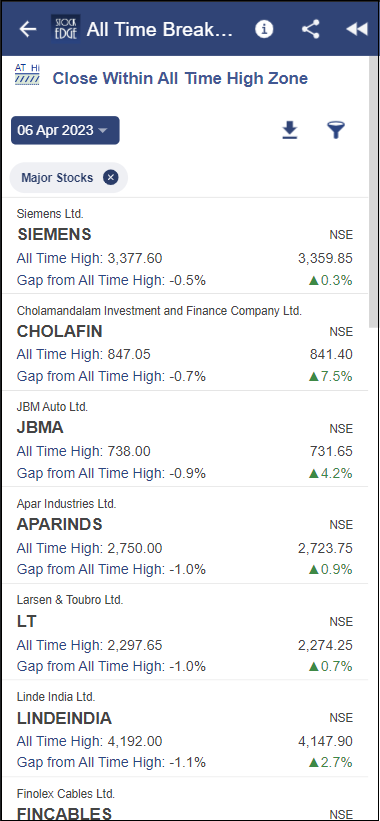
A screenshot of the stockedge app showing their bperformances according to their all time high zones as of 06 april,2023.

Close Entering All Time High Zone

This scan filters out stocks that have just entered and closed within the 15% range of their All time-high prices.
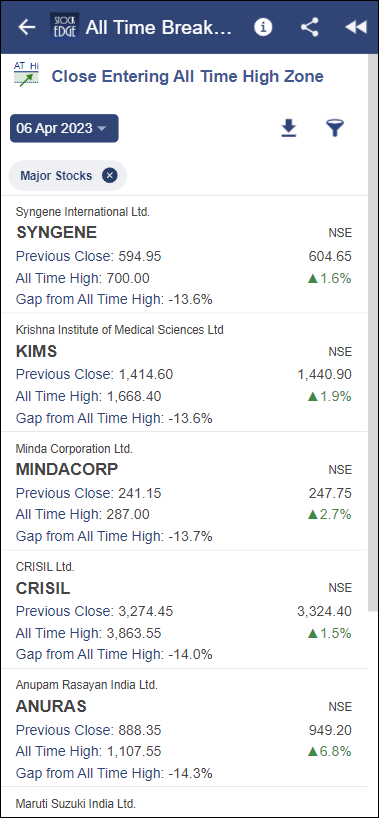
A screenshot from the s tockedge app showing different stocks which are close within their all time high zones as of 06 april,2023.

Closed Within All Time Low Zone

This scan filters out stocks that have closed within the range of 15% of their All Time low prices.
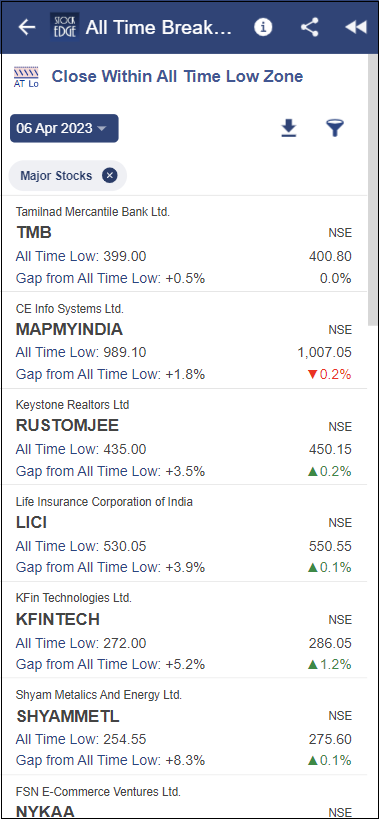
A screenshot from the stockedge app showing prices of different stocks which are close within their all time low zones as of 06 april,2023.

Close Entering All Time Low Zone

This scan filters out stocks that have just fallen down and closed within the 15% range of their All time-low prices.
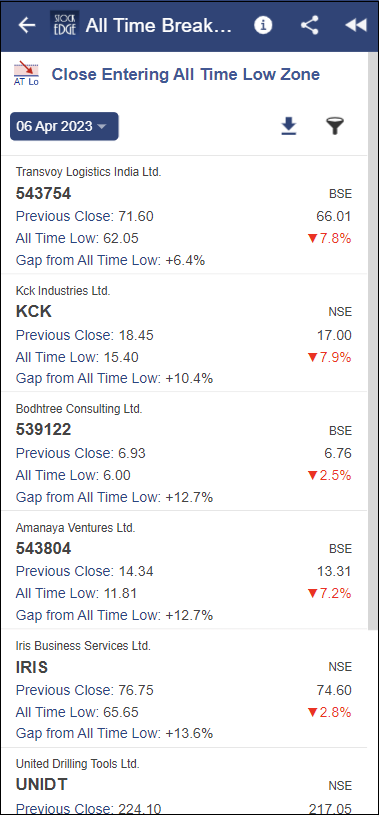
A screenshit from the stockedge app of different stocks which are close entering all time low zones as of 06 april,2023.

Inclusion of New Filters – MCap Category and BSE PSU

StockEdge has enhanced its advanced filters by adding a whole new category of filter: By Category, i.e Market Cap Category – Large Cap, Mid Cap & Small Cap and the addition of a new index in the By Importance category: BSE PSU.

Two screenshots of stock market filter interface. The left screenshot has “all categories” selected under “by category” and “all market caps” selected under “by market cap”. The right screenshot has “nse stocks” selected under “major stocks” and “nifty 500” selected under “by sector”.

A market Cap Category Filter is added so that our users can filter out stocks on the basis of the above market cap categories.

BSE PSU filter is added so that the output can be filtered for PSU stocks.

MF Category Average Return in Classes and Schemes

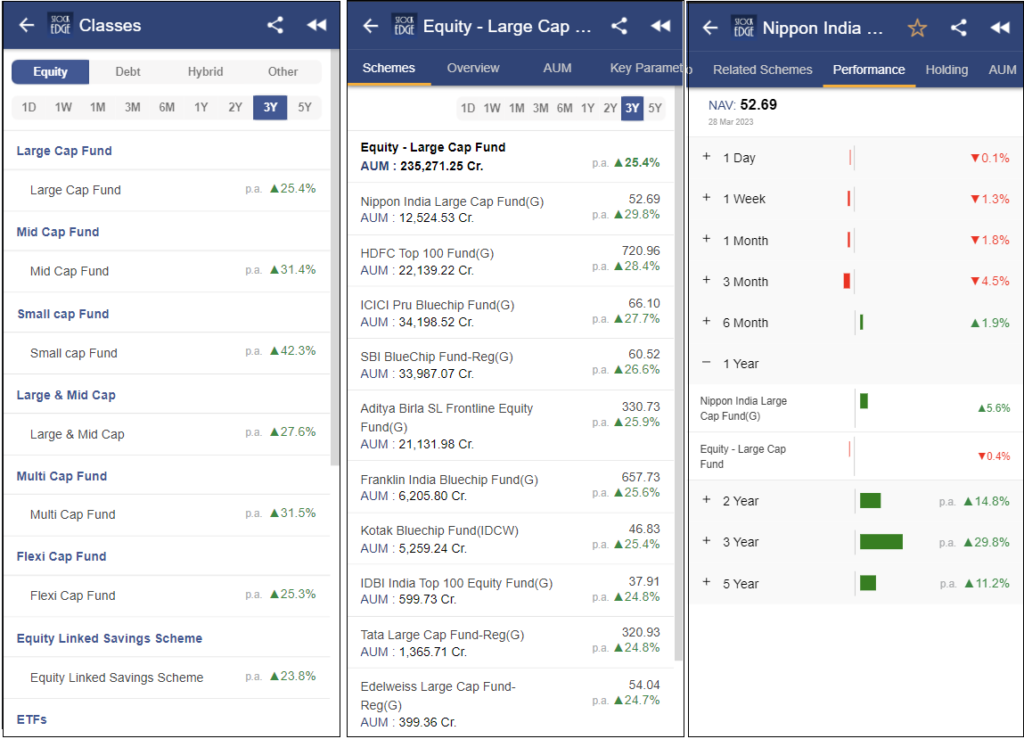
The category returns help us to compare different categories in terms of returns for different time frames. It helps the user to determine which categories meet their return expectations for a particular time frame. It can serve as a good starting point for the user in his/her quest to find a suitable scheme for investment. Having the category return also helps to see which schemes have outperformed/underperformed the category in terms of returns. 

Thereby, StockEdge has launched category average returns on class and scheme levels so that investors can compare and filter out across best-performing classes leading to the selection of best-performing funds across a specific class.

A scrrenshot of the tockedge app. It is divided into three sections which shows equity  of differente large, mid and small cap funds on the left, the different schemes of different equity cap funds and the right one shows the performance of stock prices over a period of nippon india pvt ltd.

MF Category Wise & Scheme Wise Key Parameters

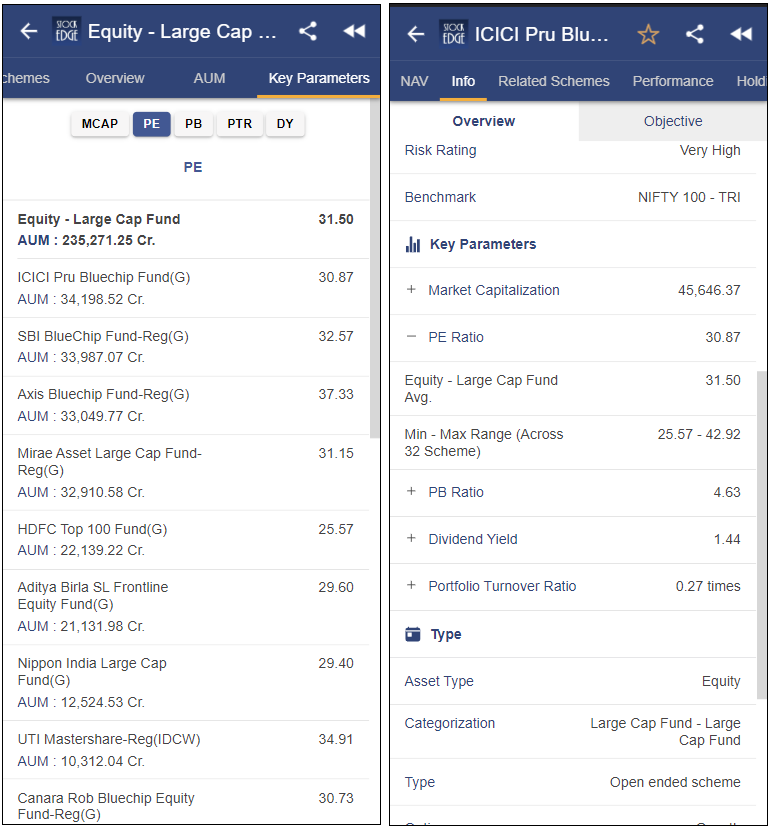
Key parameters for the category on an average will help the user to compare a particular scheme’s key parameter vs that of the category. It just gives a better sense of where the scheme stands in terms of the overall category, considering the key parameters. It gives us a sense of the fund manager’s investment strategy/framework.

The image is a screenshot of a table comparing different mutual funds and their performances.

Market Cap and Sector Classification in Mf Schemes Holding

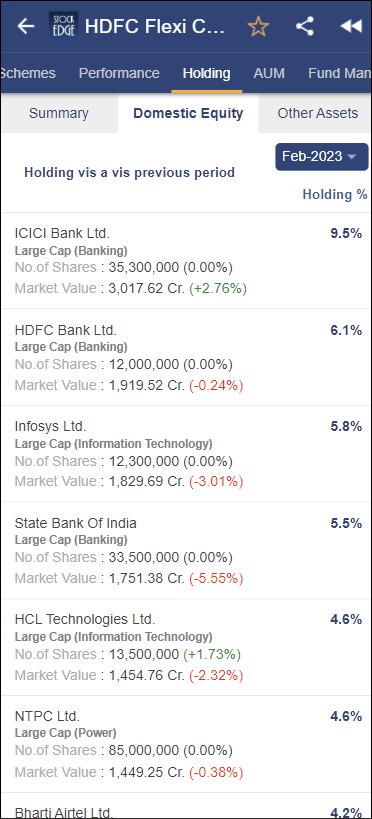
The market-cap and sector classification for a scheme’s holdings will give the user a much better sense of the fund manager’s investment strategy, sectoral inclination, and market-cap inclination. Many times, the user might only look at the top holdings of a scheme and not go through the entire stock holdings. In this case, having the sector and market-cap classification for those top holdings will give the user a much better sense of the type of stocks held by the scheme.

A screenshot from the stockedge app showing stock prices of large cap funds as of feburary 2023.

Delivery Data of Indices

Understand and interpret the trade and delivery data of Indices calculated on the basis of trade and delivery of the constituent stocks of the respective index. Interpreting and analysing the delivery and traded value of indexes provide a key overview of the liquidity scenarios along with the demand and supply of the respective indexes ( based on its stock constituents).
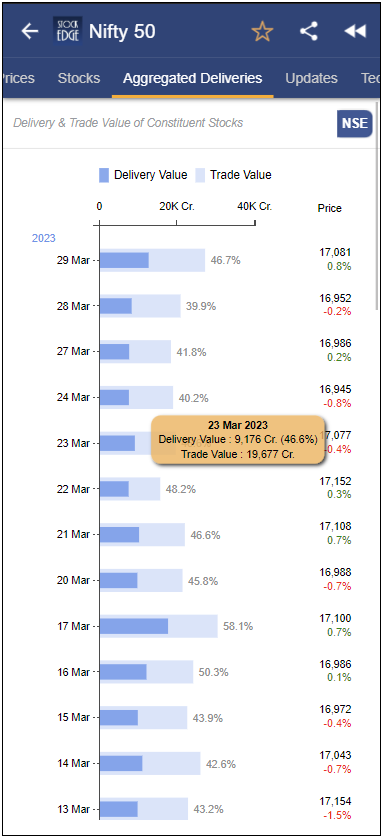
A screenshot of stockedge app showing a bar diagram of diffrent delivery value and percentage of its trade valuee for the month of march,2023.

Analyse the market trend and traders’ and investors’ overall view with respect to the Index on the basis of changes in the trend of trade and delivery value.

Participant Wise Open Interest – Options

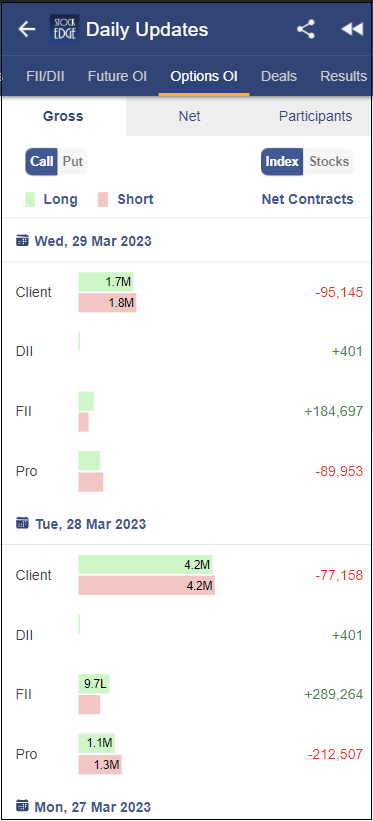
Options Open Interest provides an overview of the current market expectations with respect to the positions of key participants in the market: Client, FII, DII and Pro.

A screenshot stockedge app showing daily updates for future and options contracts.

It provides the view of the respective participants about the markets and one can inter and co-relate it with the market levels to better understand and comprehend it.

PEG Ratio of Stocks in Sector

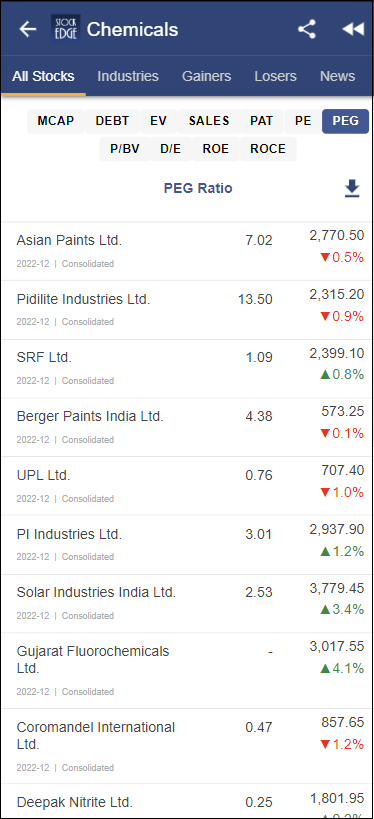
PEG Ratio is the Price to Earnings Growth Ratio which is calculated by dividing the P/E ratio of the stock but its growth. Over here growth% is taken as the 5-year Net Profit CAGR.

A screenshot of stockedge app of different indian chemicsl companies and their stock prices. The list is sorted by the company’s p/bv ratio. The list includes the company’s name, p/bv ratio, p/e ratio, roe, and stock price

The PEG ratio helps in understanding the valuation of the stocks with respect to their historical growth trends. When added to the sector section, it gives immense value in analysing and comparing stocks with their peers in the same sector.

This is it for now from Team StockEdge. We hope these features enhance your investment journey and make StockEdge more valuable.

If you enjoy using StockEdge, don’t hold back from sharing the platform with your near and dear ones.

Check out StockEdge’s Premium Plans to get the most out of it. Also, watch this space for our midweek and weekend editions of ‘Stock Insights‘.

Tags: all time breakoutall time highall time lowAVerage MaturityBSE PSUKey ParametersMarket Cap CategoryModified Durationmutual funds category returnsPBPEPEG RatioPortfolio TurnoverStockEdge
ShareTweetSend
Open A Zero Brokerage Account In Kotak Open A Zero Brokerage Account In Kotak Open A Zero Brokerage Account In Kotak
Previous Post

Aster DM Healthcare’s Spinoff of Gulf Hospitals – A Special Situation You Can’t Afford to Miss!

Next Post

Zomato Shares/Stock Analysis: Profile, Financials & Growth

StockEdge

StockEdge

StockEdge is a self-help Equity and Mutual Fund research tool. It empowers retail investors to identify investment opportunity with all the necessary data and analytics.

Next Post
Zomato shares

Zomato Shares/Stock Analysis: Profile, Financials & Growth

Simplify stock market analysis with edge reports | stockedge

Simplify stock market analysis with Edge Reports | StockEdge

Image in a blue background that reads all about nifty 50 and its components.

All About NIFTY50, Components of NIFTY50, and How to Invest in it

Comments 3

  1. Avatar of g. M. Narendra G.M. NARENDRA says:
    2 years ago

    Excellent information regarding mutual funds

  2. Avatar of g. M. Narendra G.M. NARENDRA says:
    2 years ago

    Very good information regarding mutual funds

  3. Avatar of rajesh kumar gupta Rajesh Kumar Gupta says:
    2 years ago

    Very Good Application, Thanks Mr Bajaj ji,

    please add a facility to short Vollume wise investment of Large investors, At present it is Alphavatically only,

Disclaimer

StockEdge (Kredent InfoEdge Pvt. Ltd.) is a SEBI-registered Research Analyst (RA) entity (SEBI Registration No: INH300007493). The information provided in this article is for educational and informational purposes only and should not be considered as an offer to buy or sell any securities or investment products.

The stocks, securities, and investment instruments mentioned herein are not recommendations under SEBI (Research Analysts) Regulations, 2014. Readers are advised to conduct their own due diligence and seek independent financial advice before making any investment decisions.

Investments in securities markets are subject to market risks. Please read all related documents carefully before investing. Investing in Equity Shares,
Derivatives, Mutual Funds, or other instruments carry inherent risks, including potential loss of capital. StockEdge (Kredent InfoEdge Pvt. Ltd.) does not provide any guarantee or assurance of returns on any investments. Past performance is not indicative of future performance.

Contact Us
  • Timing (Mon-Sat): 10 am to 7 pm
  • Sales: +919830994463
  • Support: +919830994402
  • Club Support: +916289906895
  • Affiliate: +917003567131
Recent Posts
Check out the Top 3 Consumption Stocks in India
Top 3 Consumption Stocks in India
Ather Energy IPO: All You Need to Know
Important Links
  • StockEdge.com
  • StockEdge Premium
  • StockEdge Pro
  • StockEdge Club
  • Compare Plans
An Initiative Of
Logo of KREDENT INFOEDGE with SEBI Registration no.

© 2025 Kredent InfoEdge Pvt Ltd.

Facebook-f Twitter Instagram Linkedin-in Youtube Pinterest-p Whatsapp Telegram

Get StockEdge App

No Result
View All Result
  • Home
  • Article Categories
    • Trending Stocks
    • Insights
    • Technical Analysis
    • Fundamental Analysis
    • StockEdge Tutorials
    • Mutual Fund
  • Stories
  • Products
    • StockEdge Premium
    • StockEdge Pro
    • StockEdge Club
  • Visit StockEdge.com

© 2024 Kredent InfoEdge Pvt Ltd.

Get 20% off on StockEdge Premium.