StockEdge.com
  • Home
StockEdge Blog
  • Trending Stocks
  • Insights
  • Technical Analysis
  • Fundamental Analysis
  • StockEdge Tutorials
  • Mutual Fund
No Result
View All Result
  • Trending Stocks
  • Insights
  • Technical Analysis
  • Fundamental Analysis
  • StockEdge Tutorials
  • Mutual Fund
No Result
View All Result
StockEdge Blog
Home Tutorials StockEdge Tutorials

Technical Analysis using Edge Charts

StockEdge by StockEdge
May 26, 2021
Reading Time: 3 mins read
9.3k
VIEWS
Share on FacebookShare on TwitterShare On WhatsApp

Technical Analysis

Edge Charts is one of the most widely used and effective premium feature of StockEdge for technical analysis and it fits very well with the main aim of StockEdge i.e. Getting an edge in your analysis and markets and that’s what exactly edge charts are meant for.

Edge Charts is a powerful advanced tool with 4 exclusive charting patterns : Candlestick, OHLC, Area and Line Charts. Traders and investors have an option to plot charts on periods ranging from 1 Day to 5 Years for both NSE and BSE.

Traders can draw trend lines and plot various technical parameters and metrics to enhance their research and analysis. There are 30 different set of technical parameters with all having different basis and conclusions which can be combined to deliver out their synergistic results.

Traders and Investors can even do time period analysis based on different charting periods available and can even save their combination of parameters as a predefined template.

Lets take an example of a stock and understand the very basics of technical analysis and what one should actually look for in a stock when performing a technical analysis, especially helpful for traders:

We have taken the Edge Charts of Tata Elxsi Ltd, now let us understand how this stock is gonna perform and what signals can be drawn out from its technical analysis of charts:

Download StockEdge App Download StockEdge App Download StockEdge App
  1. Let us understand the very basics of doing Technical Analysis with understanding OHLC and how the share prices change and how the candlestick bars are plotted:
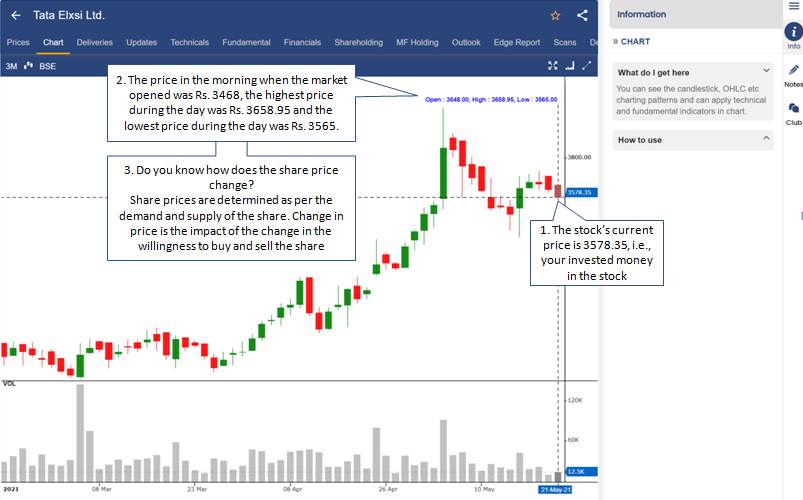
Tata Elxsi

2. Now let us understand what does the line and candlestick charts imply at different price levels and trends and that is why 1Y chart has been plotted to have a complete holistic view of all kind of trend signals:
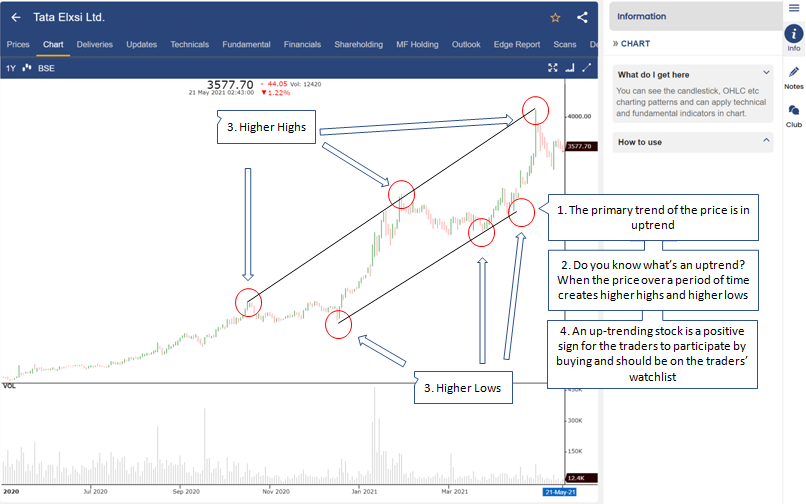
Technical Analysis

3. What is Volume and Delivery and significance of it in Technical analysis:
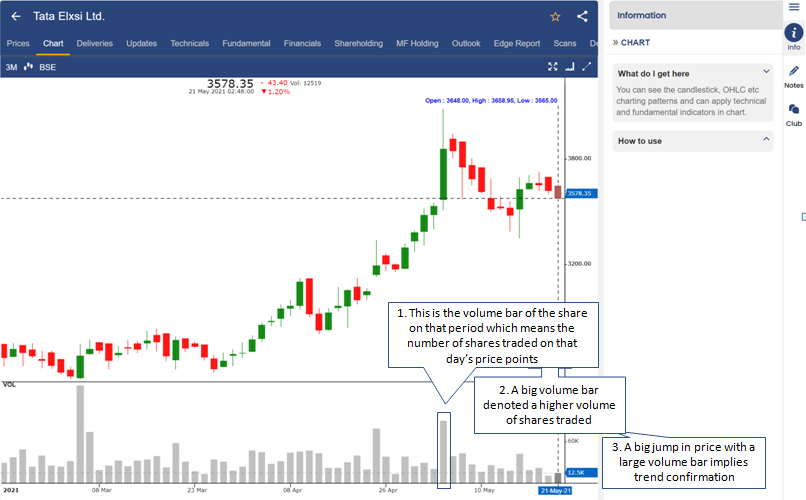
Volume and Delivery

So as far we have learnt the very basics of doing technical analysis and it is understanding the OHLC points, the plotting of different kind of charts and the identification of price trend signals and significance of volume and delivery. Using Edge Chart you can not only do Technical Analysis but Fundamental as well, where you can plot EBITDA, Net profit, Sales, Ratios shareholding and much more in the chart itself to see the trend along with the price chart.

Edge Chart is a premium offering. To use this feature subscribe to our StockEdge premium plans

Read our blog on Adani Transmission Limited – Energizing India, Enriching Lives.

For more knowledge avail the course of Technical Analysis on Elearnmarkets – CERTIFICATION IN ONLINE TECHNICAL ANALYSIS

Tags: buycandlestickschartsOHLCprice trendsellStockEdgetechnicaltechnical analysisvolume
ShareTweetSend
Subscribe On Telegram Subscribe On Telegram Subscribe On Telegram
Previous Post

Trending Stocks – Indoco Remedies Ltd.

Next Post

StockEdge Version Update 6.1

StockEdge

StockEdge

StockEdge is a self-help Equity and Mutual Fund research tool. It empowers retail investors to identify investment opportunity with all the necessary data and analytics.

Related Posts

StockEdge Version Update 8.0 – Like never before
StockEdge Tutorials

StockEdge Version Update 8.0 – Like never before

April 28, 2022
6.7k
Derivative Analytics
StockEdge Tutorials

Derivative Analytics – An Insightful Research Tool

April 28, 2022
2.2k
Market Breadth – A Bird’s Eye View of the Market at 1 place
StockEdge Tutorials

Market Breadth – A Bird’s Eye View of the Market at 1 place

April 28, 2022
758
Next Post
StockEdge Version Update 6.1

StockEdge Version Update 6.1

Trending Stocks – Tide Water Oil Co. (India) Ltd.

Trending Stocks – Tide Water Oil Co. (India) Ltd.

Trending Stocks – Lux Industries Ltd.

Trending Stocks – Lux Industries Ltd.

Comments 1

  1. Pradeep Bagde says:
    12 months ago

    Its wonderful things .

    Reply

Leave a Reply Cancel reply

Your email address will not be published. Required fields are marked *

Contact Us

  • Timing (Mon-Sat): 10 am to 7 pm
  • Sales: +919830994463
  • Support: +919830994402
  • Club Support: +916289906895
  • Affiliate: +917003567131

Recent Posts

Sharda Cropchem – Ending the year with a strong performance in Q4FY22

May 15, 2022

ABB India – An outstanding overall performance

May 8, 2022

Important Links

  • StockEdge.com
  • StockEdge Premium
  • - Quarterly Membership
  • - Annual Membership
  • StockEdge Analyst
  • StockEdge Club
  • Compare Plans

An Initiative Of

© 2021 Kredent InfoEdge Pvt Ltd.

Facebook-f Twitter Instagram Linkedin-in Youtube Pinterest-p

Get StockEdge App

No Result
View All Result
  • Home
  • Article Categories
    • Fundamental Analysis
    • Technical Analysis
    • Market Themes
    • StockEdge Tutorials
    • StockEdge Version Updates
  • StockEdge Premium
    • Quarterly Membership
    • Annual Membership
    • StockEdge Analyst
    • StockEdge Club
    • Compare Plans
  • Visit StockEdge.com

© 2021 Kredent InfoEdge Pvt Ltd.