Table of Contents
When we select a stock to trade, a lot of analysis is needed before that. We have to do the fundamental and technical analysis for the stock ideas. We need to apply many scans both fundamental and technical to filter out the stocks in which we want to put our money. StockEdge has made easy for us to filter out the stocks by using multiple fundamental, technical, price, volume and delivery scans, candlesticks, future and option scans. In this article we will discuss how to make combination scans with our favorite strategies.
Before further moving on you should know that combination Scans is a paid feature.
Stock Ideas – How to create Combination scans?
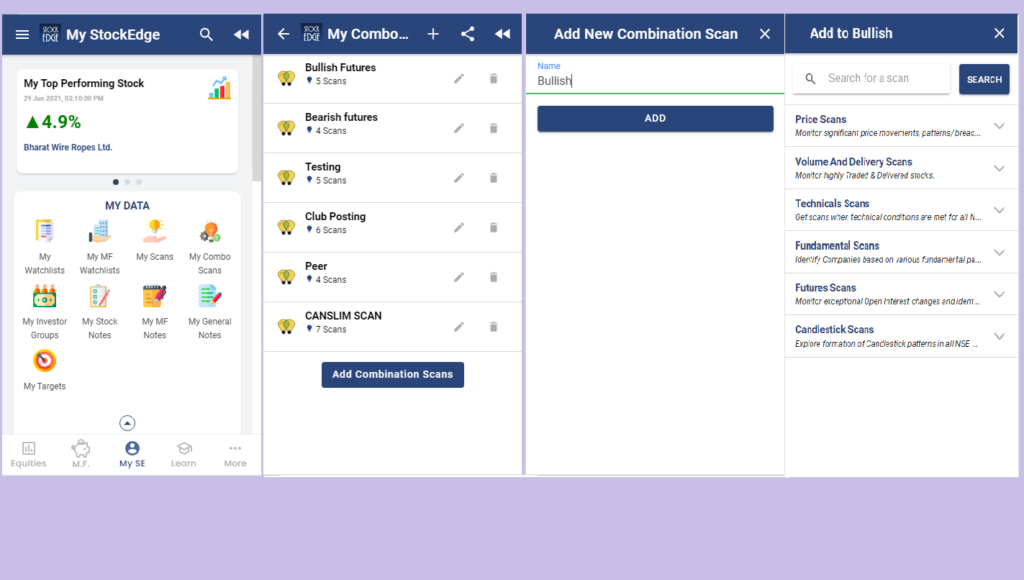
- In the “My StockEdge” you will see the tab of “My combination scan” click on it. After clicking on it you will get the option of “Add combination scans” and other combination scans which you have already created. We can create a maximum of 20 combination scans.
- After clicking on “Add New Combination Scan” you have to give a name to your combination scan and then click on “add”. For example, I want to make a bullish combination scan so I name my combination scan as Bullish.
- A screen will come with scans and stocks tab. In the scan tab, you will see “+” sign. Click on the “+” sign and you will get multiple fundamental, technical, price, volume and delivery scans, candlesticks, future and option scans.
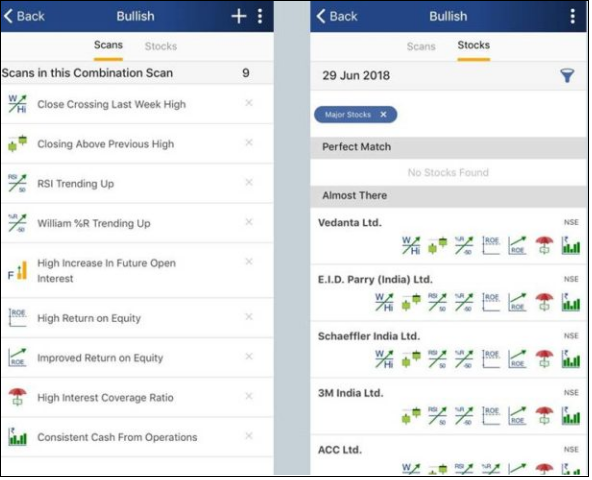
4. From these scans, we can choose which technical or fundamental scan we want to combine to make our strategy. As I am making a “bullish” combination scan, I am adding the below conditions. You can choose your own scans; this is just an example and no recommendation:
Examples:
Creating a Bullish Strategy using Combination Scan:
Scans:
Price Scans:
- Closing above Previous High: This is a bullish indicator it signifies the stock is closing above yesterday’s high
- Close Crossing Last Week High: This is a bullish indicator because it indicates the stock is moving upward and has crossed its last week’s high.
Technical Scans:
- Relative Strength Indicator Trending Up: It is an uptrend signal of RSI value has crossed above 50 from below.
- William % R Trending up: It is an uptrend signal if William % R has crosses -50 from below
Open Interest Scans:
- High Interest in Future Open Interest: This is a neutral indicator because it signifies the future OI has increased
Fundamental Scans:
- High Return on Equity: This indicates that the company is generating good returns for its equity shareholders.
- Improved Return on Equity: This indicates that the company has shown improvement by generating a better return for its equity shareholders in the latest financial year.
- High Increase in Quarterly Sales YoY: This indicates that the company is showing good growth in quarterly sales computed on Year on Year basis.
- High-Interest Coverage Ratio: This indicates the company is able to generate twice as much as EBIT to cover its interest expense
- Consistent Cash from Operations: This indicates that the company regularly generates positive operating cash flows
After we create our strategy, we need to see which stocks satisfy these conditions, go to the “stocks” tab and click on it. The list of stocks will appear on the screen. “Perfect Match” stocks are those which fulfill all the conditions of our strategy and “Almost There” stocks are those which have some of the conditions but do not fulfill all the strategies. In the image below, we can see that there are no “Perfect Match” stocks but many “Almost There” stocks like E.I.D Parry (India) Ltd., Vedanta Ltd. etc.
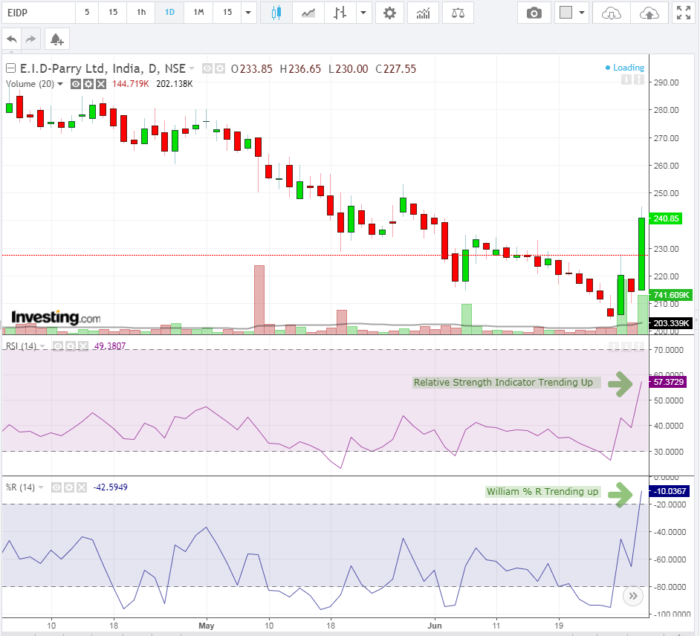
In the chart above, we have plotted the technical scans which we have used in our strategy and we can see that RSI is above 50 and William % R is trending up. We can expect a bullish move next day.
Creating Bearish Strategy using Combination Scan:
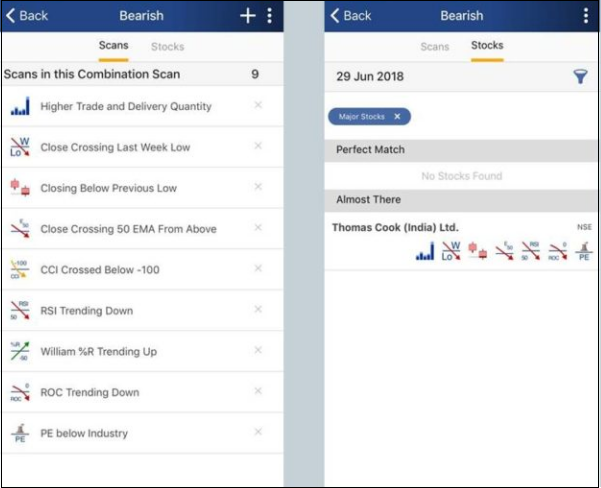
Scans:
Price Scans:
- Closing below Previous Low: This is a bearish indicator it signifies the stock is closing below yesterday’s high
- Close Crossing Last Week Low: This is a bearish indicator because it indicates the stock is moving downward and has crossed its last week’s low.
Volume and Delivery Scans
Higher Traded and Delivery Scan: This indicates increased total and delivered quantity in a stock and reinforces the current trend.
Technical Scans
Close Crossing 50 EMA from above: This is a bearish indicator because it signifies the stock is falling in the short term.
CCI crossed below -100: CCI has crossed -100 from above indicating bearish signal
RSI Trending Down: It is a downtrend signal if RSI value has crossed below 50 from above
William % R Trending down: It is a downtrend signal if William % R-value has crossed below -50 from above
ROC trending down: It is downtrend signal if ROC value has crossed below 0 from above.
Fundamental Scans
PE Below Industry: This indicates that the stocks with PE less than industry PE are considered undervalued
After we create our strategy, we need to see which stocks satisfy these conditions, go to the “stocks” tab and click on it. The list of stocks will appear on the screen. “Perfect Match” stocks are those which fulfill all the conditions of our strategy and “Almost There” stocks are those which have some of the conditions but do not fulfill all the strategies. In the image below, we can see that there is no “Perfect Match” stocks but “Almost There” stocks like Thomas Cook (India) Ltd.
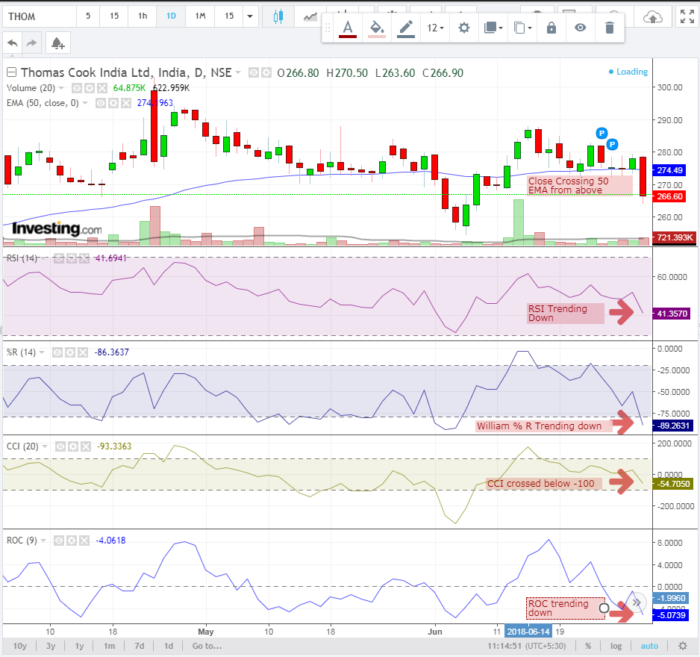
In the chart above, we have plotted the technical scans which we have used in our strategy and we can see that RSI is below 50, William % R is trending down, ROC trending down etc. We can expect a bearish move next day.
To know more about Combination Scans, you can watch the video below:
Bottomline
There are so many stocks listed in NSE and BSE that it is quite difficult to do fundamental and technical analysis for every stock. From the above discussion, we can see that through StockEdge how easily we can add fundamental, technical, option scans and we can create our own bullish or bearish strategy and filter out the stock that is listed in NSE and BSE.


