Table of Contents
Open interest is like the potato of the trading world – nobody really pays attention to it until it’s gone. But just like how the absence of potatoes can ruin a good meal, not understanding open interest can ruin your trading strategy. It’s that silent factor that quietly affects the market, and only the wise ones who pay attention to it get to enjoy the delicious profits. So don’t underestimate the power of open interest, my friends. It may seem unassuming, but it’s a mighty ingredient that can make or break your trades.
What is Open Interest?
OI is the total number of outstanding contracts that are held by market participants at the end of each day. Open interest measures the total level of activity into the futures market. It can also be defined as the total number of futures contracts or option contracts that have not yet been exercised (squared off), expired.
The primary application of the role of open interest is in futures market. OI, or the total number of open contracts on a security, is often used to confirm trends and trend reversals for futures and options contracts. OI measures the flow of money into the futures market. For each seller of a futures contract there must be a buyer of that contract.
Thus a seller and a buyer combine to create only one contract. Therefore, to determine the total open interest for any given market we need only to know the totals from one side or the other, buyers or sellers, not the sum of both.
The open interest position that is reported each day represents the increase or decrease in the number of contracts for that day, and it is shown as a positive or negative number.
How does Open Interest work?
Each trade completed on the exchange has an impact upon the level of open interest for that day.
For example, if both parties to the trade are initiating a new position (one new buyer and one new seller), open interest will increase by one contract. If both traders are closing an existing or old position (one old buyer and one old seller) open interest will decline by one contract.
Open Interest as an indicator
There are four main interpretations of OI:
- If price increases and open interest increases, then participants are having more of long positions.
- If price decreases and open interest increases, then participants are having more of short positions.
- If price increases and open interest decreases, then Participants are short covering their contracts.
- If price decreases and open interest decreases, then participants are long covering their contracts.
ALSO READ : How Open Interest Analysis helps to identify market trends?
Key takeaways
- Open interest is the total number of outstanding derivative contracts, such as options or futures that have not been settled.
- Open interest equals the total number of bought or sold contracts, not the total of both added together.
- Open interest is commonly associated with the futures and options markets.
- Increasing open interest represents new or additional money coming into the market while decreasing open interest indicates money flowing out of the market.
Types of Futures
StockEdge provides you with the open interest data of two types of future contract available for trading. They are:
a) Stock futures
They are contracts between 2 investors. The buyer promises to pay a specified price for say 500 shares of a single stock at a predetermined future point. The seller promises to deliver the stock at a specified price on the specified future date.
b) Index futures
The underlying asset is the stock index. Stock index futures are more useful when one is speculating on the general direction of the market rather than the direction of an individual stock. It can be used for hedging a portfolio of shares.
Types of Participants:
- Clients: Clients are the retail individual investors who invest in the derivatives instruments. Clients are the account holders in various brokerage firms who in turn trade in derivatives market in futures and options.
- DII : Domestic Individual Investors are the local institutional investors who trade in the derivatives market in futures and options instruments . DIIs trade in this market mostly for hedging and speculating targets. Mutual Fund Houses, Pension Funds, Banks, Insurance Companies, are some examples of the most common DIIs present in the market.
- FIIs: Foreign Institutional Investors are the international institutional investors who are willing to invest in the Indian Market being locals of different countries. FIIs are the most important participant and plays a vital role in determining the market trend and volatility of the market. FIIs determine the trends in the prevailing market and are responsible for the liquidity and sustainability in the market and economy. FII/DII Data is an important indictor.
- Pro : Pro are the proprietors and brokerage firms who trade on their own behalf.
Analysis of Open Interest in StockEdge App:
StockEdge is here to provide you with a very new premium feature i.e. Analysis of Participant Wise Open Interest.
This feature is located in the Daily Updates Section with the tab named as Future OI coming right after FII/DII tab divided the analysis of Open Interest data in three sub sections: Gross OI, Net OI and Participant tab.
Lets discuss in details how these three tabs will help users and investors in analyzing open interest data in the most efficient and profitable way.
Gross OI
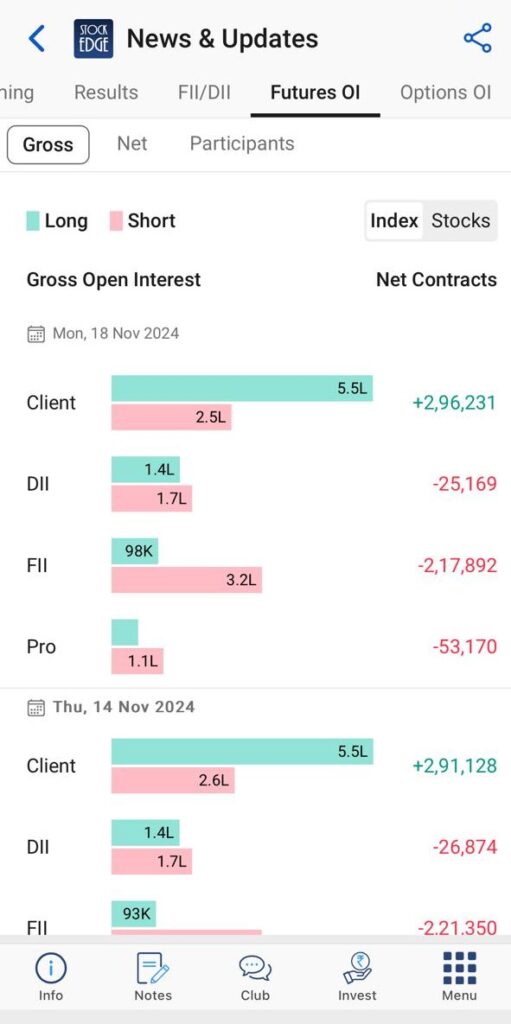
In this tab the gross long and short positions initiated by the four participants are provided in terms of number of contracts along with the net value of contracts. This data of open interest is provided in a bar graphical presentation of 2 bars for each participant where one bar denotes the number of long contracts in a green color and the other denotes the number of short contracts in a red color.

You will see the graphical display of gross open interest for each respective date which will help you to have a detailed view of the trend on the current respective date and analyze the trend for the following day. This tab is useful for investors who like to analyze this data on a daily basis and initiate their calls accordingly.
NET OI
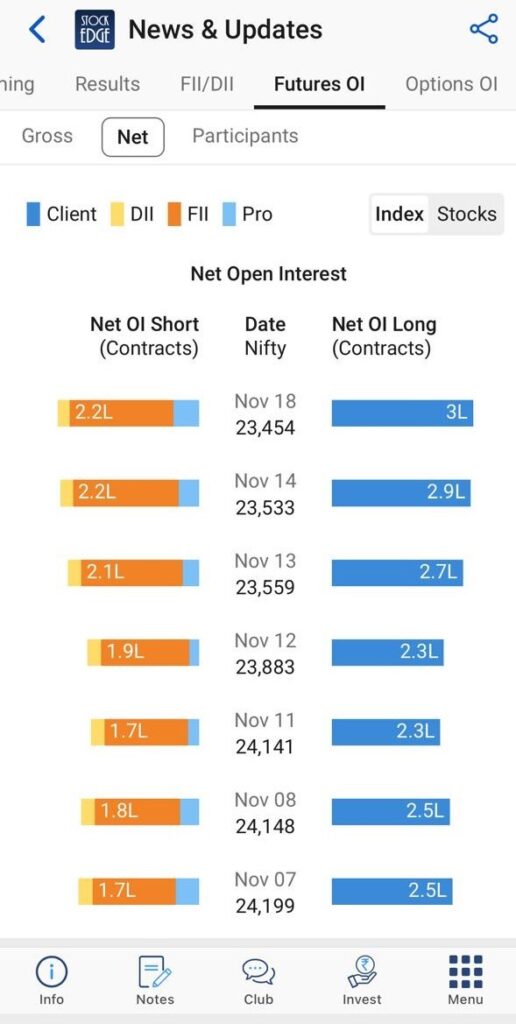
In this tab, net values of open interest contracts is displayed in a colorful single bar where the right bar denotes the participants with net long positions and the left bar denotes the participants with net short positions for the respective date. In between of both the bars, You will find the NIFTY 50 closing value for the respective date.

This tab is very useful for analyzing the participants driving the market and its impact on NIFTY 50 value. This tab is very useful for those investors who would like to have a overview of market trends driven by key participants and would like to analyze this data for prior periods as well as it shows the change in net values for each participant on a day to day basis.
See also: Interest Coverage Ratio
Participants Tab
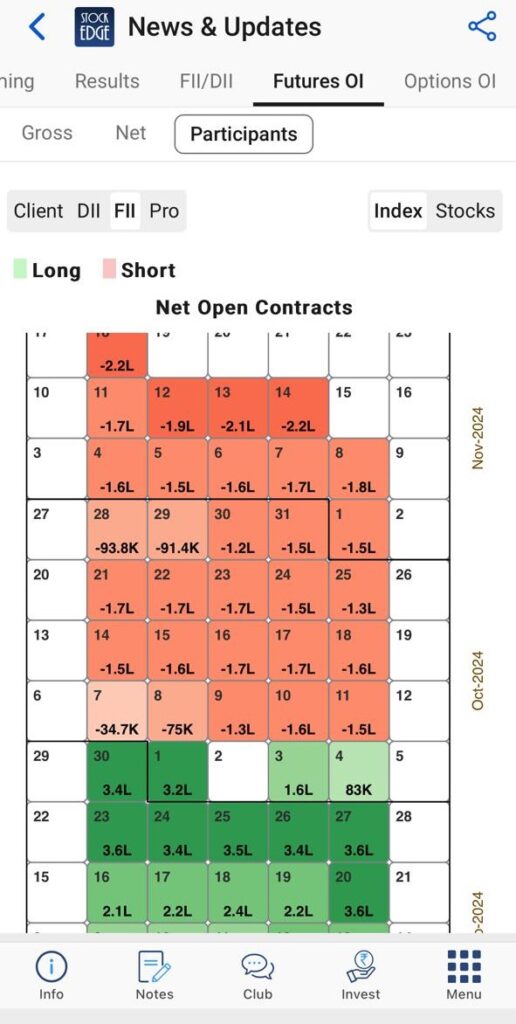
This tab represents the data for each participant in a calendar heat map format wherein each participant has a different calendar heat map in their respective section. Calendar heat map for each participant is plotted on the basis of net positions of contracts initiated by each respective participant wherein different shades of green and red color are being used for determining the intensity of net long and net short positions respectively.

This tab is very useful for those investors who would like to analyze the open interest on the basis of participant wherein a detailed analysis of the trend can be interpreted for a particular participant over a period of 4 months.
For instance, having a look at the above picture tell us that the FIIs most of the times have net long positions. By Clicking on any calendar date cell will open up a pop up box containing all the information of long and short contracts and the value of the net contracts for that date.
Above are details and features of Participant Wise Open Interest that helps you to do a detailed and core depth analysis of open interest and respective market trends related to the respective business houses that will further help in initiating a profitable trade.
Check out our Premium plans from here.


Perfect way to understand net position of all participants is by understanding Derivatives data and it’s movement against cash market report. This could be the Early indication of the trend market is likely to follow for next few expiry.