Table of Contents
Jensen’s Alpha was developed by Michael Jensen in the year 1968 as a metric to track the performance of mutual fund managers on a risk-adjusted basis. The model of Jensen’s Alpha or the metric developed by Jensen helps in measuring the fund manager’s performance versus the returns that could have been expected from a market-related investment, after adjusting for the fund’s correlation to the market.
Jensen’s Ratio Calculation
Jensen’s alpha equation is computed as follows:-
α = Expected return from the investment – RF + β (MR – RF)
Where:
RF = the risk-free rate of return (represented by ‘safe’ investments like treasury bills, Government Bonds)
β = the beta of the investment (or volatility relative to market volatility)
MR = expected return from the market
Jensen’s alpha adjusts the return metric of the fund to account for the fund’s volatility i.e. beta-exposure risk. Beta indicates how closely an investment follows the upward and downward movements of financial markets. A beta of more than 1 signifies that a stock or fund is more volatile than the market, which brings greater levels of risk and which implies greater losses (or gains), especially in times of severe market events.
Let’s consider an example:-
- A portfolio has realized a return of 15%. The approximate market index returned 12%. The beta of the fund versus the same index is 1.2 and the risk-free rate is 6%.
- Jensen’s Alpha = 15 – [ 6 + 1.2 * (12 – 6 ) ] = 1.8%
- Beta of the fund with 1.2 is expected to be riskier than the market index. A positive alpha indicates that the portfolio manager earned handsome return to be compensated for the additional risk taken over the invested period.
- According to Jensen’s Alpha If the fund delivered a return of 12%, the alpha computed would be -1.2%. A negative alpha indicates that the investor was not earning enough returns for the quantum of risk which was borne by him/ her. An alpha of zero would then indicate that the portfolio or fund is tracking perfectly with the benchmark index.
Risk-reward tradeoff
A positive Jensen’s alpha implies that the fund manager’s stock selection skill has delivered superior risk-adjusted returns. When comparing two funds with similar beta ratios, you should prefer the one with the higher alpha since it implies greater reward at the same level of risk taken by you.
When return performance is measured, Jensen’s alpha measure considers an investment’s risk profile into account and so gives an overall picture of a portfolio or stock’s performance on a risk-adjusted basis.
For example, if two funds deliver a similar return, you would likely opt for the more stable, less-risky option since that fund outperforms when including risk as a performance measure.
The excess return, also known as alpha, is a measure of a fund’s under or outperformance relative to the benchmark against which it is compared.
NIFTY and SENSEX are the common benchmarks, which are used to reflect the performance of markets, in India.
When the risk-adjusted returns of an asset are evaluated, investors usually use alpha in conjunction with beta. Alpha measures the excess return of a fund while beta reflects how volatile the fund is relative to the market. While security with a high beta implies healthy gains in times of upside volatility, it also suggests heavy losses during severe market events such as demonetization.
See also: How to use Sharpe Ratio to analyze mutual funds?
Why is Jensen’s alpha important?
According to Jensen’s Alpha, from an investor’s perspective, it is important to understand the risks you would be taking when you invest in a particular asset. For this, you need a properly calculated measure of the total return of an investment against the risk involved in it. The objective of investors is to go for investments that offer maximum returns with minimal risks which means that between two mutual fund schemes that are offering similar returns, the one with less risk would be more attractive to the investors than the one with higher risk.
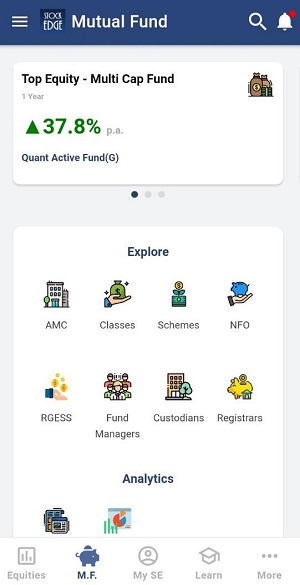
This important Jensen’s Alpha ratio can be easily tracked with the StockEdge application or its web version at your fingertips. All you need to do is download the application, click on the Mutual Funds tab, and explore. Steps to be followed:
- Click on the M.F tab on the home screen of the application.
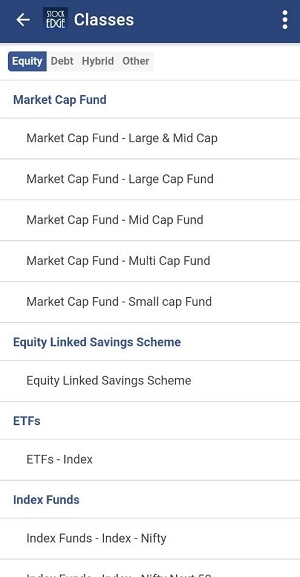
- Click on Classes and select the type (Equity, Debt, Hybrid, Others). For e.g.:- You select Equity and select “Market Cap Fund – Large & Mid Cap”.
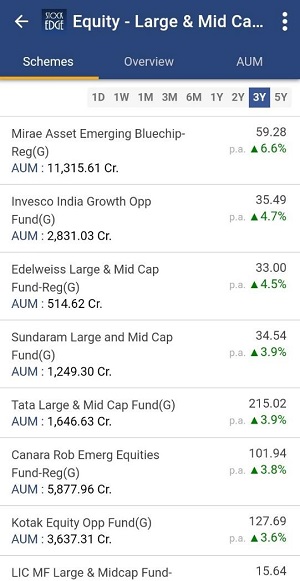
- You can select the different schemes and can compare their Jensen’s Alpha Ratio like in the picture depicted below:-
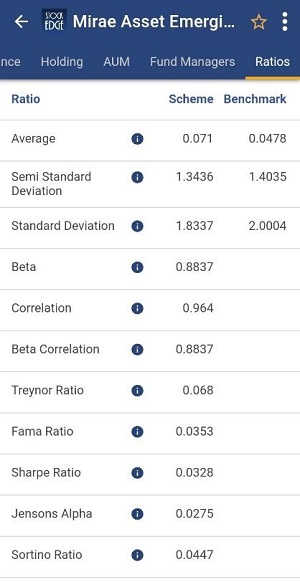
- Select the first fund and scroll towards the right to check the ratios section. Now you can compare the ratios with other funds and schemes and use this information along with other parameters. Also, you can check the holdings of the fund by clicking on the section.
Conclusion
So StockEdge is the only platform where you get filtered information, which helps in making your analysis faster, better, and easier within minutes. So what are you waiting for start using Stock and Mutual Fund Analytics today and become a profitable and smart trader cum investor? These are part of the premium offerings of the StockEdge app.
Join StockEdge Club to get more such Stock Insights.
You can check out the desktop version of StockEdge.


