StockEdge.com
  • Products
    • StockEdge Premium
    • StockEdge Pro
    • StockEdge Club
    • Compare Plans
StockEdge Blog
  • Trending Stocks
  • Insights
    • All
    • Business Houses
    • Markets themes
    • Stock Insights
    Top 5 Textile stocks

    Top 5 Textile Stocks in India: From Cotton to Cash

    multi-bagger stocks for 2025

    5 Multibagger Stocks to keep an eagle-eye for 2025

    Jindal Saw – Strong Earnings Momentum Ahead

    Jindal Saw – Strong Earnings Momentum Ahead

    Kirloskar Group- A Legacy of 134 Years

    Kirloskar Group- A Legacy of 134 Years

    renewable energy stocks in india

    Top Renewable Energy Stocks in India

    blue chip stocks

    Top 5 Blue Chip Stocks to Buy and Invest in 2023

    Budget 2023: Stocks to keep an eye on

    Budget 2023: Stocks to keep an eye on

    Adani Enterprises FPO: Detailed Analysis, GMP and Review?

    Adani Enterprises FPO: Detailed Analysis, GMP and Review?

    Top 5 Defence Stocks to Invest in India

    Top 5 Defence Stocks to Invest in India

  • Technical Analysis
    Chart Patterns – Holy grail of Stock Market Analysis

    Chart Patterns – Holy grail of Stock Market Analysis

    StockEdge Version Update : 9.0

    StockEdge Version Update : 9.0

    Beat the street with Sector Rotation Strategy

    Beat the street with Sector Rotation Strategy

    StockEdge Version Update 8.2

    StockEdge Version Update 8.2

    Derivative Analytics

    An Insightful Research Tool For Derivative Analytics

    Introducing Put-Call Ratio a Derivative Indicator in the Market

    Introducing Put-Call Ratio a Derivative Indicator in the Market

    A Powerful Technical Indicator Beta & Beta Scans

    A Powerful Technical Indicator Beta & Beta Scans

    Technical Analysis using Edge Charts

    Technical Analysis using Edge Charts

    adaptive relative strength and static relative strength scans

    What is Adaptive Relative Strength & Static Relative Strength Scans?

  • Fundamental Analysis
    • All
    • Cash Flow Ratios
    • Efficiency ratios
    • Growth Ratios
    • Liquidity Ratios
    • Return Ratios
    • Solvency ratios
    • Valuation Ratios
    high dividend paying stocks

    Identifying High Dividend Paying Stocks

    Understanding the Importance of creating Fundamental Scans

    Understanding the Importance of creating Fundamental Scans

    Using My Combination Scan to Identify best in an Industry

    Using My Combination Scan to Identify best in an Industry

    Cost Income ratio

    Cost to Income Ratio(%)

    Cost of Liability

    Cost of Liabilities (%)

    Operating Cost to Assets Ratio (%)

    Operating Cost to Assets Ratio (%)

  • StockEdge Tutorials
    StockEdge Club: An Exclusive Investors Hub & Analytics platform

    StockEdge Club: An Exclusive Investors Hub & Analytics platform

    FII/DII Data: Leading Indicators of Stock Market

    FII/DII Data: Leading Indicators of Stock Market

    Chart Patterns – Holy grail of Stock Market Analysis

    Chart Patterns – Holy grail of Stock Market Analysis

    StockEdge Version Update : 9.0

    StockEdge Version Update : 9.0

    Powerful Investment Themes for Retail Investors

    Powerful Investment Themes for Retail Investors

    Beat the street with Sector Rotation Strategy

    Beat the street with Sector Rotation Strategy

    StockEdge Version Update 8.3

    StockEdge Version Update 8.3

    StockEdge Version Update 8.2

    StockEdge Version Update 8.2

    Using Investor Portfolios Section to track Big Bulls like Rakesh Jhunjhunwala

    Using Investor Portfolios Section to track Big Bulls like Rakesh Jhunjhunwala

  • Mutual Fund
    Top 5 Mutual Funds for 2022 where you can start your SIP

    Top 5 Mutual Funds for 2022 where you can start your SIP

    What are Value Funds and its Advantages?

    What are Value Funds and its Advantages?

    thematic funds

    Thematic Funds : Everything you need to know

    Understanding Sector Funds and their Benefits to our Portfolio

    Understanding Sector Funds and their Benefits to our Portfolio

    Are Dividend Yield Funds a good option to invest in?

    Are Dividend Yield Funds a good option to invest in?

    What are Contra Funds and their advantages?

    What are Contra Funds and their advantages?

    Trending Tags

    No Result
    View All Result
    • Trending Stocks
    • Insights
      • All
      • Business Houses
      • Markets themes
      • Stock Insights
      Top 5 Textile stocks

      Top 5 Textile Stocks in India: From Cotton to Cash

      multi-bagger stocks for 2025

      5 Multibagger Stocks to keep an eagle-eye for 2025

      Jindal Saw – Strong Earnings Momentum Ahead

      Jindal Saw – Strong Earnings Momentum Ahead

      Kirloskar Group- A Legacy of 134 Years

      Kirloskar Group- A Legacy of 134 Years

      renewable energy stocks in india

      Top Renewable Energy Stocks in India

      blue chip stocks

      Top 5 Blue Chip Stocks to Buy and Invest in 2023

      Budget 2023: Stocks to keep an eye on

      Budget 2023: Stocks to keep an eye on

      Adani Enterprises FPO: Detailed Analysis, GMP and Review?

      Adani Enterprises FPO: Detailed Analysis, GMP and Review?

      Top 5 Defence Stocks to Invest in India

      Top 5 Defence Stocks to Invest in India

    • Technical Analysis
      Chart Patterns – Holy grail of Stock Market Analysis

      Chart Patterns – Holy grail of Stock Market Analysis

      StockEdge Version Update : 9.0

      StockEdge Version Update : 9.0

      Beat the street with Sector Rotation Strategy

      Beat the street with Sector Rotation Strategy

      StockEdge Version Update 8.2

      StockEdge Version Update 8.2

      Derivative Analytics

      An Insightful Research Tool For Derivative Analytics

      Introducing Put-Call Ratio a Derivative Indicator in the Market

      Introducing Put-Call Ratio a Derivative Indicator in the Market

      A Powerful Technical Indicator Beta & Beta Scans

      A Powerful Technical Indicator Beta & Beta Scans

      Technical Analysis using Edge Charts

      Technical Analysis using Edge Charts

      adaptive relative strength and static relative strength scans

      What is Adaptive Relative Strength & Static Relative Strength Scans?

    • Fundamental Analysis
      • All
      • Cash Flow Ratios
      • Efficiency ratios
      • Growth Ratios
      • Liquidity Ratios
      • Return Ratios
      • Solvency ratios
      • Valuation Ratios
      high dividend paying stocks

      Identifying High Dividend Paying Stocks

      Understanding the Importance of creating Fundamental Scans

      Understanding the Importance of creating Fundamental Scans

      Using My Combination Scan to Identify best in an Industry

      Using My Combination Scan to Identify best in an Industry

      Cost Income ratio

      Cost to Income Ratio(%)

      Cost of Liability

      Cost of Liabilities (%)

      Operating Cost to Assets Ratio (%)

      Operating Cost to Assets Ratio (%)

    • StockEdge Tutorials
      StockEdge Club: An Exclusive Investors Hub & Analytics platform

      StockEdge Club: An Exclusive Investors Hub & Analytics platform

      FII/DII Data: Leading Indicators of Stock Market

      FII/DII Data: Leading Indicators of Stock Market

      Chart Patterns – Holy grail of Stock Market Analysis

      Chart Patterns – Holy grail of Stock Market Analysis

      StockEdge Version Update : 9.0

      StockEdge Version Update : 9.0

      Powerful Investment Themes for Retail Investors

      Powerful Investment Themes for Retail Investors

      Beat the street with Sector Rotation Strategy

      Beat the street with Sector Rotation Strategy

      StockEdge Version Update 8.3

      StockEdge Version Update 8.3

      StockEdge Version Update 8.2

      StockEdge Version Update 8.2

      Using Investor Portfolios Section to track Big Bulls like Rakesh Jhunjhunwala

      Using Investor Portfolios Section to track Big Bulls like Rakesh Jhunjhunwala

    • Mutual Fund
      Top 5 Mutual Funds for 2022 where you can start your SIP

      Top 5 Mutual Funds for 2022 where you can start your SIP

      What are Value Funds and its Advantages?

      What are Value Funds and its Advantages?

      thematic funds

      Thematic Funds : Everything you need to know

      Understanding Sector Funds and their Benefits to our Portfolio

      Understanding Sector Funds and their Benefits to our Portfolio

      Are Dividend Yield Funds a good option to invest in?

      Are Dividend Yield Funds a good option to invest in?

      What are Contra Funds and their advantages?

      What are Contra Funds and their advantages?

      Trending Tags

      No Result
      View All Result
      StockEdge Blog
      Home Tutorials
      Interest Income to Total Funds (%): Importance, Formula & Impact

      Interest Income to Total Funds (%): Importance, Formula & Impact

      StockEdge by StockEdge
      December 13, 2018
      Reading Time: 4 mins read
      2.9k
      VIEWS
      Share on FacebookShare on TwitterShare On WhatsApp

      Table of Contents

      • Importance
      • Impact
      • Formula
      • Explanation
          • See also: CASA Ratio (%): Definition, Importance & Formula
      • Stockedge App
      • Bottomline

      Nowadays with banking crisis news doing rounds, we would want to invest with a safe bank, Right !!! What if we get to know of the earnings percentage of the total deposits in a bank. Thus if it’s higher than our savings, it is safe, as the bank is able to mobilize its savings wisely and efficiently.

      Net Interest Income is the difference between the interest earned from bank’s assets to the interest expenses on the bank’s deposits. A typical bank’s asset consists of all forms of personal and commercial loans, mortgages and securities. The liabilities are the customer deposits. The excess revenue that is generated from the interest earned on assets over the interest paid out on the deposits is the net interest income. Interest income to total funds ratio indicates how much interest is earned with respect to total deposits.

      Watch the video below on Everything you want to know about Interest Income To Total Funds:

      Importance

      The net interest income is very sensitive to changes in interest rates prevailing. The other factors also which affects the net interest income are the type of assets and liabilities that are held as well as if those assets and liabilities have fixed rates or variable rates. Variable rates assets and liabilities will more affect the net interest income as they will be change with changing interest rates as compared to fixed assets and liabilities. Quality of the loan portfolio is also a factor affecting net interest income as circumstances like a deteriorating economy and job losses can cause borrowers to miss payments on their loans and lower the bank’s net interest income as a result.

      Impact

      By calculating this ratio, we can get an idea of how much interest the bank is earning and compare it with respect to the total funds i.e. deposits. If the ratio is higher, it is a good sign for a financing company. It means the bank is using its funds efficiently to earn interest. And if the total funds increase, the interest should also increase proportionately and if it doesn’t then there can be an efficiency issue.

      Formula

      Interest Income to Total Funds (%) = Net interest Income/Total Deposits

      Explanation

      Suppose a bank ABC has net interest-earning of Rs. 1,00,000 and its total deposits are Rs. 10,00,000. Then,

      Interest Income to Total Funds (%) = (100000/1000000)*100 = 10%

      See also: CASA Ratio (%): Definition, Importance & Formula
      interest income

      Stockedge App

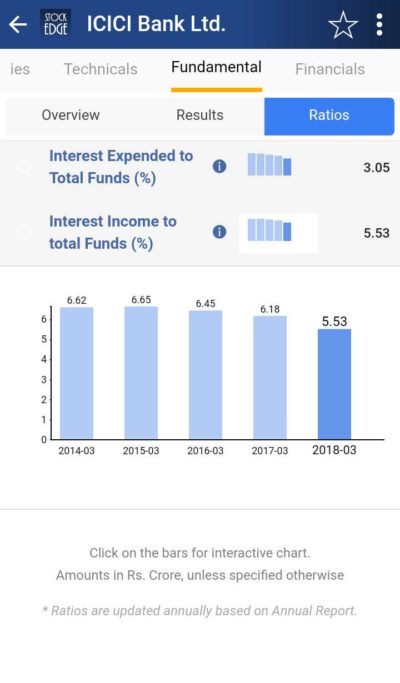
      Nowadays we don’t have to calculate Interest Income to Total Funds ratio (%) on our own. StockEdge gives us the Interest Income to Total Funds ratio of the last five years of any company listed in the stock exchange. We can look and compare Interest Income to Total Funds ratio (%) of any company and filter out stocks accordingly.

      Suppose we want to look at Interest Income to Total Funds ratio of ICICI Bank Ltd. for the last 5 years then in the Fundamental tab of ICICI Bank Ltd., click on the fundamentals tab, we will get Ratios tab.  Then in the Ratios tab click on the Liquidity Ratios, we will get Interest Income to Total Funds ratio (%) of ICICI Bank Ltd.

      Bottomline

      Interest Income to Total Funds (%) of any bank tells us about the efficiency of funds usage. It can be compared on a yearly basis and with other banks to understand the efficiency of the banks. With a click of a button, you can see the comparison of the bank’sInterest Income to Total Funds ratio (%) for five years. Haven’t subscribed to stockedge yet? So what are you waiting for, subscribe immediately to use this free feature. We also have paid featured scans based on Valuations, with the help of these ready-made scans you can with a click of a button filter out good companies. These scans are part of the premium offerings of the StockEdge app.

      Click here to know more about the Premium offering of StockEdge.

      You can check out the desktop version of StockEdge using this link.

      Tags: Efficiency Scanfinancial leverageFinancial ratiosfinancial statementsFundamental analysisfundamental parameterLiquidity ratiosSolvencystock financialsStockEdgeStockEdge Scan
      ShareTweetSend
      Subscribe On Telegram Subscribe On Telegram Subscribe On Telegram
      Previous Post

      Working Capital Cycle

      Next Post

      CASA Ratio(%): Definition, Formula & Importance

      StockEdge

      StockEdge

      StockEdge is a self-help Equity and Mutual Fund research tool. It empowers retail investors to identify investment opportunity with all the necessary data and analytics.

      Next Post
      CASA

      CASA Ratio(%): Definition, Formula & Importance

      Interest Expended to total funds

      Interest Expended to Total Funds (%)

      Paid Features

      Features of Stockedge Premium Version!

      Leave a Reply Cancel reply

      Your email address will not be published. Required fields are marked *

      Contact Us
      • Timing (Mon-Sat): 10 am to 7 pm
      • Sales: +919830994463
      • Support: +919830994402
      • Club Support: +916289906895
      • Affiliate: +917003567131
      Recent Posts
      Top 5 Textile stocks
      Top 5 Textile Stocks in India: From Cotton to Cash
      multi-bagger stocks for 2025
      5 Multibagger Stocks to keep an eagle-eye for 2025
      Important Links
      • StockEdge.com
      • StockEdge Premium
      • - Quarterly Membership
      • - Annual Membership
      • StockEdge Analyst
      • StockEdge Club
      • Compare Plans
      An Initiative Of

      © 2023 Kredent InfoEdge Pvt Ltd.

      Facebook-f Twitter Instagram Linkedin-in Youtube Pinterest-p

      Get StockEdge App

      No Result
      View All Result
      • Home
      • Article Categories
        • Fundamental Analysis
        • Technical Analysis
        • Market Themes
        • StockEdge Tutorials
        • StockEdge Version Updates
      • Products
        • StockEdge Premium
        • StockEdge Pro
        • StockEdge Club
        • Compare Plans
      • Visit StockEdge.com

      © 2023 Kredent InfoEdge Pvt Ltd.