Table of Contents
Infosys Ltd. A large-cap IT stock, which we all are familiar with, made its debut listing in the stock market in 1993. It has been a wealth creator for many stock market participants. Currently, Infosys stock is one of the top heavyweights in the CNX Nifty IT index.
The IT index, which has been sluggish for more than one year, has just started to gain back its bullish momentum. The Nifty IT Index comprises 10 stocks from the IT sector, and Infosys stock has the highest weight at 26.77%. Here is a glimpse of the different weightage of the overall NIFTY IT index:
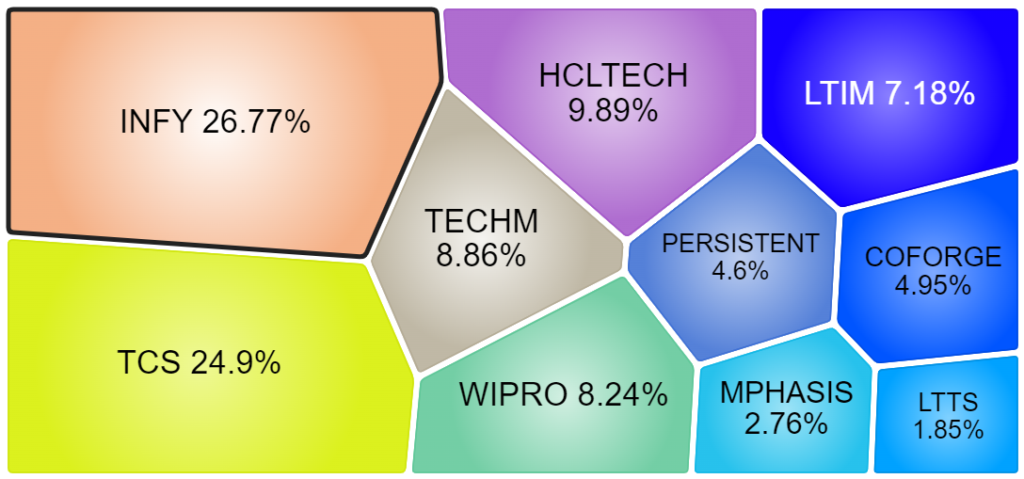
Source: NSE India
As you can see in the above image, NSE: INFY holds the highest weightage in the NIFTY IT Index and with the overall index starting to outperform, the most beneficial could be Infosys.
In today’s blog, we will discover the investment opportunity in Infosys stock. Let’s start with Infosys stock analysis.
Infosys Ltd. Company Overview
Established in 1981, Infosys Limited has grown to become a prominent player in the global IT services landscape. Headquartered in India, the company operates in over 56 countries, offering a wide range of consulting, technology, outsourcing, and digital services.
As the second-largest listed IT services company in India, Infosys generates revenue through various IT services, including software development, maintenance, consulting, package implementation, and software product licensing. These services are classified into two categories: Core Services and Digital Services.
Core Services encompass application management, proprietary application development, independent validation, product engineering, infrastructure management, enterprise application implementation, and support and integration services.
On the digital front, Infosys excels in services that enhance customer experience, utilize AI and analytics, develop digital products and IoT solutions, modernize legacy technology systems, migrate to cloud applications, and implement advanced cybersecurity measures.
Here is an overview of the revenue mix of Infosys for FY23:
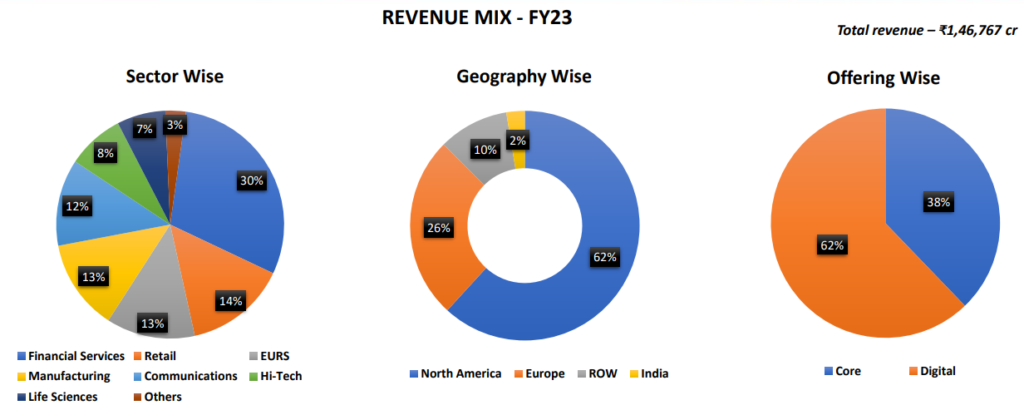
Recently, on May 23, 2023, Infosys launched Topaz, an integrated AI and Generative AI platform featuring over 150 pre-trained models. This initiative reflects the company’s commitment to advancing next-generation digitization for enterprises.
Sector Outlook – IT Industry
The outlook for India’s IT industry is robust, with a projected 10%-12% CAGR over the next 5 years, reaching revenues between $300 billion and $350 billion. According to NASSCOM, the digital segment is poised to contribute significantly, comprising 55%-60% of total technology services revenue by 2025, with an annual growth rate of 25%-30%.
As global enterprises increase their tech spending from 3% to 5% of revenue by 2030, India remains the top off-shoring destination, offering cost competitiveness that is 3-4 times more attractive than the US. Cloud technology, cybersecurity, AI, automation, data analytics, IoT, and robotics are driving the industry’s future tech stack, with a notable shift of 51% of IT spending towards the public cloud by FY26. The sector, in its third wave of AI evolution, is witnessing a surge in demand for digitization and consulting services, with exponential growth expected in 5G, AI, robotics, and blockchain.
Overall, India’s IT industry is poised for sustained growth, fueled by global digital transformation initiatives and a focus on emerging technologies.
Infosys is indeed a part of the Nifty 50 index.
Financial Highlights
Analyzing financial statements such as income statements, balance sheets, and cash flow statements helps investors assess the company’s ability to generate returns, manage debt, and sustain growth, enabling informed and prudent investment choices.
Income statement of Infosys Ltd.
The income statement, commonly known as the profit and loss statement, gives you an understanding of its financial performance, such as its sales growth, profitability, etc.
At StockEdge, we have organized the income statement in a way that will help you analyze it with ease rather than going through the conventional way of downloading the documents from the stock exchanges, which could be time-consuming and tiresome to many.
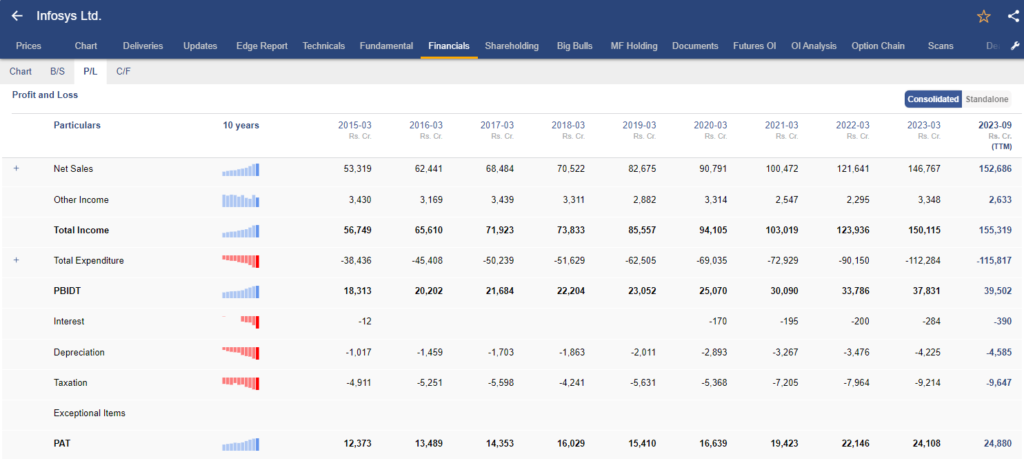
In the above image, you can see the annual income statement of Infosys Ltd. Every detail is in front of your eyes, starting from the top-line sales figures to the bottom-line Net profit of the company.
Sales Growth
In FY 2023, the revenue reached ₹1,46,767 crore, reflecting a substantial 20.6% year-on-year increase. This growth was evident across various sectors, with Manufacturing and Energy experiencing growth rates of 27% and 17%, respectively. Geographically, Europe saw a significant uptick of 20%, while America’s growth was at 6%. The overall revenue expansion was diverse across sectors, with Manufacturing and Life Science showing impressive year-on-year increases of 24% and 23%, respectively. However, softer demand was observed in financial services, telecom, and hi-tech, which were attributed to reduced volumes associated with slower discretionary spending.
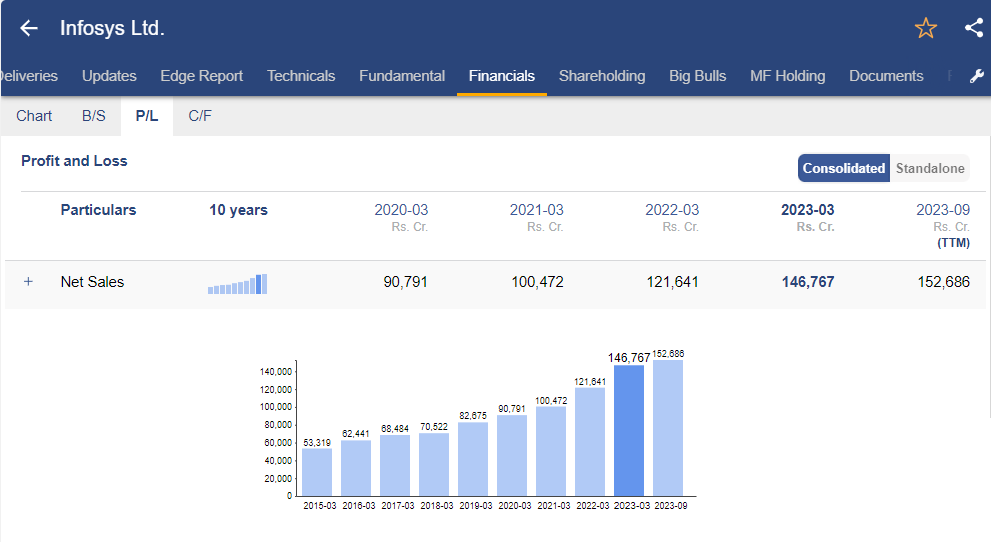
In the first half of FY24, revenue stood at ₹76 ,927 cr, up by 8. 3 % YoY.
EBITDA Growth
During FY 2023, the EBITDA reached ₹35,130 crore, marking an approximately 11.6% year-on-year growth, driven by increased revenue. Employee cost and subcontractor cost accounted for around 62.9% of the revenue, experiencing a rise of approximately 20.7% year-on-year in FY23. Although, in the first half of FY24, the EBITDA demonstrated a growth of about 10% year-on-year, totaling ₹18,504 crore. This increase was attributed to both higher revenue and reduced expenses.
PAT Growth
In FY 2023, the Profit After Tax amounted to ₹24,108 crore, compared to ₹22,146 crore in FY22. For the first half of FY24, the PAT reached ₹12,160 crore, up from ₹11,388 crore in H1 FY23. On a year-on-year basis, finance costs and depreciation expenses during H1 FY24 increased by 88% and 18%, respectively. Despite the uptick in expenses, the PAT experienced growth, driven by increased revenue flow-through.
Balance Sheet of Infosys Ltd.
The balance sheet follows the accounting equation: Assets = Liabilities + Equity. It provides a company’s financial position, stability, and overall health.
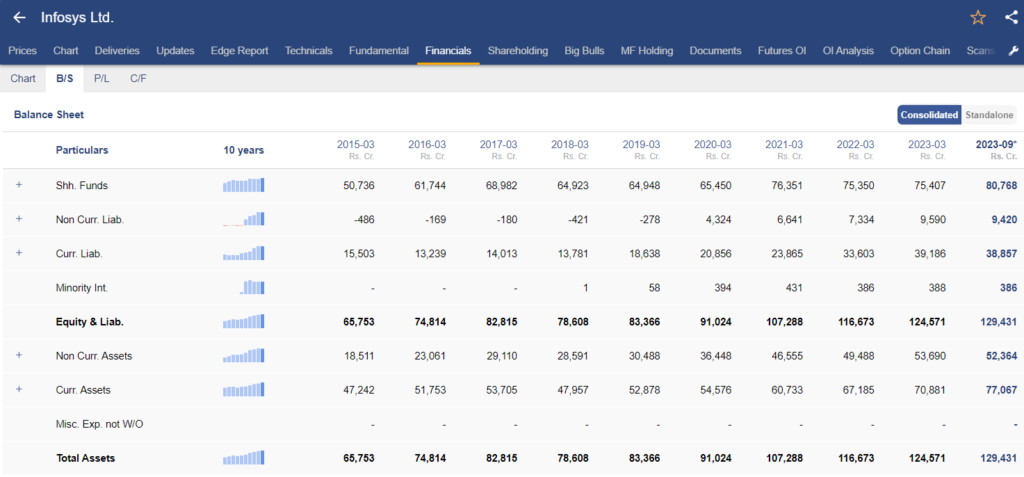
In the above image, you can see the balance sheet of Infosys Ltd. It provides an overview of the financial position as on date. What are the assets and liabilities of the company? Liabilities of a company can be both short term and long term.
The company doesn’t have debt on its balance sheet; it has no long-term liability, making it a debt-free company.
Debt-free companies are considered advantageous as they enjoy financial flexibility without interest obligations, allowing them to reinvest profits, pursue strategic opportunities, and navigate economic downturns more resiliently.
Cash Flow statement of Infosys Ltd.
A cash flow statement provides a summary of how a company generates and uses cash over a specific period of time. It has three different sections:
- Operating cash flow statement
- Financing cash flow statement
- Investing cash flow statement
Out of these the most important one being the cash flow from operations as it provides you with an understanding of how the company generated cash from its core business operations. A positive cash flow from operation signifies that the company has generated higher cash revenue than its expenditure.
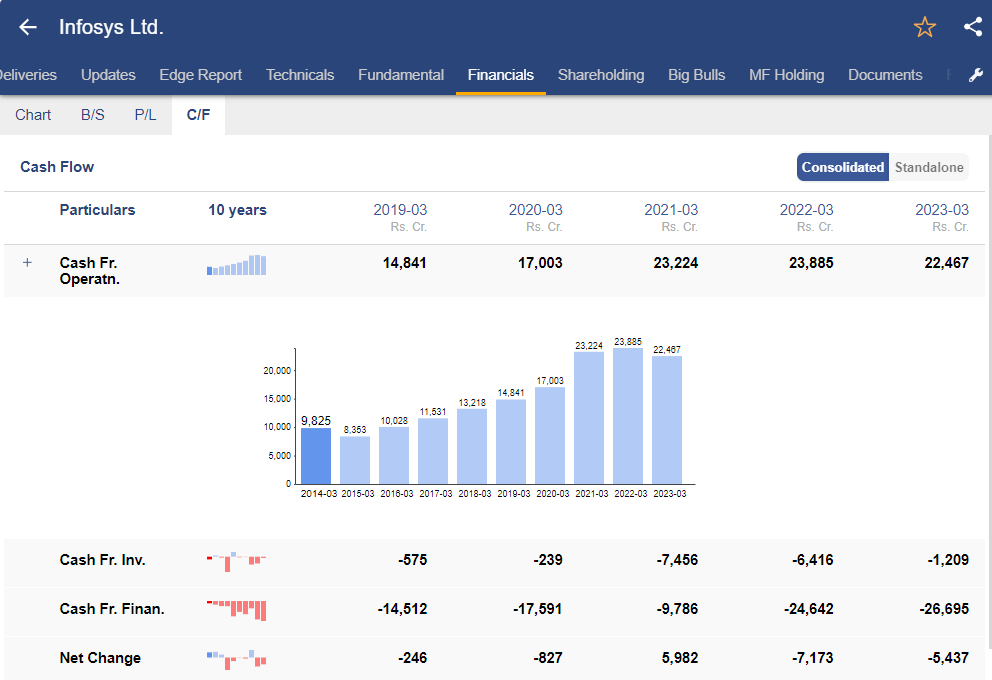
In FY 2023, operational cash flows remained consistent at ₹22,467 crore, attributed to working capital adjustments. Investment activities resulted in a net cash outflow of ₹1,209 crore, encompassing the purchase of commercial paper (₹705 crore) and expenditures on property, plant, equipment, and intangibles (₹2,579 crore). Financing activities in FY23 led to a cash outflow of ₹26,695 crore, involving dividend payments (₹13,631 crore), equity share buybacks with associated costs and taxes, and lease liability (₹915 crore).
Ratio Analysis of Infosys Ltd.
Ratio analysis of a company involves evaluating a company’s financial performance by examining certain ratios which are derived from its financial statements. It makes easy comparing the financial performance to its industry benchmarks or competitors.
Ratio has different classifications like profitability ratios, solvency ratios, return ratios and more as you can see in the image below, you can analyze all such ratios directly from StockEdge.
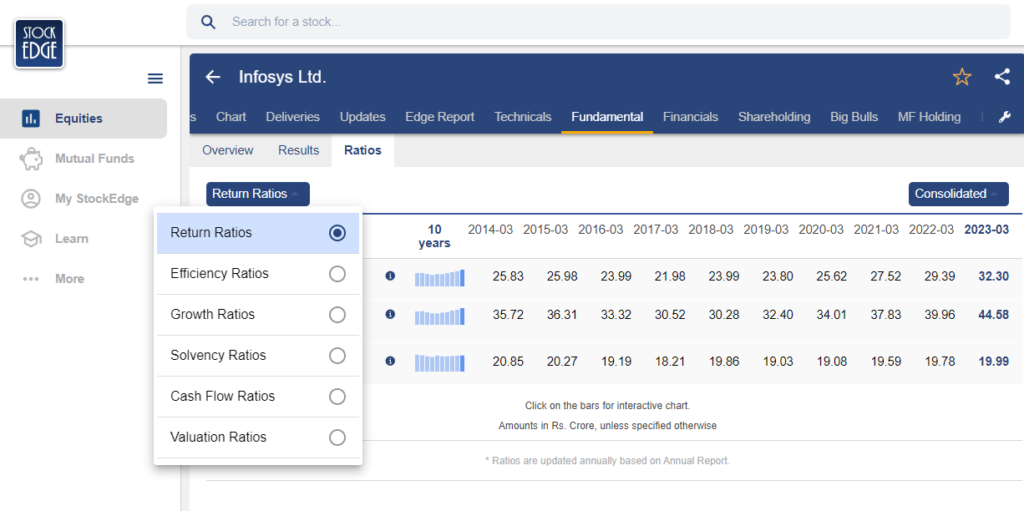
Here are the return ratios of the Infosys stock, starting with the two most important ratios which are ROE and ROCE.
What is ROE and ROCE?
ROE is a profitability ratio that measures the company’s ability to generate net income as a percentage of shareholders’ equity, whereas ROCE assesses the efficiency of a company in utilizing its total capital, including both equity and debt.
Return on Equity (ROE)
In FY 2023, the Return on Equity (ROE) reached 32.3%, driven by a rise in net profit. Notably, the average net worth has not experienced growth, primarily attributed to effective balance sheet management facilitated by shareholder distributions such as buybacks and dividends.
Return on Capital Employed (ROCE)
The company witnessed a consistent rise in its Return on Capital Employed (ROCE) over the years, primarily driven by a strong increase in Profit Before Interest and Taxes (PBIT). In FY23, the ROCE stood at a notable 44.6%.
Debt to Equity
The company has no long-term debt and hence is considered a Debt-free company. However, it has short-term borrowings in its balance sheet for which it has interest expenses. Therefore, the Current ratio is a good measure to analyze a company’s ability to compare its current assets with its current liabilities, providing an indication of its short-term liquidity and the ability to cover immediate obligations.
Current Ratio
In FY 23, the company’s current ratio stood at 1.8x. The marginal decline in the ratio can be ascribed to a relatively higher percentage increase in current liabilities compared to current assets.
Price to Equity Ratio
The P/E ratio is a valuation metric that helps you assess the relative value of a stock by comparing its market price to its earnings. Infosys is currently trading at a TTM PE multiple of 24.6x, whereas the industry TTM PE was 28.88x.
Management Quality & Shareholding Pattern
The management aims to create a sustainable and adaptable organization, aligning with clients’ needs, fostering employee growth, delivering profits for investors, and contributing to local communities. In FY23, global companies experienced a tech-driven transformation, with emerging technologies like generative AI and 5G shaping industries. Responsible practices like ESG gained prominence as businesses reimagined cost structures, enhanced resilience, and launched innovative products and services.
Coming to the shareholding pattern of Infosys stock, you can check it from the StockEdge App itself.
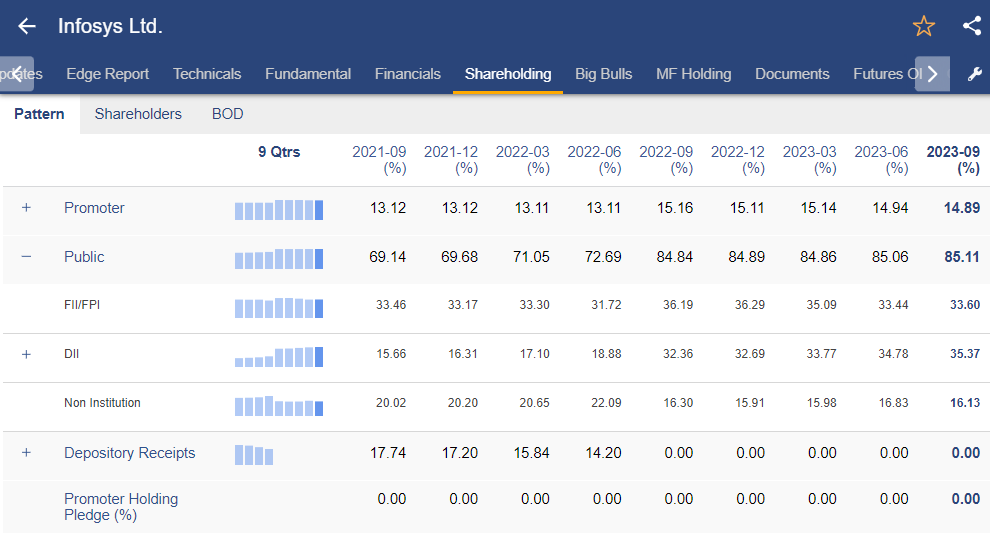
Promoters’ holding slightly decreased from 14.94% in Q1 FY24 to 14.89%. Foreign Institutional Investors (FIIs) increased their stake from 33.44% to 33.60%, while Domestic Institutional Investors (DIIs) raised their ownership from 34.78% to 35.37%.
These shifts indicate dynamic investor interest in Infosys, with FIIs and DIIs adjusting their positions. While promoter holding saw a marginal decrease, the overall changes suggest continued confidence in Infosys stock from both domestic and foreign institutional investors.
Future Outlook of Infosys
Infosys envisions becoming a globally respected corporation offering top-notch business solutions through technology and exceptional talent. Despite a slight adjustment in the FY24 revenue growth guidance to 1%-2.5%, attributed to a cautious discretionary stance, the company anticipates robust growth in FY25, driven by strong Total Contract Value (TCV) and cost efficiency measures. The focus on AI and Generative AI is evident, with 90 ongoing projects supported by the proactive use of the AI platform Topaz. A comprehensive compensation review for employees, effective from November 1, 2023, was announced, and the company expresses confidence in its margin guidance program, emphasizing employee optimization, automation, portfolio enhancement, cost efficiency, and overall operational improvements.
Case Study on Infosys Stock
We have a case study report prepared by our team of analysts. This fundamental report on Infosys provides you with a detailed analysis of the company as well as how it stands among its competitors.
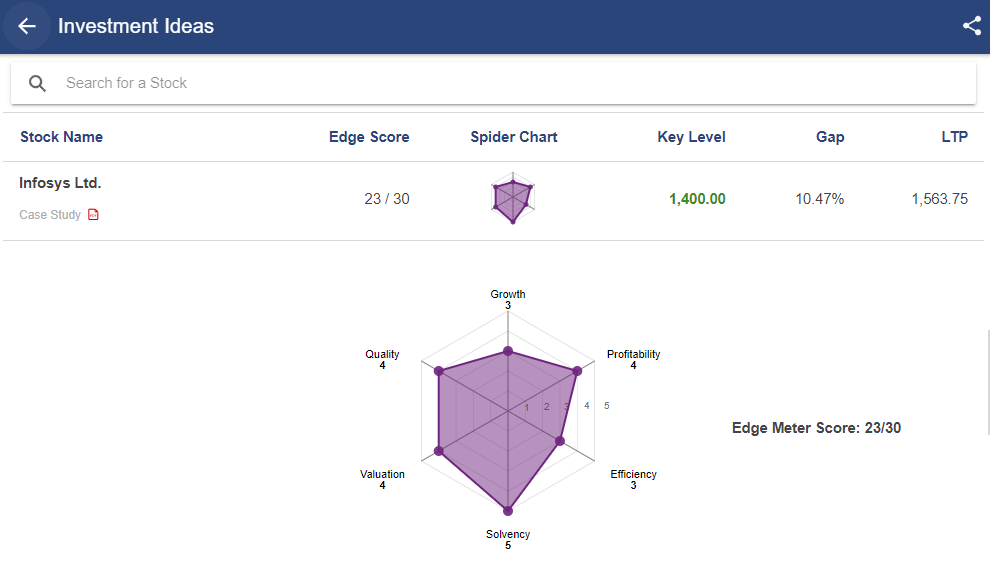
As you can see, Infosys stock has rating based on 6 parameters:
- Growth
- Quality
- Profitability
- Efficiency
- Solvency
- Valuation
Based on the above parameters, Infosys stock scored 23/30. Read the case study report here.
Conclusion
In conclusion, Infosys stands as a dynamic force in the global business landscape, fueled by its commitment to providing cutting-edge solutions and leveraging emerging technologies. Despite a nuanced approach to revenue guidance for FY24, the company maintains a positive outlook, citing a robust pipeline of large deals and a strategic focus on AI initiatives. The dedication to employee welfare demonstrated through a comprehensive compensation review, underscores Infosys’ commitment to its workforce. As the company continues to position itself as a leader in digital transformation, it remains poised for growth and innovation in the ever-evolving landscape of technology and business solutions.
Looking for more such investing opportunities in large-cap stocks of Nifty 50, you may read our previous blog on Eicher Motors Stock: Invest in the Royal Enfield Revolution
Happy Investing!


