
Table of Contents
Futures and Options Scans simplify derivatives analysis by highlighting stocks with significant changes in Open Interest and Put Call Ratio (PCR). When combined with price action and technical indicators, these stock scans help traders identify fresh long and short positions, gauge market sentiment, and make more informed trading decisions.
Have you ever looked at a stock that suddenly moved 4-5% in a day and wondered, “How did traders spot this move so early?”
The answer often lies beyond price charts.
While price tells you what’s happening, Open Interest (OI) and Put Call Ratio (PCR) reveal what traders are actually doing behind the scenes. They help you understand whether money is flowing into a stock, whether bulls are getting stronger, or if bears are tightening their grip.
The problem? Tracking F&O data for hundreds of stocks every day can be overwhelming.
That’s where StockEdge Futures and Options Scans make life easier. Instead of spending hours analysing derivatives data, StockEdge highlights the stocks where meaningful activity is happening, helping you focus only on the opportunities that matter.
Let’s see how these StockEdge scans work and how you can use them in your daily trading routine.
What are Futures and Options Scans?
Think of Futures and Options Scans as a radar for derivative activity. Rather than simply showing stocks moving up or down, these stock scans identify where traders are actively building fresh positions, closing existing ones, or changing their outlook using futures and options.
The stock scans are based on two important derivatives indicators:
- Open Interest (OI) – shows whether new futures contracts are being added or existing ones are being closed.
- Put Call Ratio (PCR) – helps gauge the overall sentiment in the options market.
Together, they give you a much clearer picture than price alone.
For example, imagine two stocks gain 2% during the day. At first glance, both look equally strong.
But if one stock sees a sharp rise in Open Interest while the other sees OI falling, the story changes completely. The first stock is attracting fresh buying interest, while the second may simply be moving up because short sellers are exiting.
That’s exactly the kind of insight these StockEdge scans are designed to provide.
Read: Options Trading
Why Should Traders Track Open Interest?
Open Interest tells you how much participation is happening in futures contracts. When OI increases, it means traders are creating new positions. When it falls, traders are closing existing positions.
Let’s take a simple example.
Suppose Bharat Dynamics is trading at ₹1,400.
On Monday:
- Price: ₹1,400
- Open Interest: 60 lakh contracts
On Tuesday:
- Price rises to ₹1,425
- Open Interest jumps to 66 lakh contracts
This isn’t just a price rise; it suggests fresh buyers are entering the futures market with confidence. That’s usually a stronger signal than a price increase alone.
Now imagine another stock rises 2%, but Open Interest falls sharply. In this case, the move could simply be due to traders covering their short positions rather than fresh buying.
That’s why experienced traders always analyse price and Open Interest together.
Different Futures and Options Scans Available in StockEdge
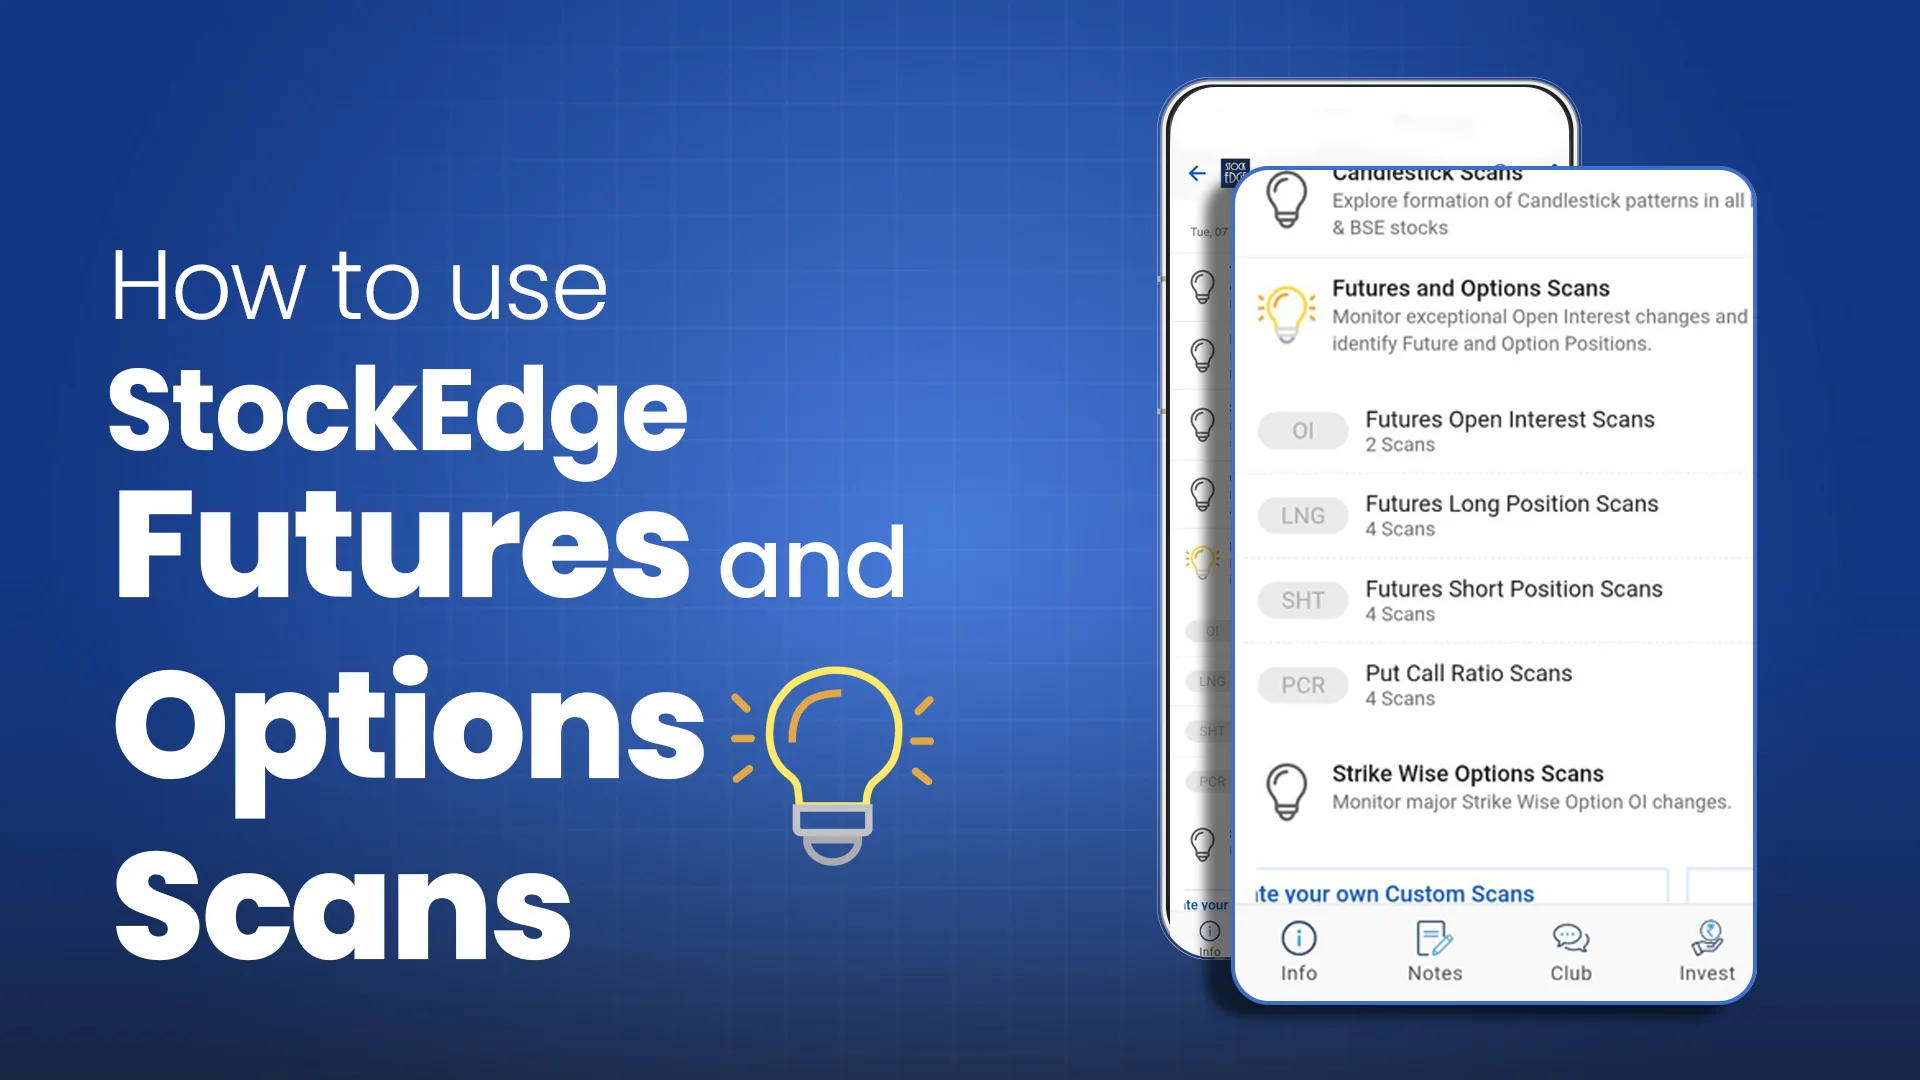
StockEdge divides derivative scans into four easy-to-understand categories, making it simple to identify the type of activity happening in the market.
1. Futures Open Interest Scans
These stock scans help you identify stocks witnessing a significant change in Futures Open Interest. They don’t indicate whether the move is bullish or bearish on their own. They simply highlight where traders are becoming active.
The scans are:
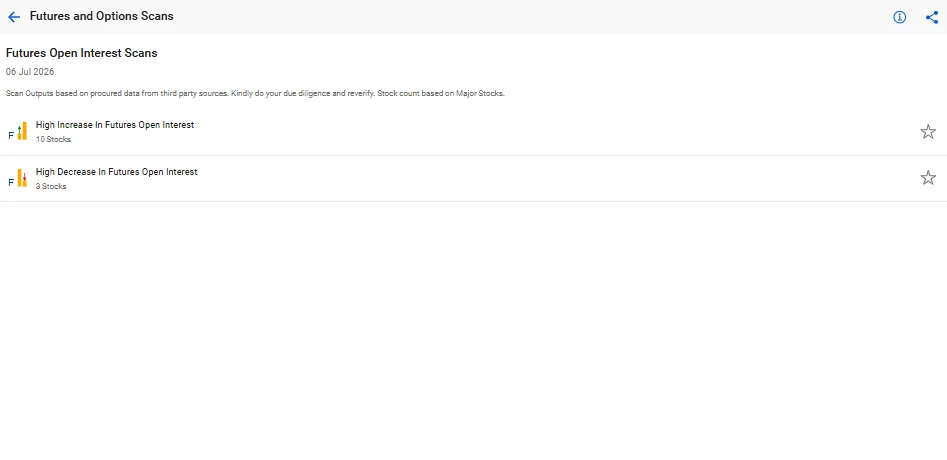
High Increase in Futures Open Interest
This stock scan highlights stocks where Open Interest has increased significantly compared to the previous session.
A sharp rise in Open Interest suggests that traders are adding fresh futures positions. To understand whether those positions are bullish or bearish, always combine this StockEdge scan with the stock’s price movement.
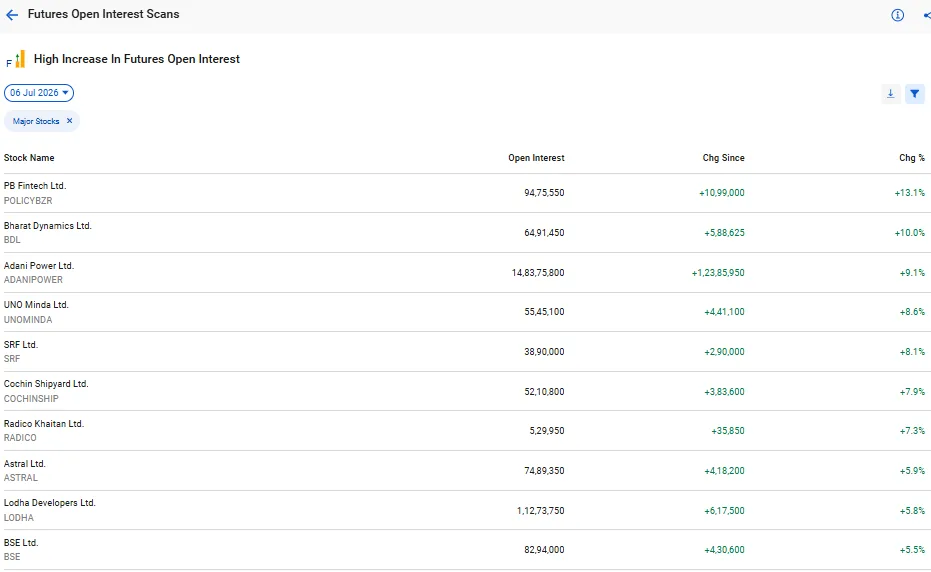
Example: If Adani Power appears in this scan with Open Interest increasing by 9%, it tells you traders are actively creating new futures positions. The price trend will reveal whether they’re buying or selling.
High Decrease in Futures Open Interest
This stock scan identifies stocks where Futures Open Interest has fallen sharply. A decline in Open Interest usually indicates that traders are closing existing positions. Depending on the price movement, this could represent long unwinding or short covering.
Use this scan to identify stocks where participation is reducing and existing trends may be losing momentum.
2. Futures Long Position Scans
These stock scans identify stocks where bullish futures positions are being created or existing bearish positions are being closed.
StockEdge classifies long-side activity into four scans.
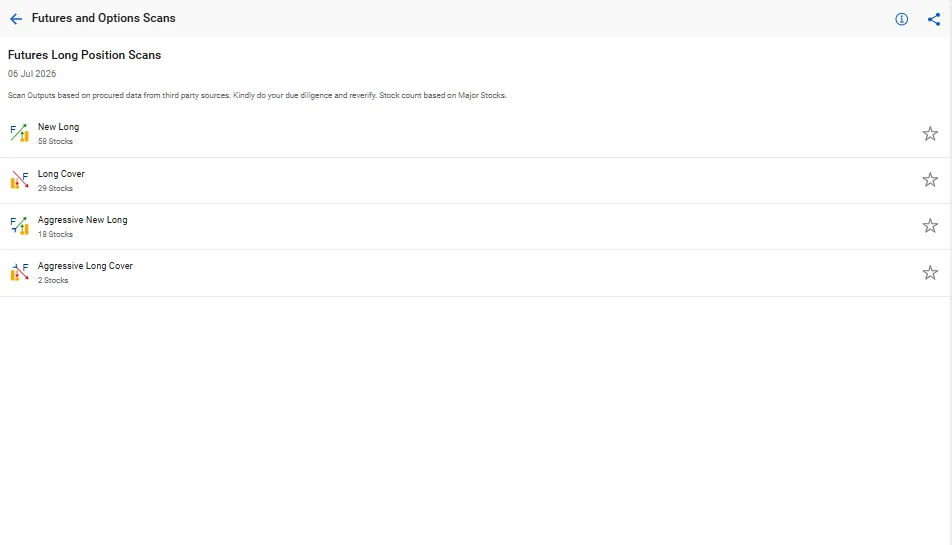
New Long
Price ↑ | Open Interest ↑
This is one of the strongest bullish setups.
Fresh buyers are entering the market while creating new futures contracts, indicating growing confidence.
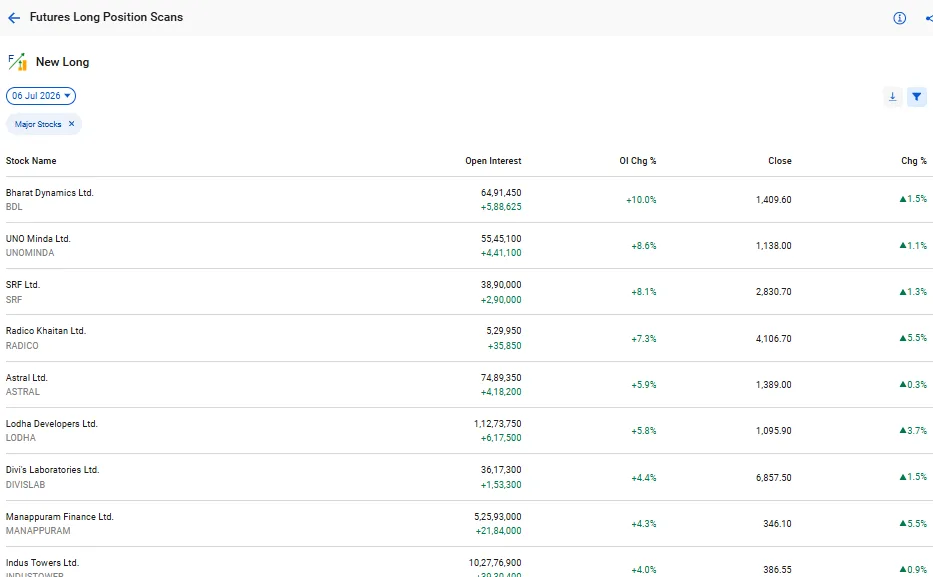
Example: Bharat Dynamics rises 1.5% while Open Interest increases by 10%. This suggests fresh long positions are being built.
Long Cover
Price ↑ | Open Interest ↓
This happens when traders who were holding short positions begin closing them.
Although prices move higher, the rally is mainly driven by short covering rather than aggressive fresh buying.
Aggressive New Long
Price ↑↑ | Open Interest ↑↑
This scan identifies stocks witnessing unusually strong buying activity with a sharp increase in Open Interest.
Such stocks often become momentum candidates and deserve a place on your watchlist.
Aggressive Long Cover
Price ↑↑ | Open Interest ↓↓
This scan highlights stocks where short sellers are exiting aggressively, leading to a sharp upside move.
These moves can be quick and volatile, especially after prolonged declines.
3. Futures Short Position Scans
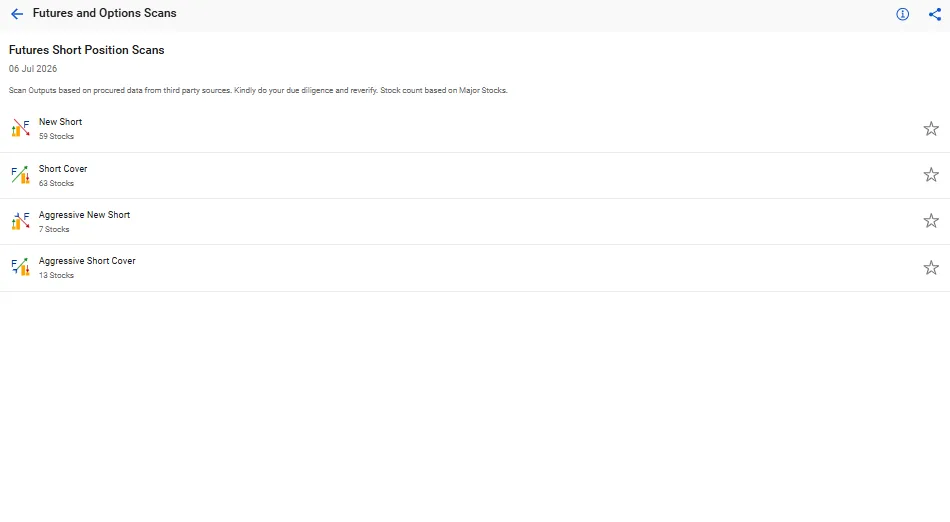
These stock scans help traders identify stocks where bearish futures positions are being created or where existing long positions are being closed.
The category includes four scans.
New Short
Price ↓ | Open Interest ↑
This indicates fresh bearish positions entering the market.
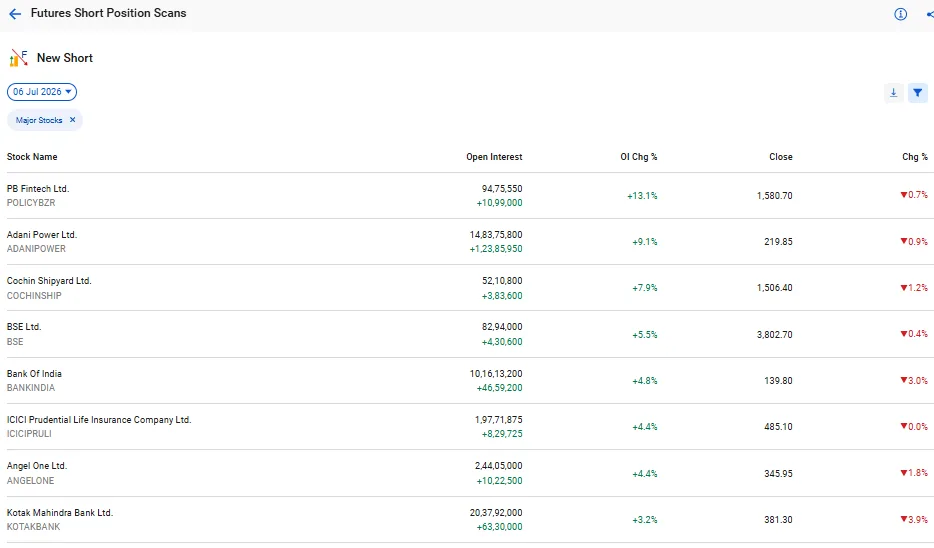
Example: Adani Power falls nearly 1% while Open Interest rises over 9%. This suggests traders are actively building fresh short positions.
Short Cover
Price ↑ | Open Interest ↓
Short sellers are booking profits by closing their positions.
This often leads to quick rallies but doesn’t necessarily indicate fresh buying.
Aggressive New Short
Price ↓↓ | Open Interest ↑↑
This scan highlights stocks witnessing aggressive short selling.
These stocks usually experience strong bearish momentum supported by rising participation.
Aggressive Short Cover
Price ↑↑ | Open Interest ↓↓
This indicates aggressive unwinding of short positions.
Sharp upside moves following heavy bearish trends often appear in this scan.
4. Put Call Ratio (PCR) Scans
Apart from Futures data, StockEdge also tracks changes in the Put Call Ratio (PCR), helping traders understand options market sentiment.
The scans include:
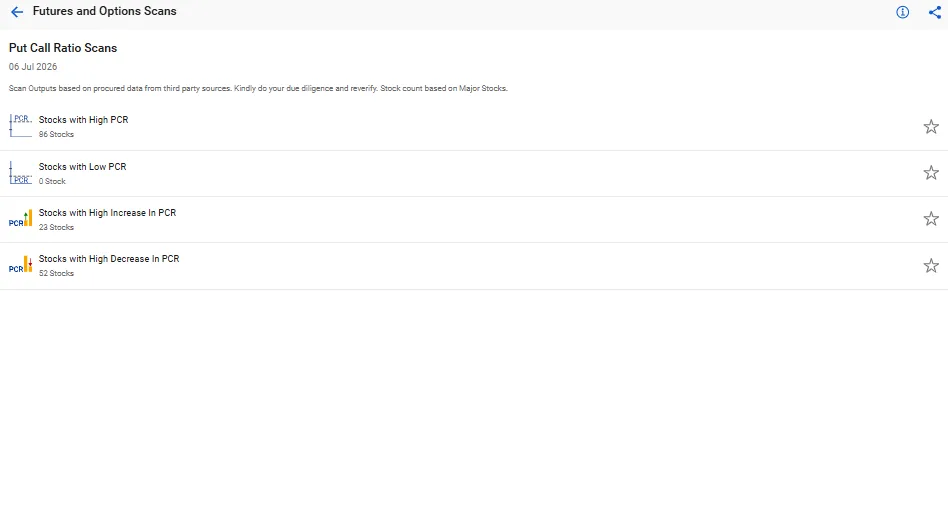
Stocks with High PCR
These stocks have a relatively higher Put Call Ratio, indicating Put Open Interest exceeds Call Open Interest.
A higher PCR often reflects bullish or neutral market sentiment, as traders expect important support levels to hold.
Stocks with Low PCR
These stocks have a relatively lower PCR because Call Open Interest is higher than Put Open Interest.
A lower PCR may indicate cautious or bearish sentiment, depending on the overall market trend.
Stocks with High Increase in PCR
This scan highlights stocks where the Put Call Ratio has increased sharply during the session.
A rising PCR suggests improving bullish sentiment in the options market and may indicate traders are writing more Put options.
Stocks with High Decrease in PCR
This scan identifies stocks where the Put Call Ratio has fallen significantly.
A declining PCR may indicate increasing bearishness or growing Call writing activity.
What is PCR?
PCR is calculated by dividing total Put Open Interest by total Call Open Interest.
Simply put, it tells you whether traders are leaning more towards puts or calls.
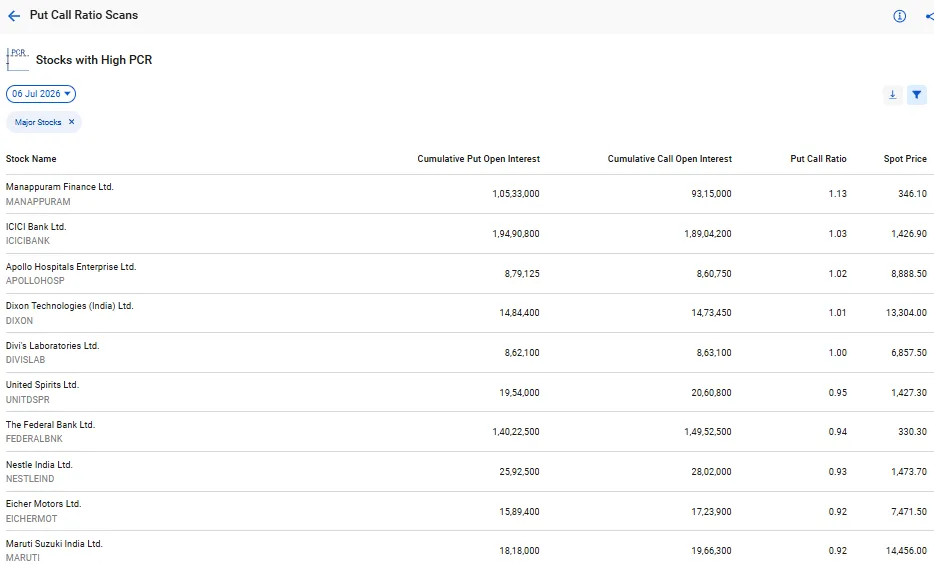
For example, if Manappuram Finance has a PCR of 1.13, it means Put Open Interest is higher than Call Open Interest, suggesting traders expect the stock to hold its support levels and maintain a positive bias.
Similarly, a very low PCR may indicate bearish expectations or excessive optimism depending on market conditions.
The key is to treat PCR as a sentiment indicator, not a standalone buy or sell signal.
How to Use StockEdge Futures and Options Scans
A simple trading routine could look like this:
- Check the New Long and New Short scans to identify where fresh positions are being built.
- Next, verify whether Open Interest is increasing alongside the price movement.
- Then look at the PCR scans to understand the broader options sentiment.
- Finally, confirm the setup using your preferred technical tools such as support and resistance, moving averages, RSI, or chart patterns before taking a trade.
This process takes only a few minutes but can significantly improve the quality of your trade selection.
Conclusion
Markets leave clues long before a big move becomes obvious on the chart.
Open Interest and Put Call Ratio are two of those clues, helping traders understand where institutional participation is increasing and where market sentiment is shifting.
With StockEdge Futures and Options Scans, you don’t have to dig through endless derivatives data yourself. The platform does the heavy lifting, allowing you to quickly identify stocks witnessing fresh buying, fresh selling, short covering, or changes in options sentiment.
Used alongside technical analysis and proper risk management, these scans can become a powerful addition to your trading toolkit, helping you spend less time searching and more time focusing on high-probability trading opportunities.
Suggested Read: 7 Useful StockEdge Scans Explained
FAQs
1. How frequently are Futures and Options scans updated in StockEdge?
The scans are refreshed using the latest available F&O data, allowing traders to monitor significant changes in Open Interest and PCR after market updates.
2. What is a good Put Call Ratio to indicate a bullish or bearish market?
Generally, a PCR above 1 suggests relatively bullish sentiment, while a PCR below 1 indicates relatively bearish sentiment. However, PCR should always be interpreted alongside price action, Open Interest, and the broader market trend.
3. What is the difference between Open Interest build-up and unwinding?
Open Interest build-up occurs when new futures contracts are created, indicating fresh participation in the market. Open Interest unwinding happens when existing contracts are closed, showing that traders are exiting their positions. Combining these changes with price movement helps determine whether the market is witnessing fresh buying, fresh selling, long unwinding, or short covering.