StockEdge.com
  • Products
    • StockEdge Premium
    • StockEdge Pro
    • StockEdge Club
  • Stories
StockEdge Blog
  • Trending Stocks
  • Insights
  • Technical Analysis
  • Fundamental Analysis
  • StockEdge Tutorials
  • Mutual Fund
No Result
View All Result
  • Trending Stocks
  • Insights
  • Technical Analysis
  • Fundamental Analysis
  • StockEdge Tutorials
  • Mutual Fund
No Result
View All Result
StockEdge
Home Tutorials Technical Tutorials
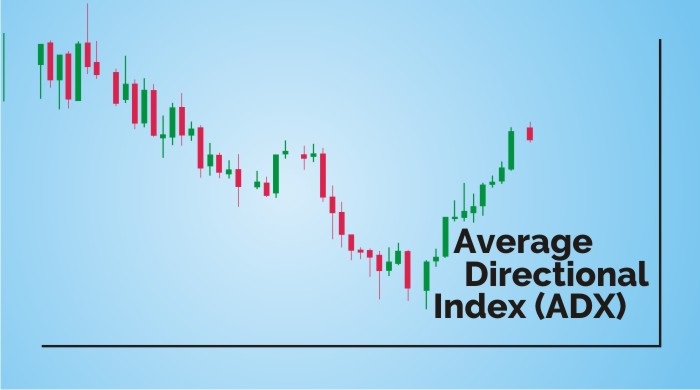
A line graph representing the average directional index (adx) on a blue background. The line graph is red and green in color. The x-axis is not labeled, but the y-axis is labeled with numbers from 0 to 100. The line graph has a downward trend at the beginning, then an upward trend towards the end.

How to Use Average Directional Index (ADX)

StockEdge by StockEdge
February 28, 2023
Reading Time: 4 mins read
14.2k
VIEWS
Share on FacebookShare on XShare On WhatsApp

Table of Contents

  • What is Average Directional Index?
  • Using Average Directional Index in StockEdge App:
    • Example 1: ADX Crossing 25 from Below and ADX Crossing 25 from Above:
      • Example 2: ADX Crossing 40 from Above and ADX Crossing 40 from Below:
      • Example 3: ADX Crossing 10 from Below and ADX Crossing 10 from Above:
      • Example 5: + DI Crossing 25 from Below and – DI Crossing 25 from Below:
    • TRADING & INVESTING WITH ADX (AVERAGE DIRECTIONAL MOVEMENT INDEX)

“Follow the trend, the trend is your friend”- Jesse Livermore

When we trade in the direction of a strong trend, it reduces risk and also increases our profit potential.

The Average Directional Index (ADX) is a technical analysis indicator which is used by the traders for determining the strength of the ongoing trend.

This ongoing trend can either by uptrend or downtrend which is shown by two accompanying indicators, the Positive Directional Indicator (+ DI) and the Negative Directional Index (- D).

These ADX lines help the investors to take trade decisions whether to go long or short.

Let us discuss about this indicator in details:

What is Average Directional Index?

The Average Directional Index along with the Directional movement indicators (DMI) such as Positive Directional Index and Negative Directional Index forms a trading system which was developed by Welles Wilder.

DMI is used for identifying the ongoing trend.

DMI ranges between the values of 0 and 100.

To know more about Average Directional Index, watch the video below on StockEdge ADX Scan Tutorial:

Using Average Directional Index in StockEdge App:

We have discussed about the basics of ADX, now let us discuss how to use this technical indicator to filter out stocks for trading:

In StockEdge there are many Average Directional Index scans available for filtering out stocks for trading:

Let us discuss a few of these scans:

Example 1: ADX Crossing 25 from Below and ADX Crossing 25 from Above:
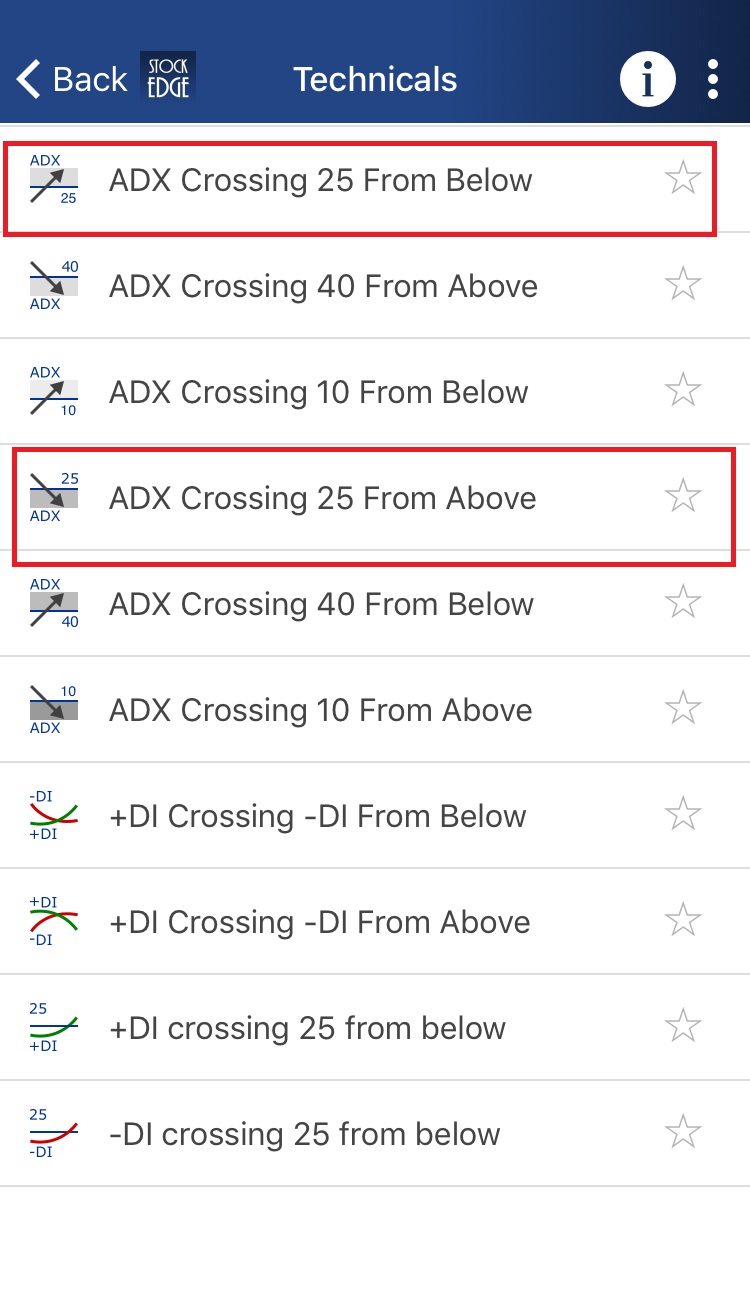
Average directional index technicals scan

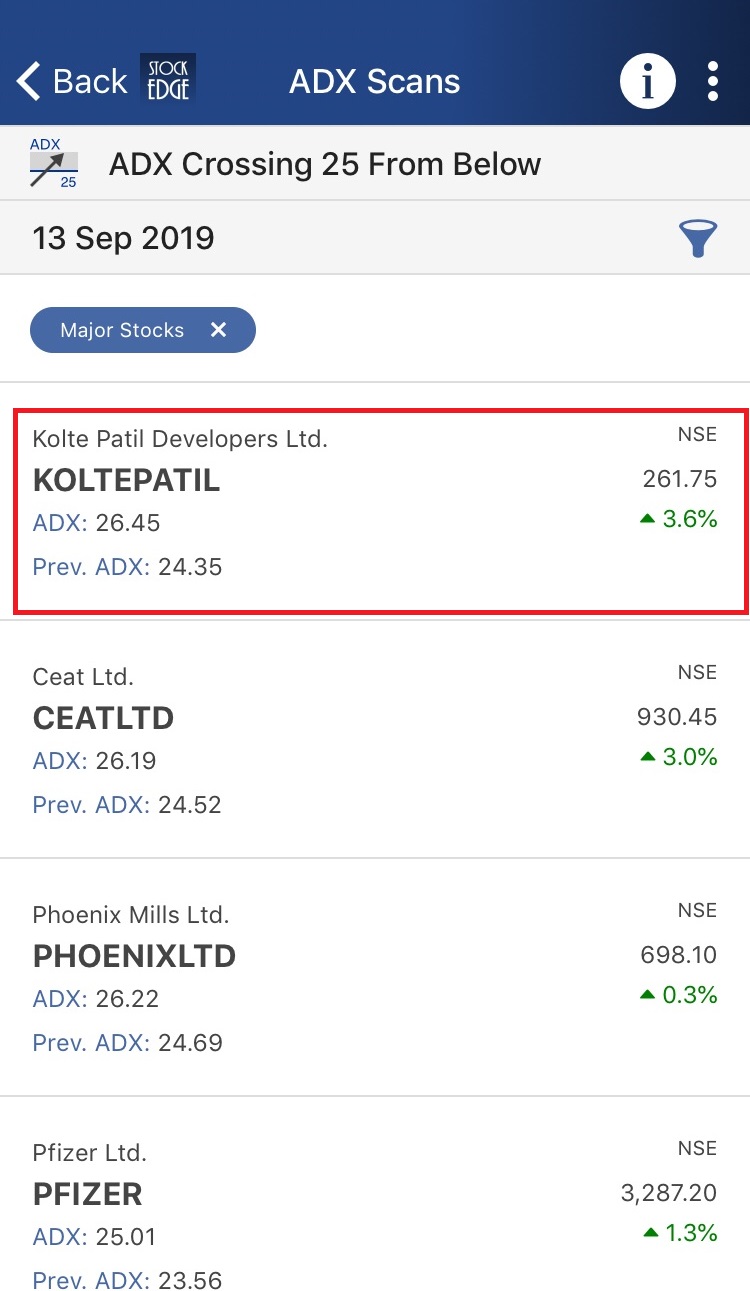
ADX Crossing 25 from Below indicates that the stock is in trending phase whereas ADX Crossing 25 from Above indicates that the stock is in consolidation phase.

When we click on ADX Crossing 25 from Below scan, we get a list of stocks which fulfill this criterion:
Adx 2

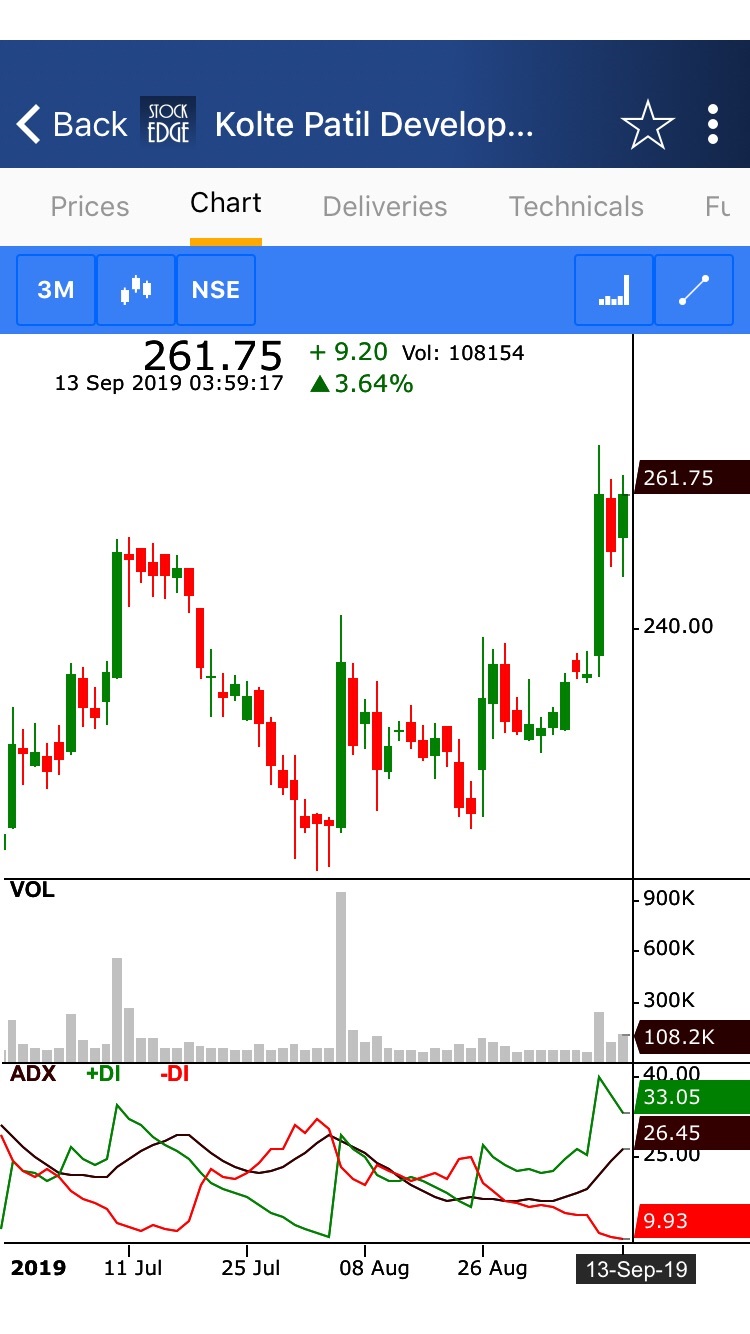
After clicking on Kolte Patill Developers Ltd. we get a technical chart with ADX plotted in the sub-graph:
Adx 3

Example 2: ADX Crossing 40 from Above and ADX Crossing 40 from Below:
Adx 4

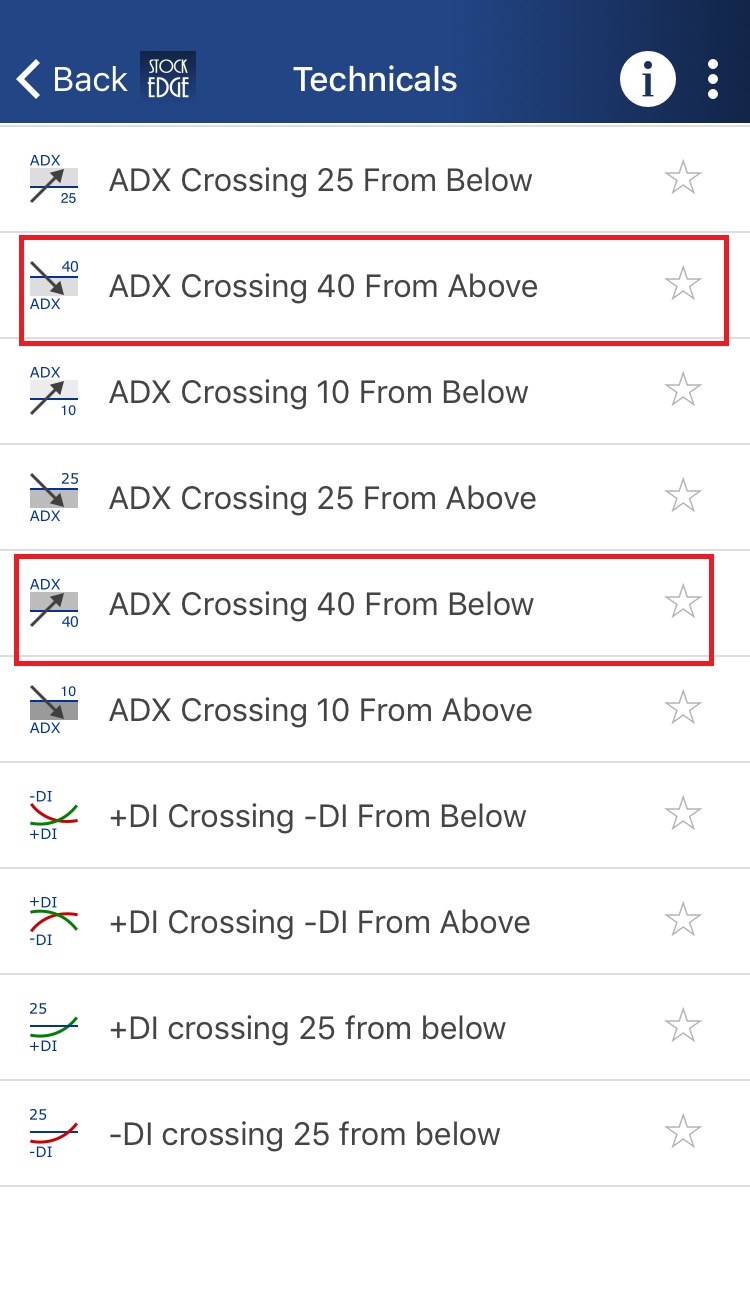
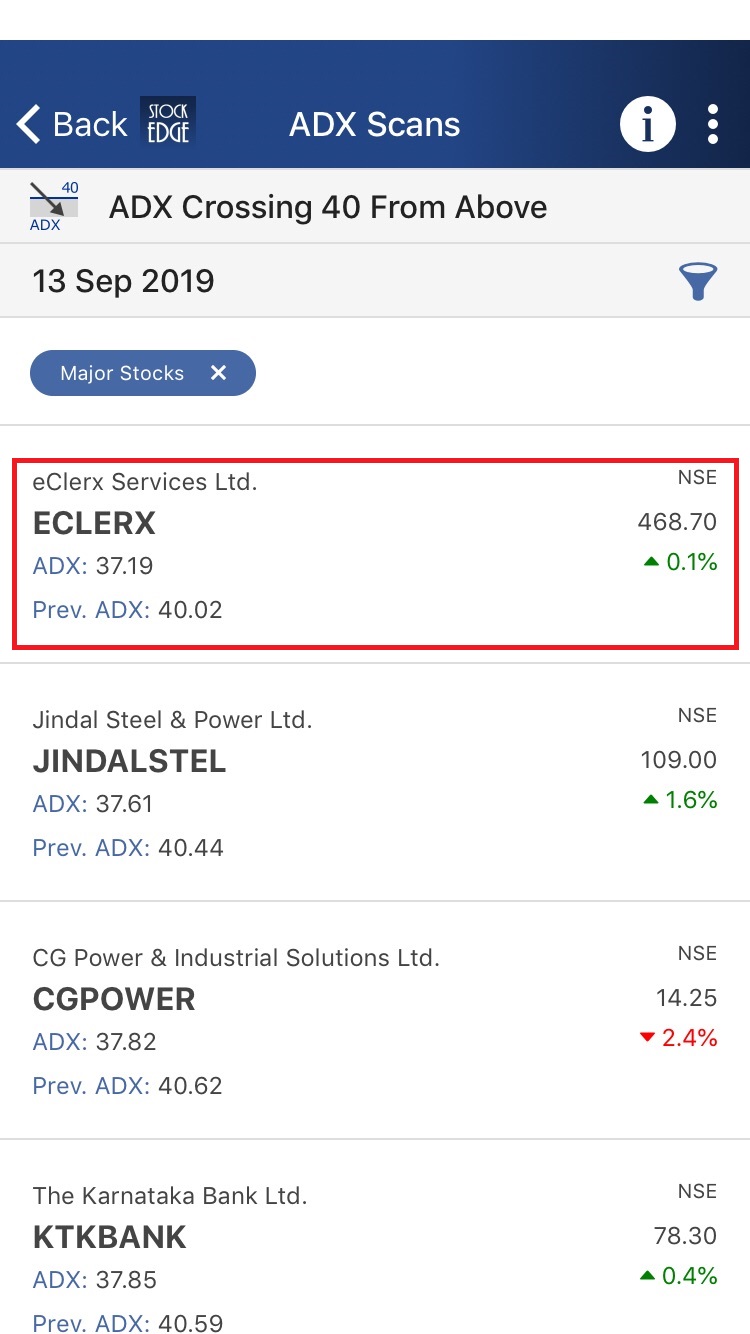
ADX Crossing 40 from Above indicates beginning of consolidation after a strong uptrend whereas ADX Crossing 40 from Below indicates that the stock is entering strong trend zone after being consolidated.

When we click on ADX Crossing 40 from Above scan, we get a list of stocks which fulfill this criterion:
Adx 5

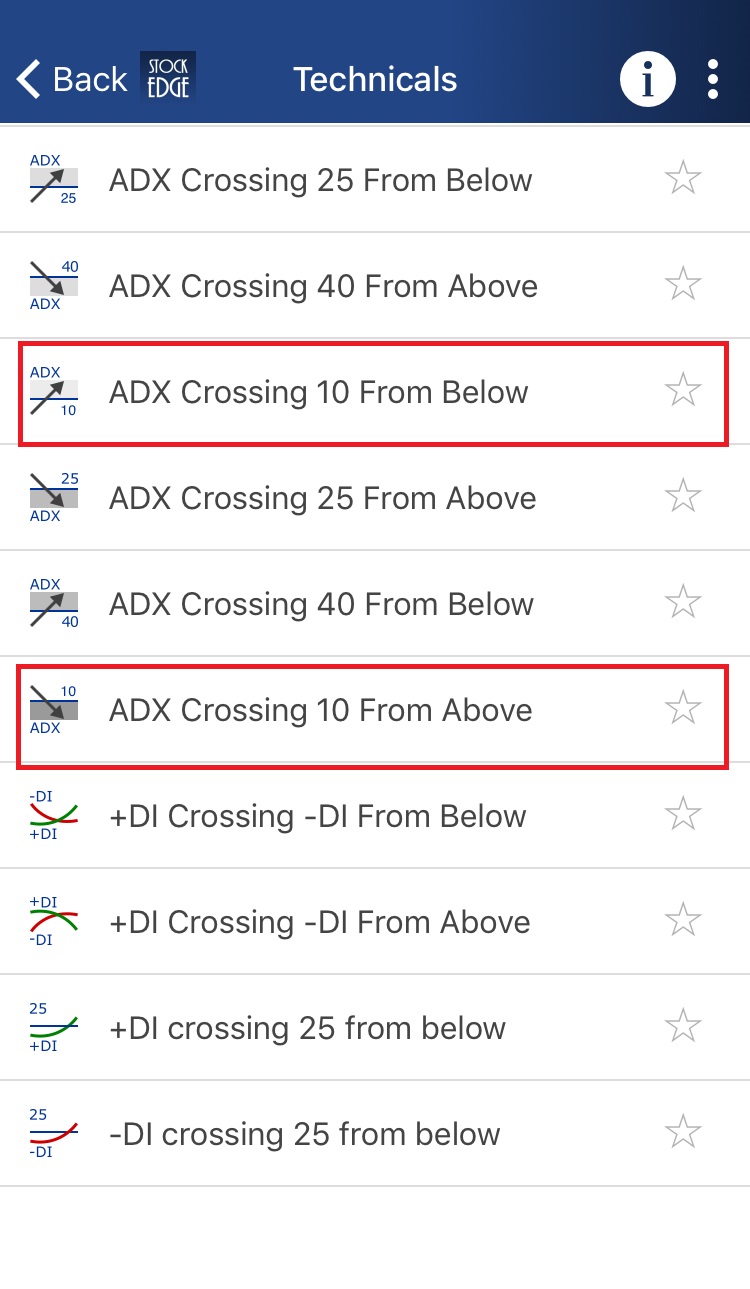
Example 3: ADX Crossing 10 from Below and ADX Crossing 10 from Above:
Adx 7

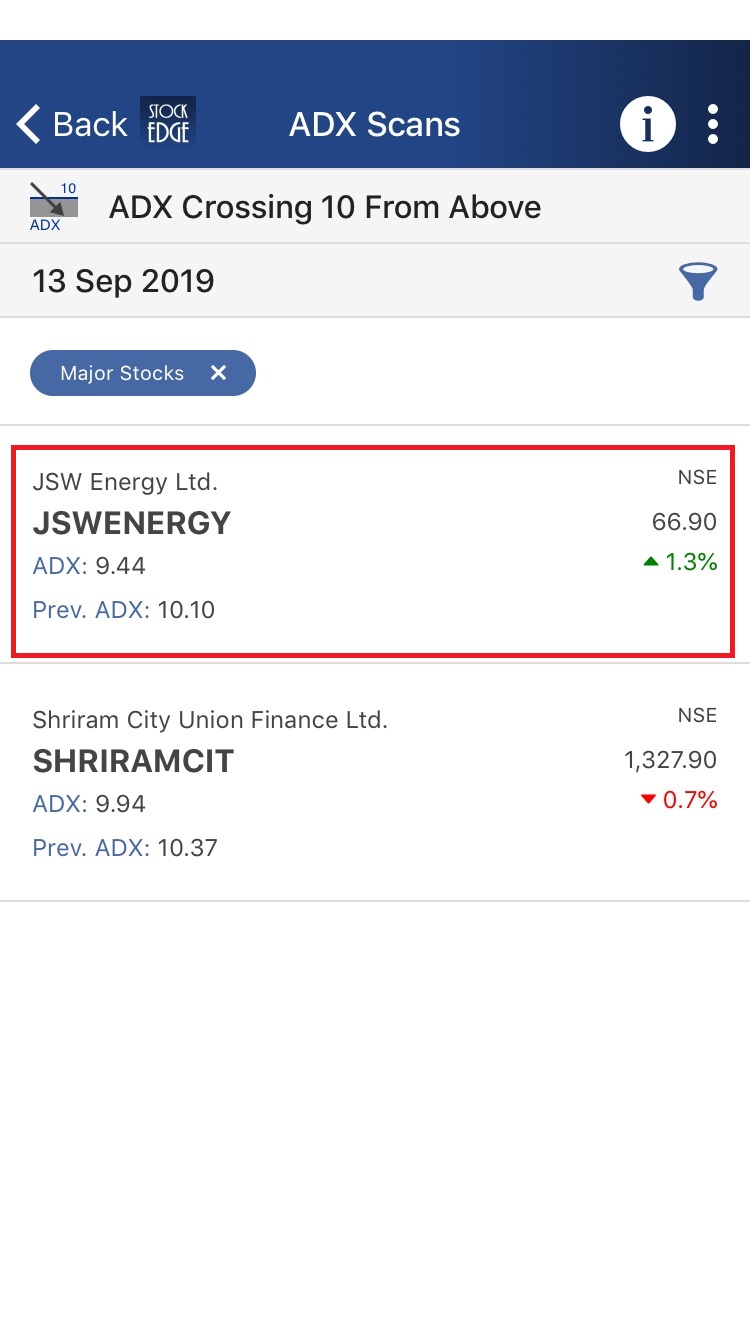
ADX Crossing 10 from Below indicates that the stock is entering the range bound zone whereas ADX Crossing 10 from Above indicates that the trend is weak.

When we click on ADX Crossing 10 from Above scan, we get a list of stocks which fulfill this criterion:
Adx 8Example 4: + DI Crossing – DI from Below and + DI Crossing – DI from Above:

Adx 10

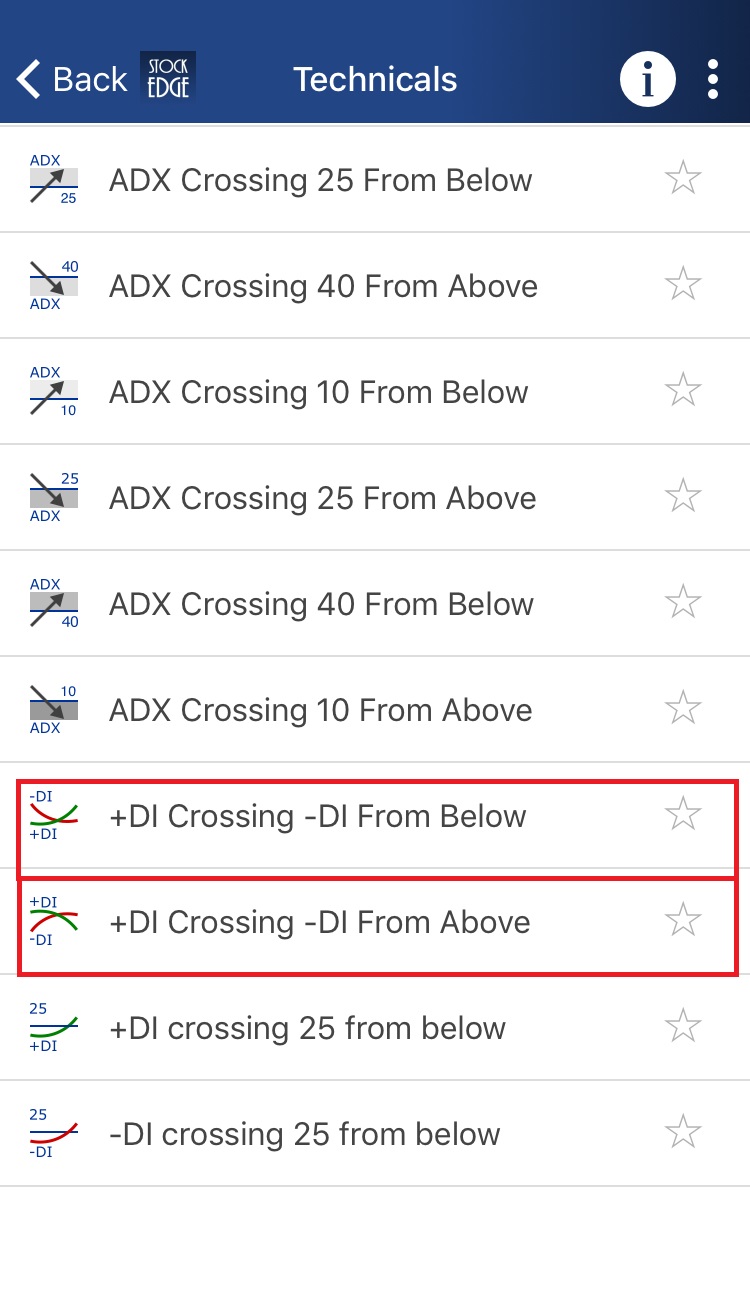
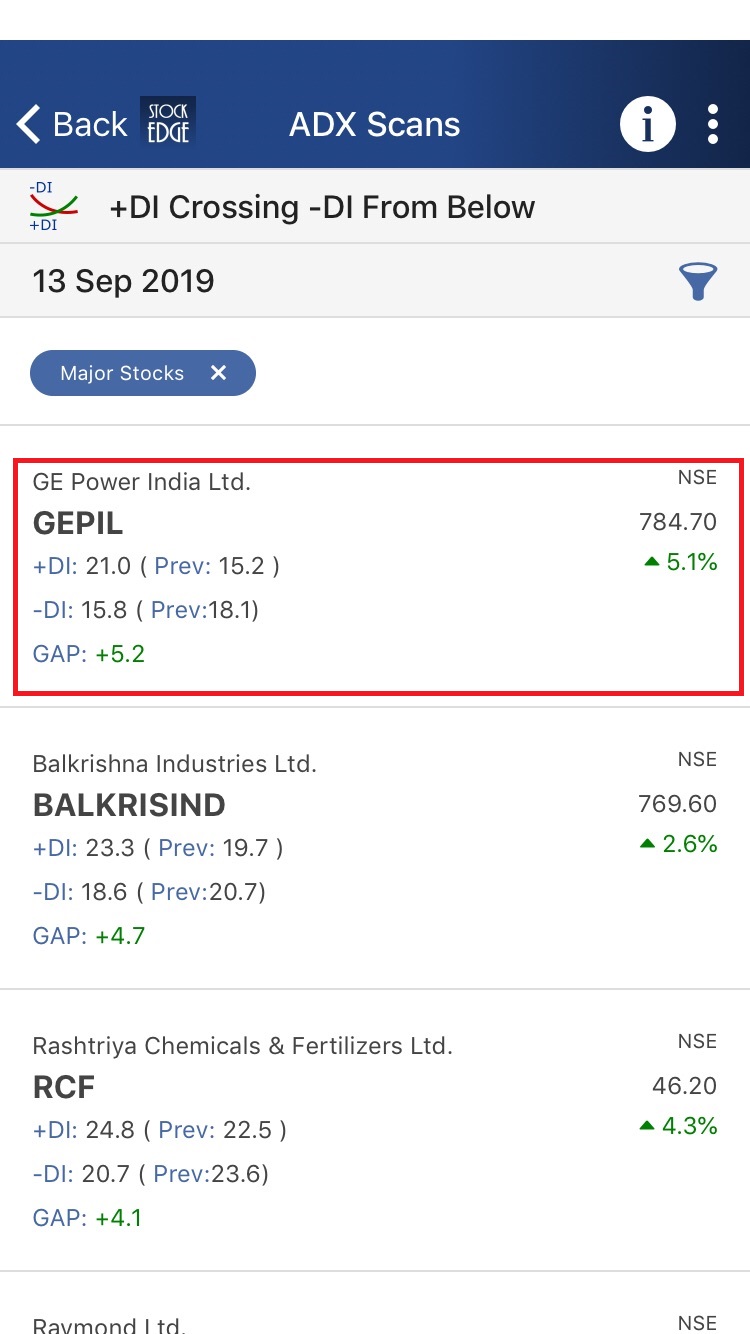
+ DI Crossing – DI from Below is a bullish scan which signifies probable beginning of an uptrend whereas + DI Crossing – DI from Above is a bearish scan which signifies probable beginning of a downtrend.

When we click on + DI Crossing – DI from Below scan, we get a list of stocks which fulfill this criterion:
Adx 11

Example 5: + DI Crossing 25 from Below and – DI Crossing 25 from Below:
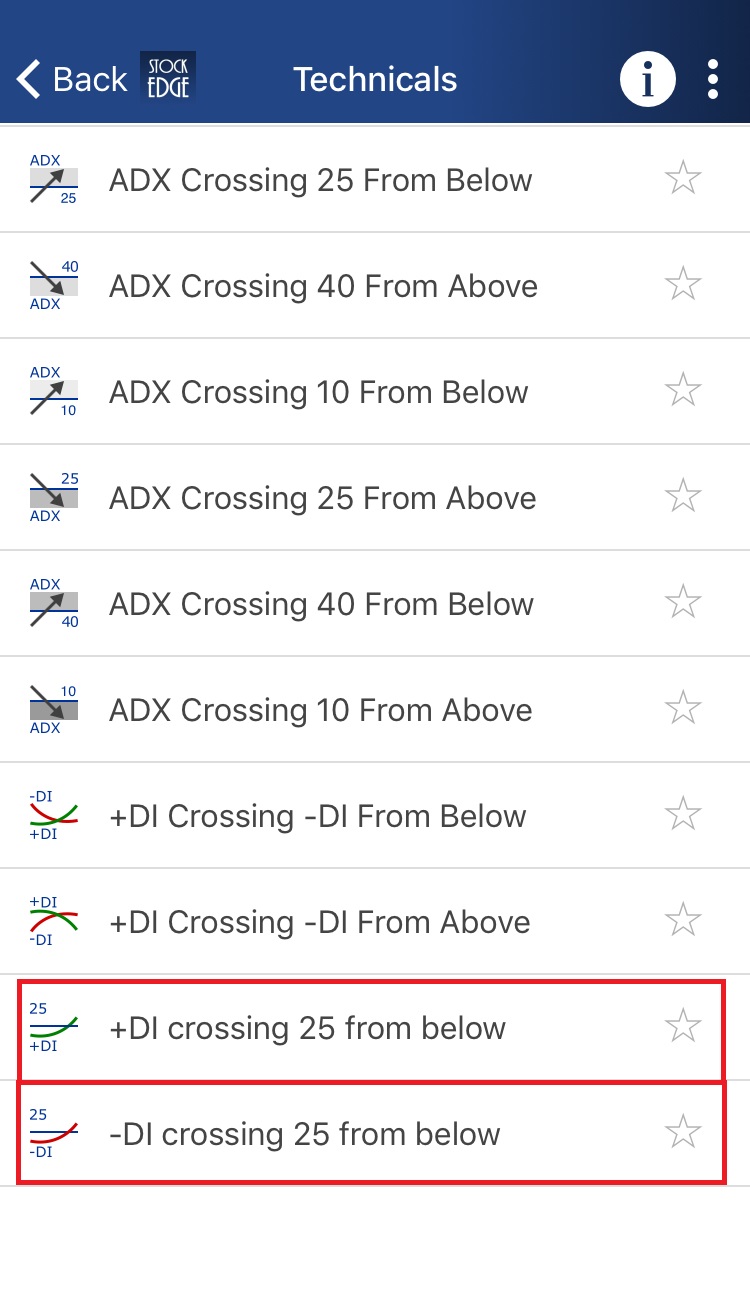
Adx 13

+ DI Crossing 25 from Below indicates that the stock has potential of continuing upward momentum whereas – DI Crossing 25 from Below indicates that the stock has potential of continuing downward momentum.

When we click on + DI Crossing 25 from Below scan, we get a list of stocks which fulfill this criterion:
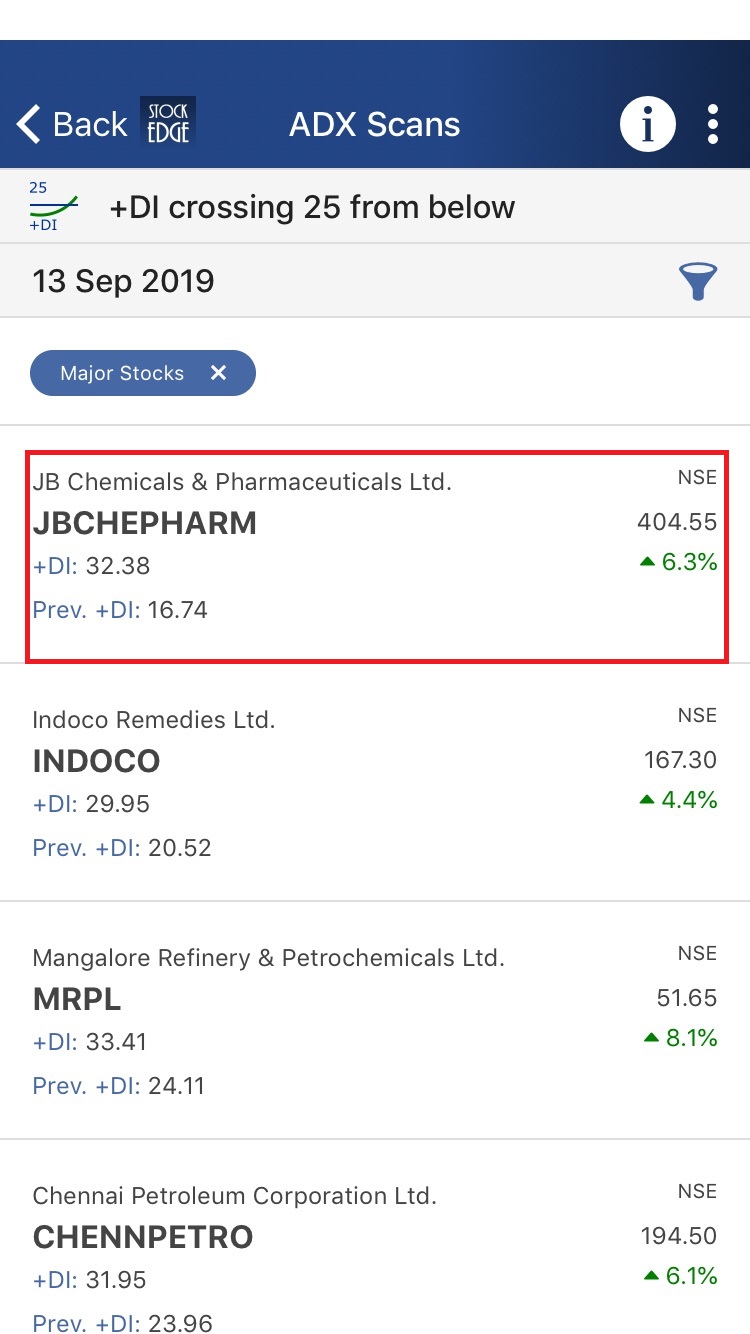
Adx 14

Above are examples of the ADX scans that generates buy and sell signals and also give us a list of the stock which fulfills the criteria of the scans for that particular day.

You can filter out the stocks and can trade accordingly using these scans.

Average Directional Index scans and Interactive charts are only available for paid subscribers. You can check out our subscriber plans from here.

To have a comprehensive idea of the Average Directional Index, click here.

Want to trade and invest with ADX? Avail the course:

TRADING & INVESTING WITH ADX (AVERAGE DIRECTIONAL MOVEMENT INDEX)

Tags: technical analysisTechnical indicatorsTechnical scans
ShareTweetSend
Open A Zero Brokerage Account In Kotak Open A Zero Brokerage Account In Kotak Open A Zero Brokerage Account In Kotak
Previous Post

What is Commodity Channel Index (CCI)?

Next Post

Parabolic SAR (PSAR): Definition & Calculation

StockEdge

StockEdge

StockEdge is a self-help Equity and Mutual Fund research tool. It empowers retail investors to identify investment opportunity with all the necessary data and analytics.

Next Post
A image of of the parabolic sar (psar) technical indicator. The chart is a line graph with red and green bars on a light blue background. The chart has a title “parabolic sar (psar)” in black text

Parabolic SAR (PSAR): Definition & Calculation

A line graph with red and green bars representing the average true range ( atr) of a stock.

Average True Range (ATR)

An illustration of a magnifying glass over a bar graph on a blue background. The magnifying glass is orange and the bar graph is white. The text “find stocks among peers” is written in white above the bar graph.

Using My Combination Scan to Identify best in an Industry

Disclaimer

StockEdge (Kredent InfoEdge Pvt. Ltd.) is a SEBI-registered Research Analyst (RA) entity (SEBI Registration No: INH300007493). The information provided in this article is for educational and informational purposes only and should not be considered as an offer to buy or sell any securities or investment products.

The stocks, securities, and investment instruments mentioned herein are not recommendations under SEBI (Research Analysts) Regulations, 2014. Readers are advised to conduct their own due diligence and seek independent financial advice before making any investment decisions.

Investments in securities markets are subject to market risks. Please read all related documents carefully before investing. Investing in Equity Shares,
Derivatives, Mutual Funds, or other instruments carry inherent risks, including potential loss of capital. StockEdge (Kredent InfoEdge Pvt. Ltd.) does not provide any guarantee or assurance of returns on any investments. Past performance is not indicative of future performance.

Contact Us
  • Timing (Mon-Sat): 10 am to 7 pm
  • Sales: +919830994463
  • Support: +919830994402
  • Club Support: +916289906895
  • Affiliate: +917003567131
Recent Posts
2 Ethanol Stocks in India
Top 2 Ethanol Stocks in India
Check out the Top 3 Consumption Stocks in India
Top 3 Consumption Stocks in India
Important Links
  • StockEdge.com
  • StockEdge Premium
  • StockEdge Pro
  • StockEdge Club
  • Compare Plans
An Initiative Of
Logo of KREDENT INFOEDGE with SEBI Registration no.

© 2025 Kredent InfoEdge Pvt Ltd.

Facebook-f Twitter Instagram Linkedin-in Youtube Pinterest-p Whatsapp Telegram

Get StockEdge App

No Result
View All Result
  • Home
  • Article Categories
    • Trending Stocks
    • Insights
    • Technical Analysis
    • Fundamental Analysis
    • StockEdge Tutorials
    • Mutual Fund
  • Stories
  • Products
    • StockEdge Premium
    • StockEdge Pro
    • StockEdge Club
  • Visit StockEdge.com

© 2024 Kredent InfoEdge Pvt Ltd.