Table of Contents
“Follow the trend, the trend is your friend”- Jesse Livermore
When we trade in the direction of a strong trend, it reduces risk and also increases our profit potential.
The Average Directional Index (ADX) is a technical analysis indicator which is used by the traders for determining the strength of the ongoing trend.
This ongoing trend can either by uptrend or downtrend which is shown by two accompanying indicators, the Positive Directional Indicator (+ DI) and the Negative Directional Index (- D).
These ADX lines help the investors to take trade decisions whether to go long or short.
Let us discuss about this indicator in details:
What is Average Directional Index?
The Average Directional Index along with the Directional movement indicators (DMI) such as Positive Directional Index and Negative Directional Index forms a trading system which was developed by Welles Wilder.
DMI is used for identifying the ongoing trend.
DMI ranges between the values of 0 and 100.
To know more about Average Directional Index, watch the video below on StockEdge ADX Scan Tutorial:
Using Average Directional Index in StockEdge App:
We have discussed about the basics of ADX, now let us discuss how to use this technical indicator to filter out stocks for trading:
In StockEdge there are many Average Directional Index scans available for filtering out stocks for trading:
Let us discuss a few of these scans:
Example 1: ADX Crossing 25 from Below and ADX Crossing 25 from Above:
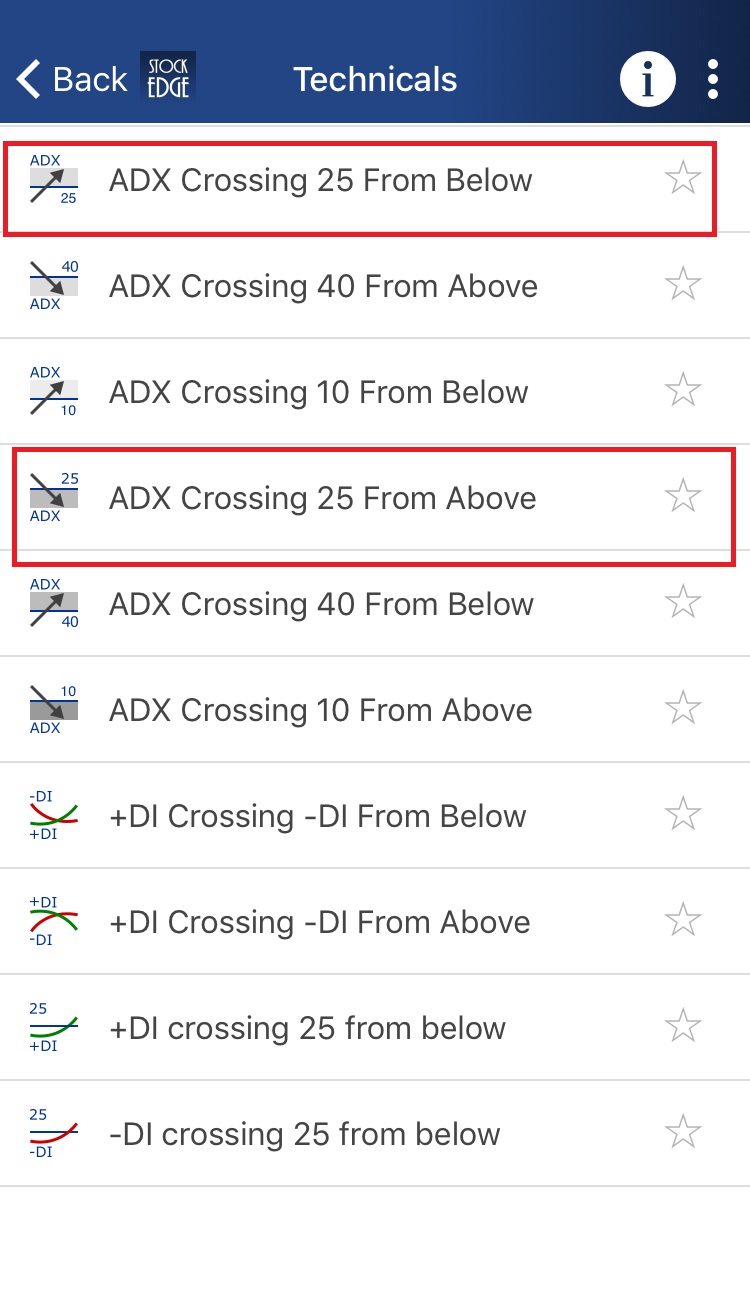
ADX Crossing 25 from Below indicates that the stock is in trending phase whereas ADX Crossing 25 from Above indicates that the stock is in consolidation phase.
When we click on ADX Crossing 25 from Below scan, we get a list of stocks which fulfill this criterion:
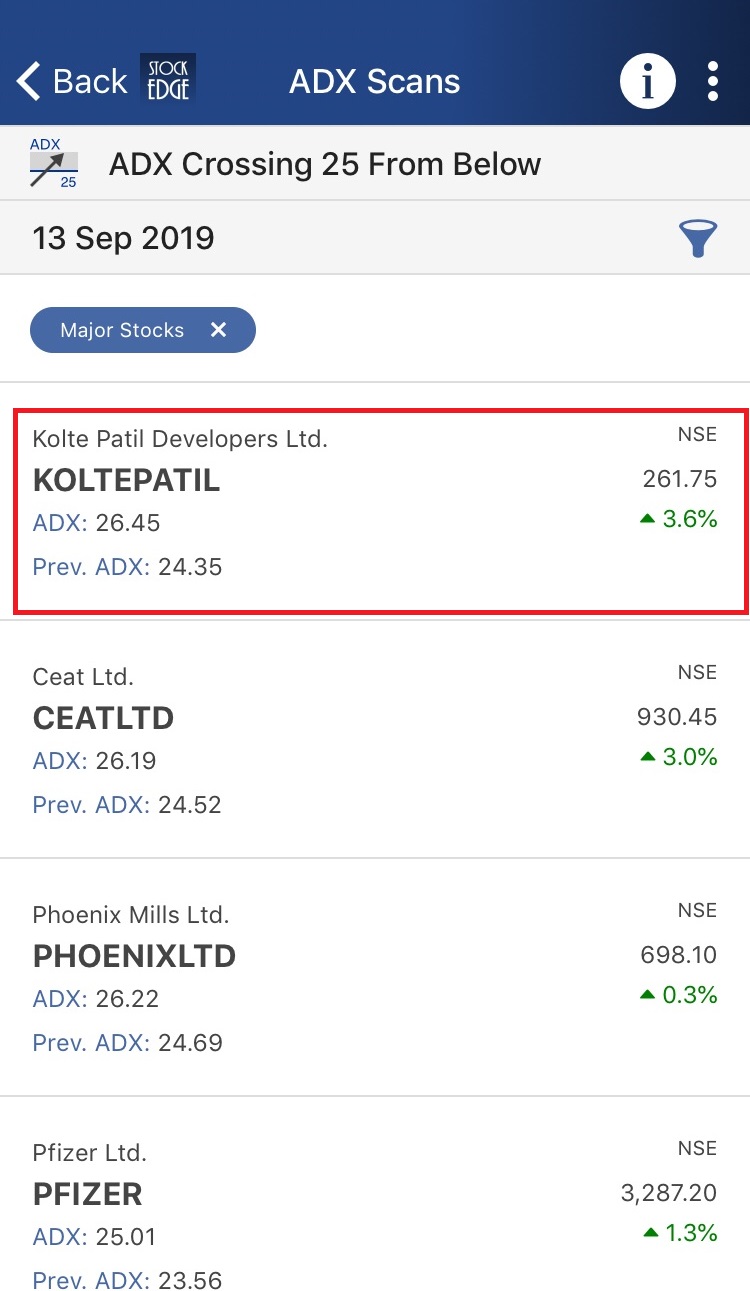
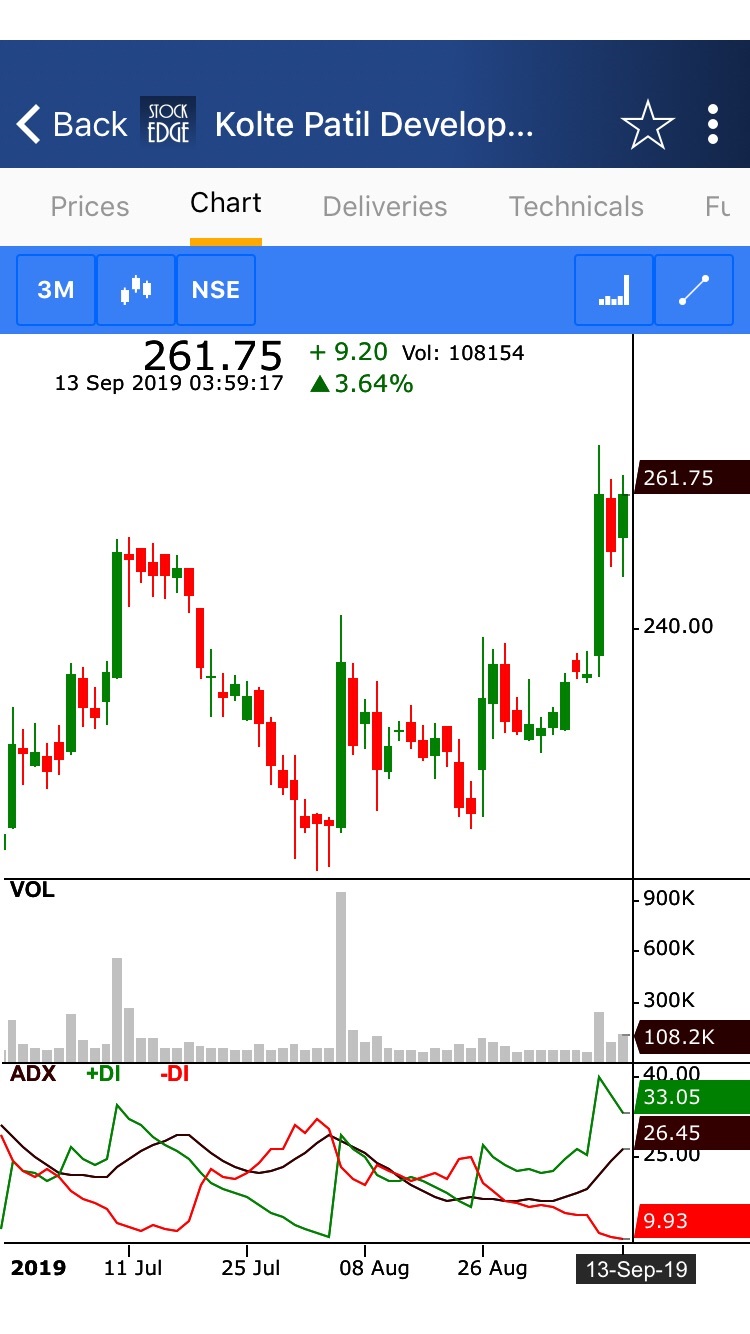
After clicking on Kolte Patill Developers Ltd. we get a technical chart with ADX plotted in the sub-graph:
Example 2: ADX Crossing 40 from Above and ADX Crossing 40 from Below:
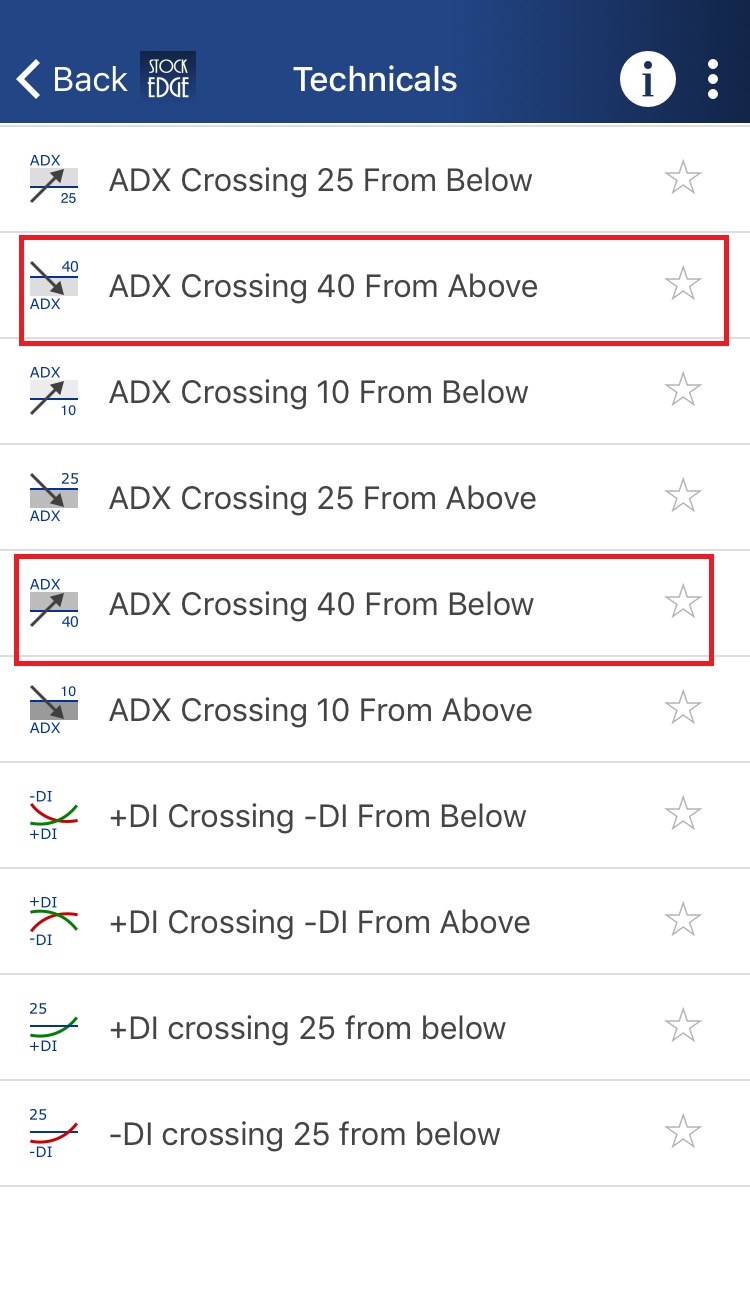
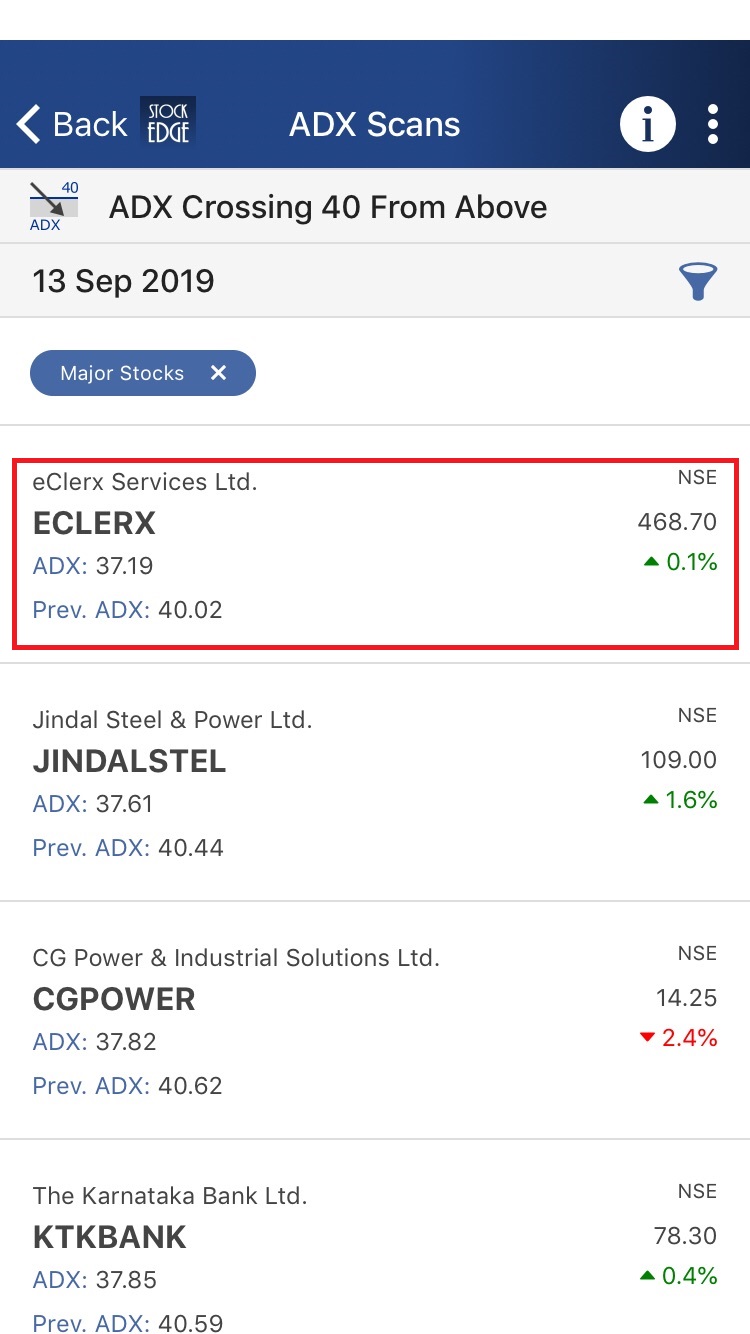
ADX Crossing 40 from Above indicates beginning of consolidation after a strong uptrend whereas ADX Crossing 40 from Below indicates that the stock is entering strong trend zone after being consolidated.
When we click on ADX Crossing 40 from Above scan, we get a list of stocks which fulfill this criterion:
Example 3: ADX Crossing 10 from Below and ADX Crossing 10 from Above:
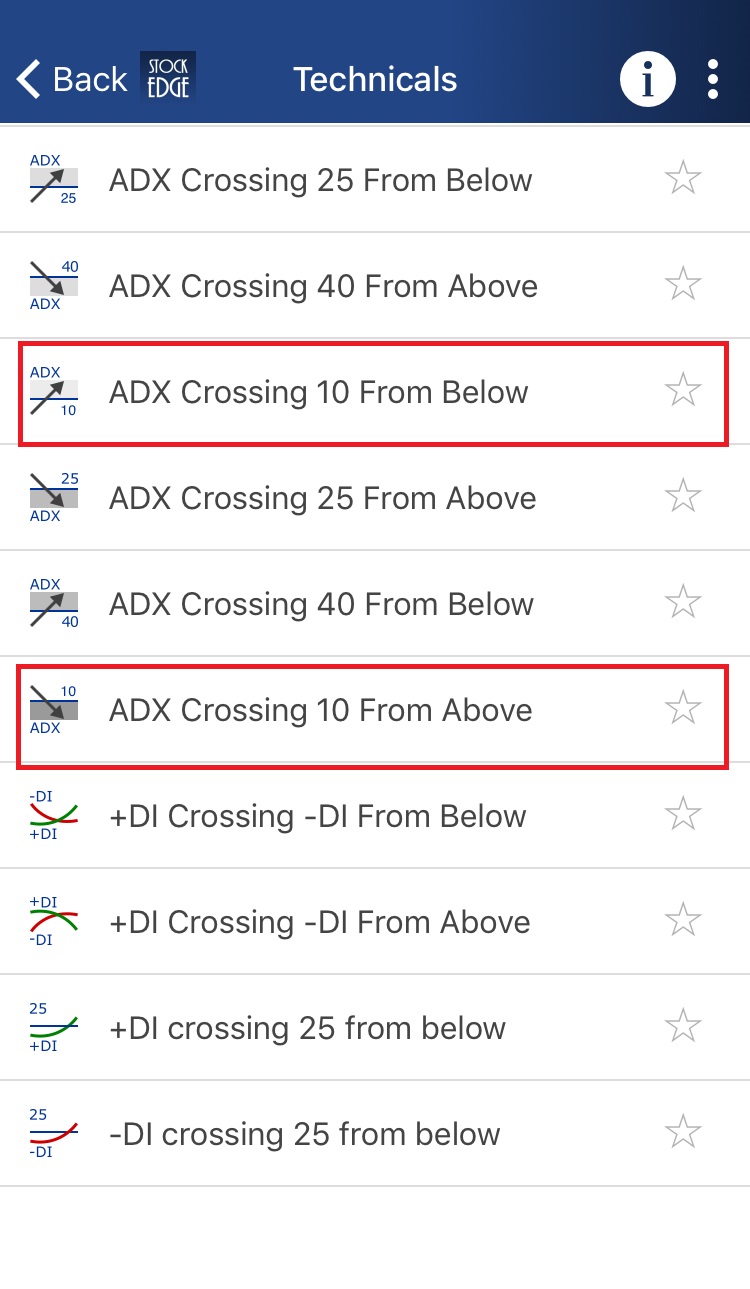
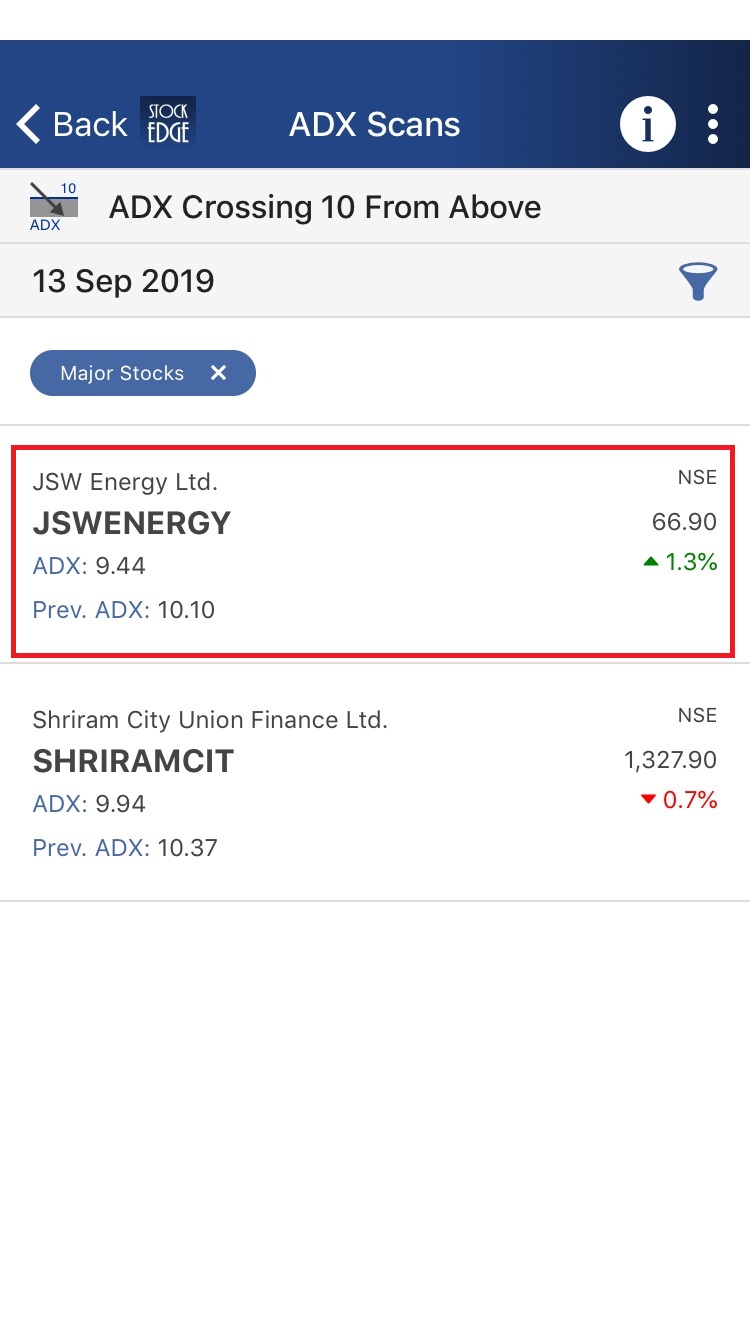
ADX Crossing 10 from Below indicates that the stock is entering the range bound zone whereas ADX Crossing 10 from Above indicates that the trend is weak.
When we click on ADX Crossing 10 from Above scan, we get a list of stocks which fulfill this criterion:
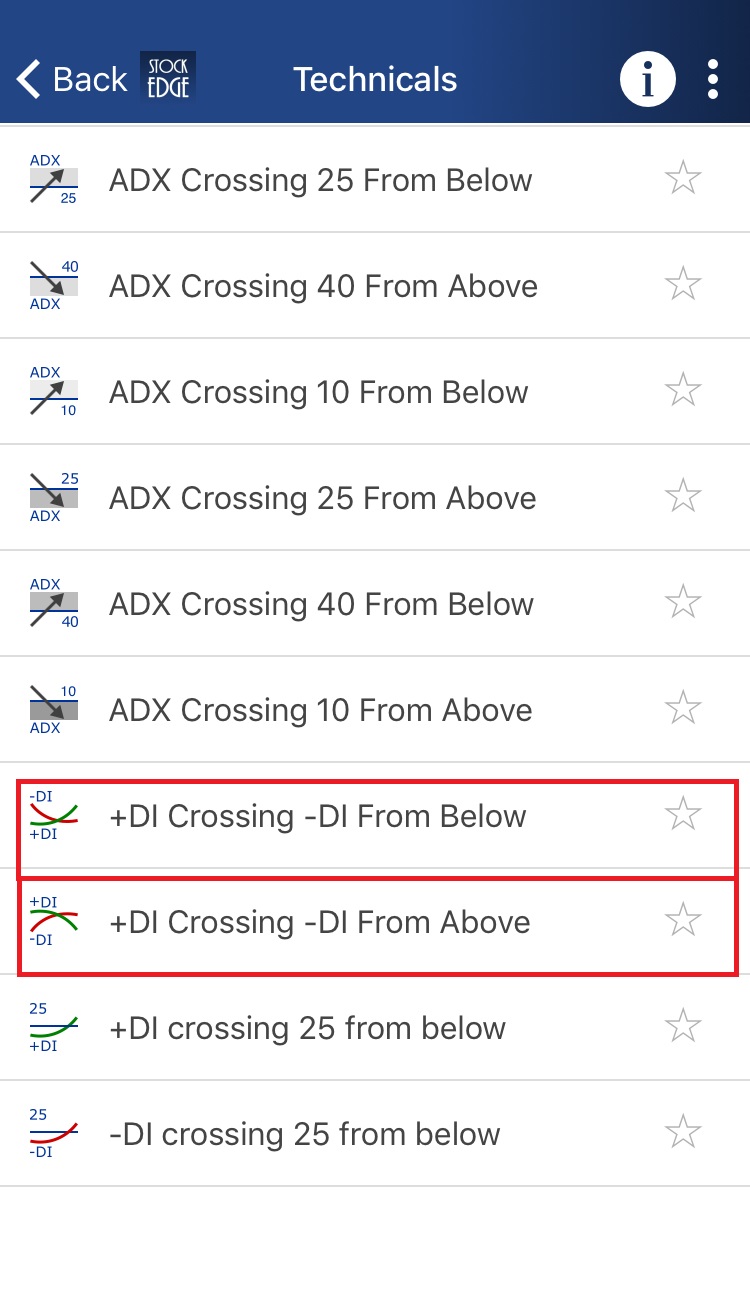
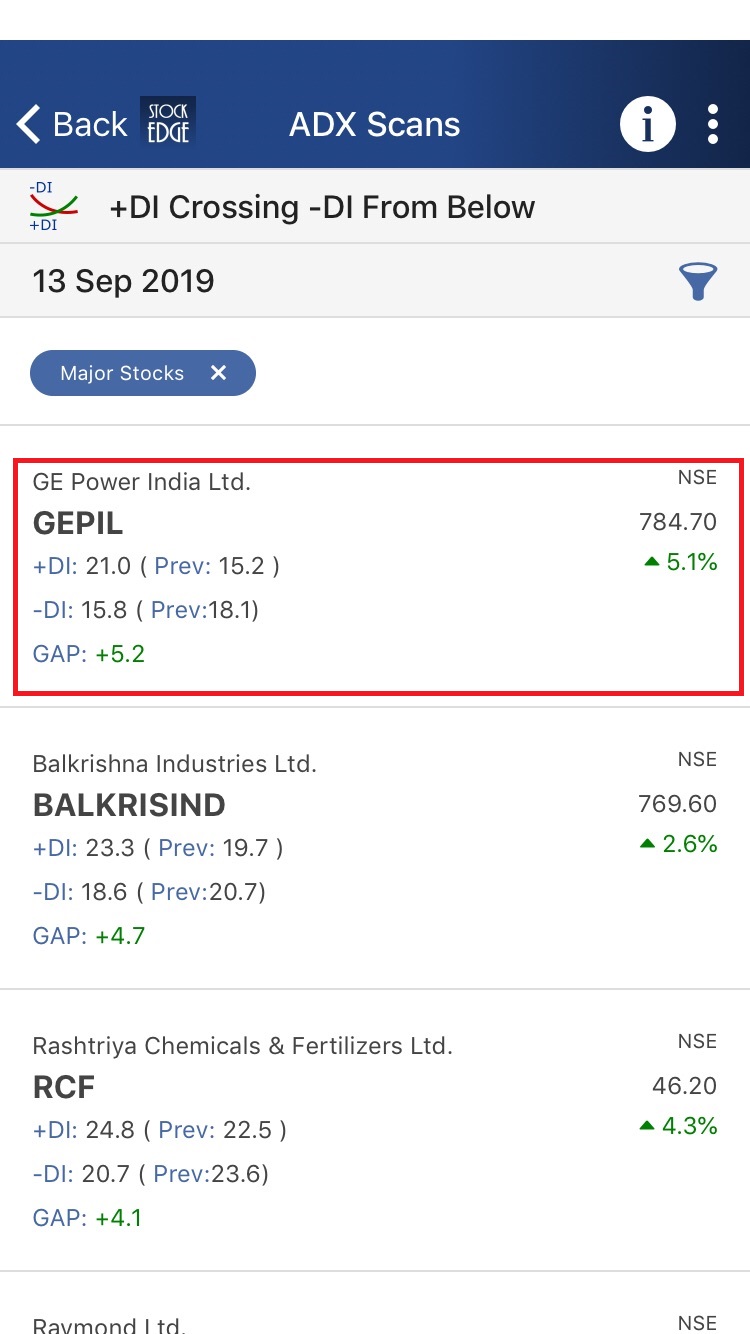
+ DI Crossing – DI from Below is a bullish scan which signifies probable beginning of an uptrend whereas + DI Crossing – DI from Above is a bearish scan which signifies probable beginning of a downtrend.
When we click on + DI Crossing – DI from Below scan, we get a list of stocks which fulfill this criterion:
Example 5: + DI Crossing 25 from Below and – DI Crossing 25 from Below:
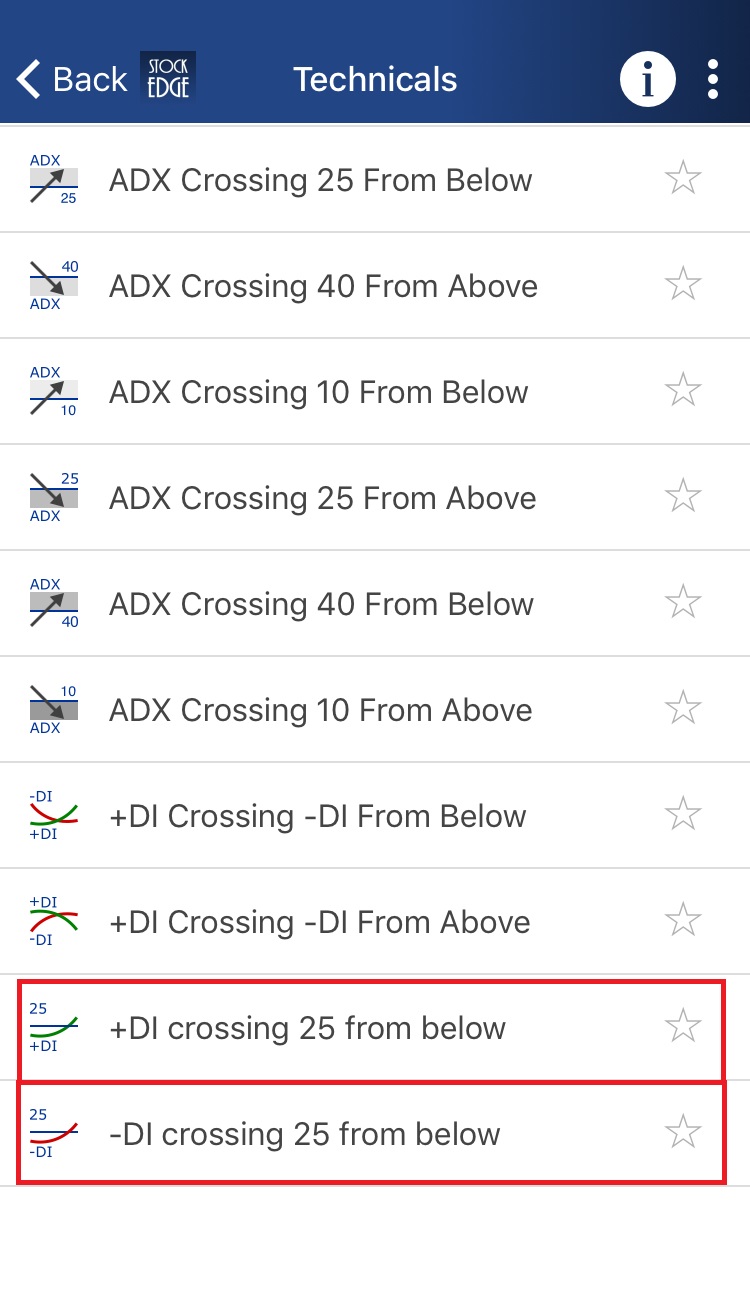
+ DI Crossing 25 from Below indicates that the stock has potential of continuing upward momentum whereas – DI Crossing 25 from Below indicates that the stock has potential of continuing downward momentum.
When we click on + DI Crossing 25 from Below scan, we get a list of stocks which fulfill this criterion:
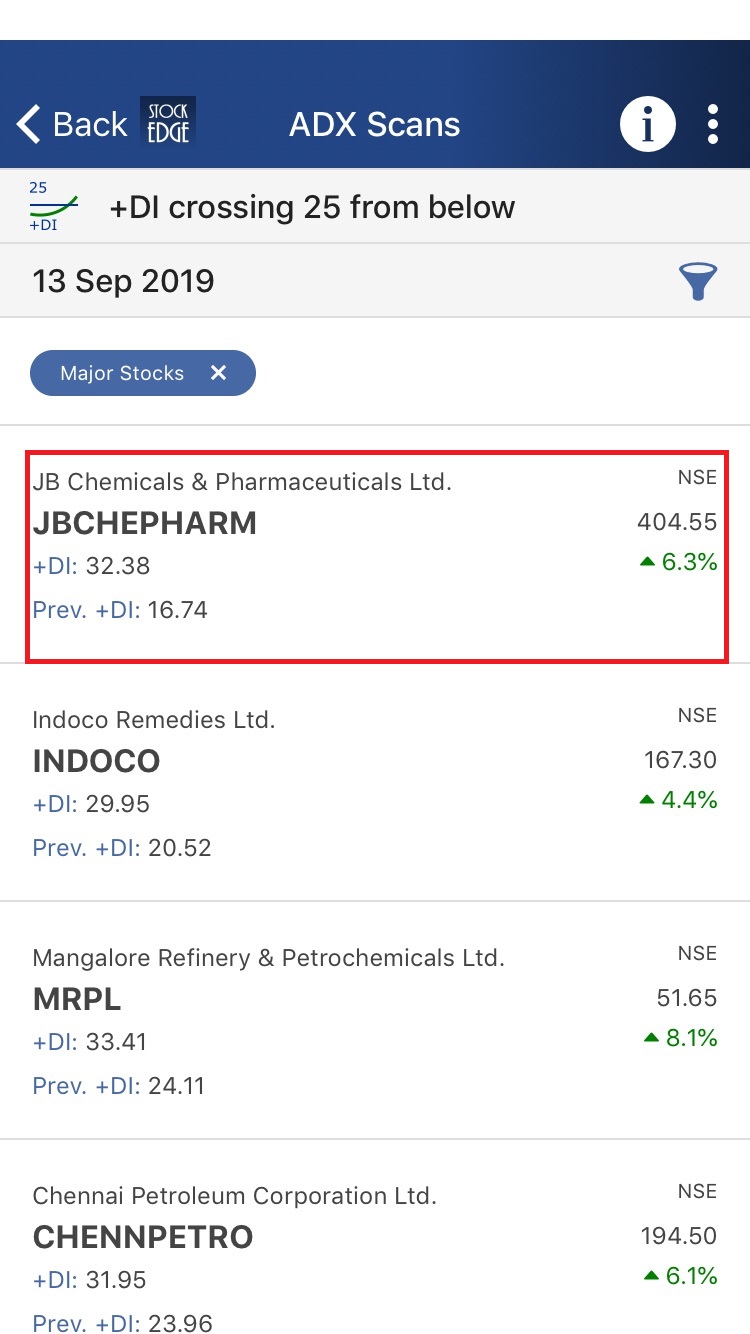
Above are examples of the ADX scans that generates buy and sell signals and also give us a list of the stock which fulfills the criteria of the scans for that particular day.
You can filter out the stocks and can trade accordingly using these scans.
Average Directional Index scans and Interactive charts are only available for paid subscribers. You can check out our subscriber plans from here.
To have a comprehensive idea of the Average Directional Index, click here.
Want to trade and invest with ADX? Avail the course:


