Table of Contents
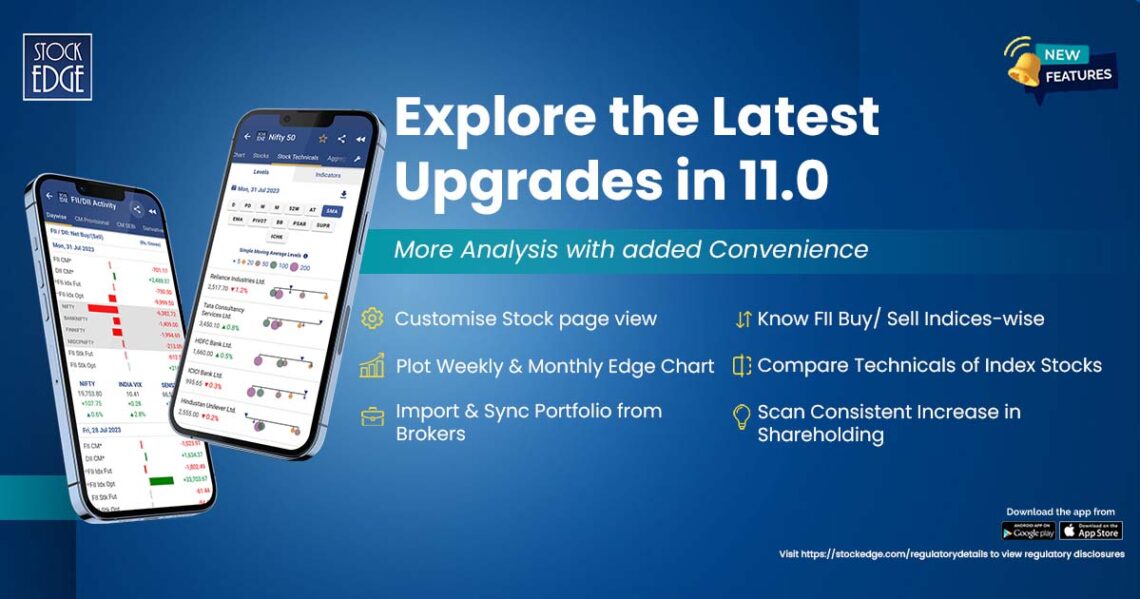
StockEdge is thrilled to announce its latest Version 11, packed with several new features and enhancements to elevate your stock market analysis and trading experience. Our mission is to empower traders and investors with the tools they need to make informed decisions, and this update is a significant step towards achieving that goal.
StockEdge has been a trusted companion for investors, both beginners and seasoned professionals alike, providing valuable insights, comprehensive market data, and intuitive tools to make informed decisions.
Now, with the advent of Version 11.0, we have taken a giant leap forward in delivering an unmatched experience that combines the prowess of artificial intelligence, advanced analytics, and a user-centric approach.
In this blog post, we will delve into the exciting new features and improvements that StockEdge Version 11.0 brings to the table. Let’s explore how this update will empower you to navigate the dynamic world of investing with greater precision, confidence, and profitability.
In this 11.0 release, we introduce the following most awaited features for our users:
- Weekly & Monthly Edge Chart
- Customise Securities Page View
- Index Stocks – Technical Peer Comparison
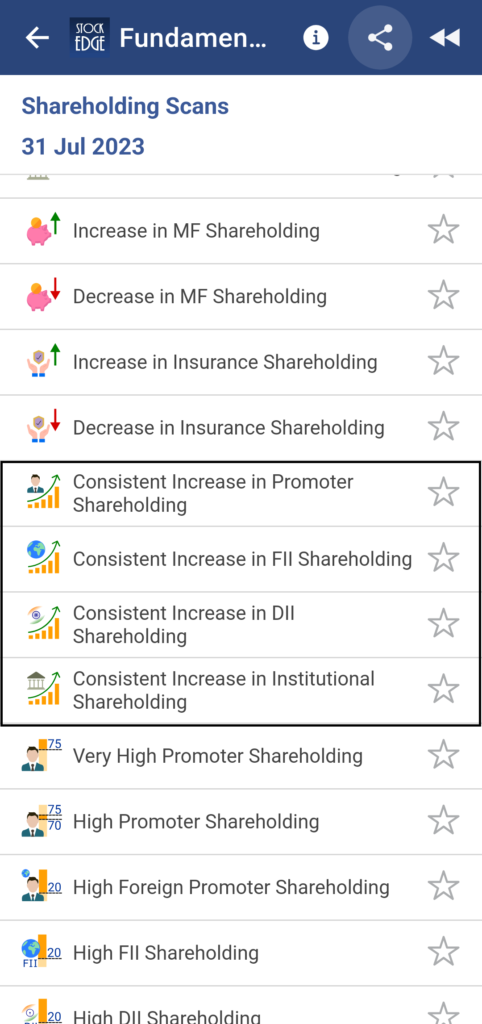
- 4 New Shareholding Scans
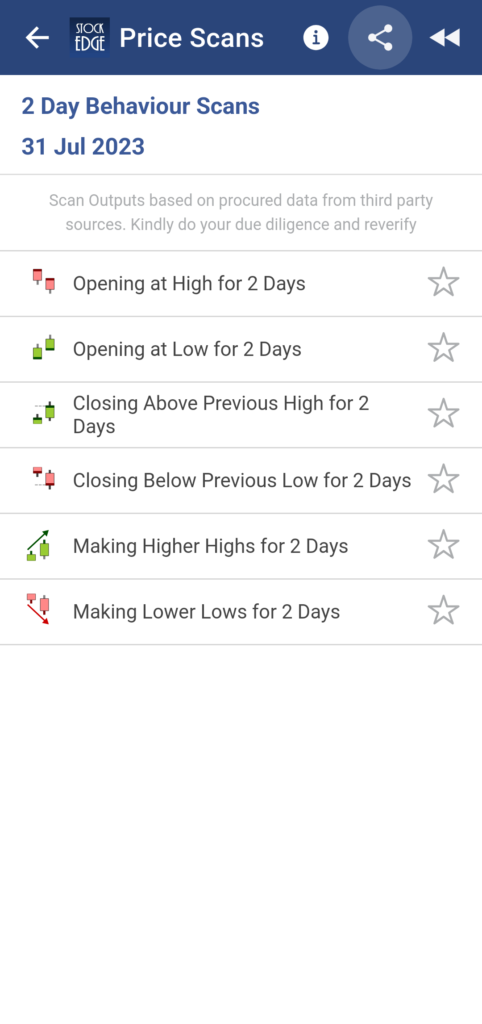
- 2 Day Behaviour Scans
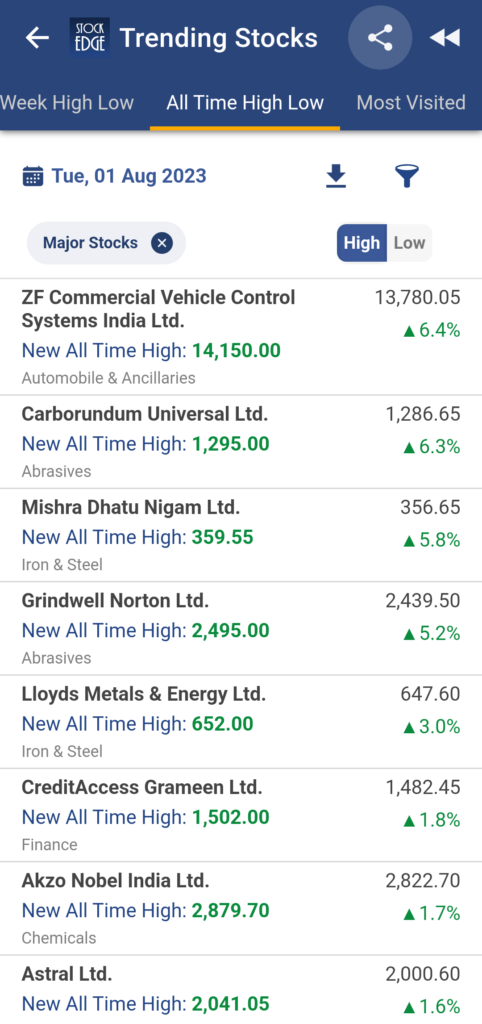
- Trending Stocks – All-Time High Low
- Import Portfolio directly from Brokers
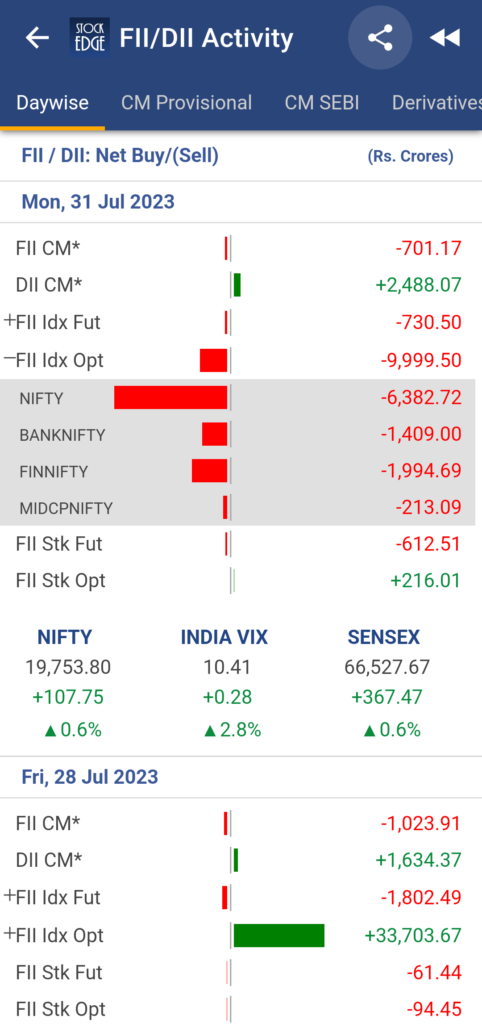
- Indices Wise Breakup in FII Derivative Statistics
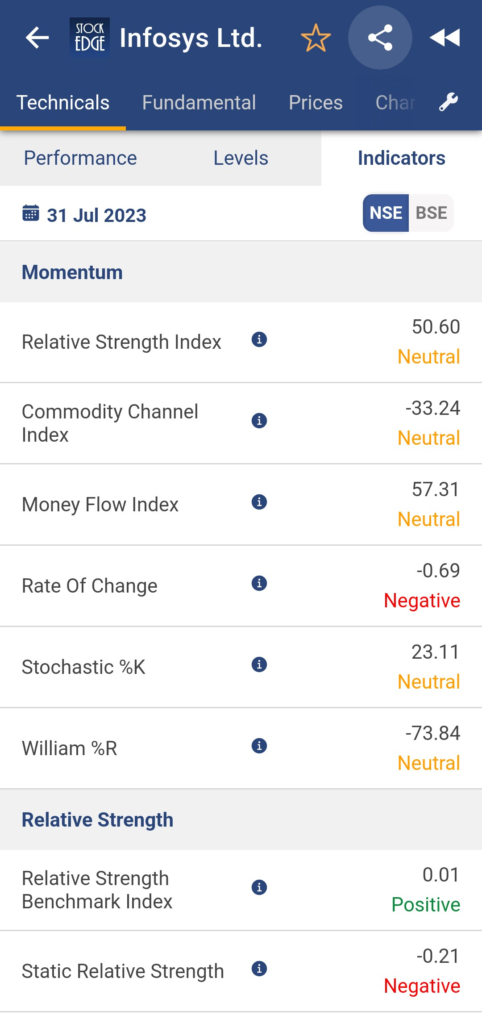
- Stock’s Technical Indicator Page – Revamped
- Google News Feed – Revamped
Continue reading for a more detailed study of the above-mentioned features:
Weekly & Monthly Edge Chart
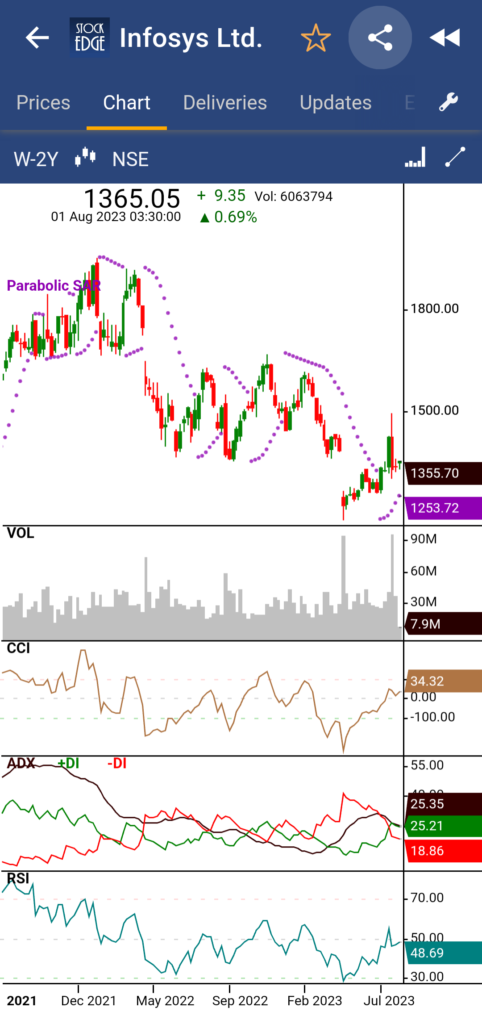
Stay ahead of the curve with our new Weekly & Monthly Edge Chart feature. Now, in addition to daily charts, you can visualize trends and patterns over weekly and monthly periods, allowing you to spot long-term insights and make more strategic decisions. You can plot the desired technical and fundamental indicators on the weekly and monthly edge charts to further enhance your edge. Also, StockEdge has introduced a 10Year timeframe for weekly and monthly charts.
Customize Securities Page View
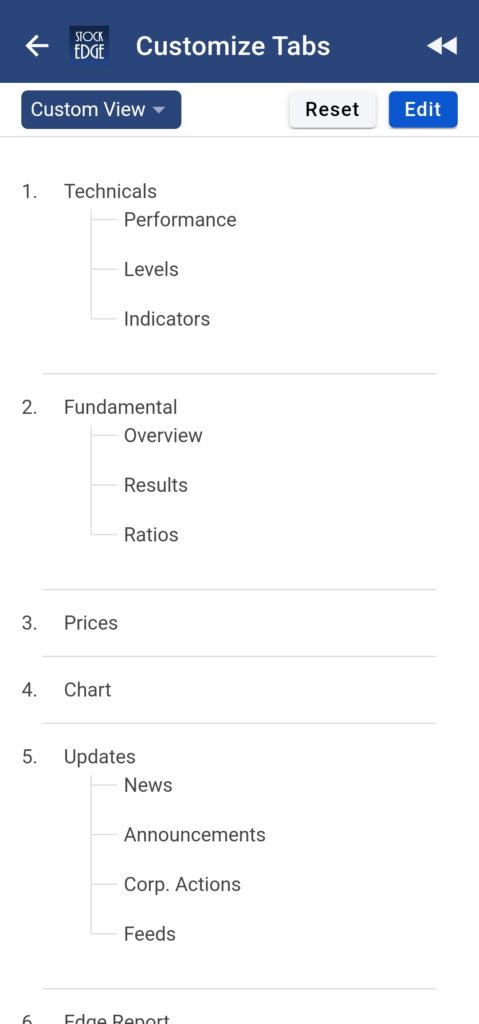
Tailor your experience to your preferences with the Customise Securities Page View feature. You can now personalize the way securities are displayed, arranging them according to your priorities and optimizing your workflow.
Index Stocks – Technical Peer Comparison
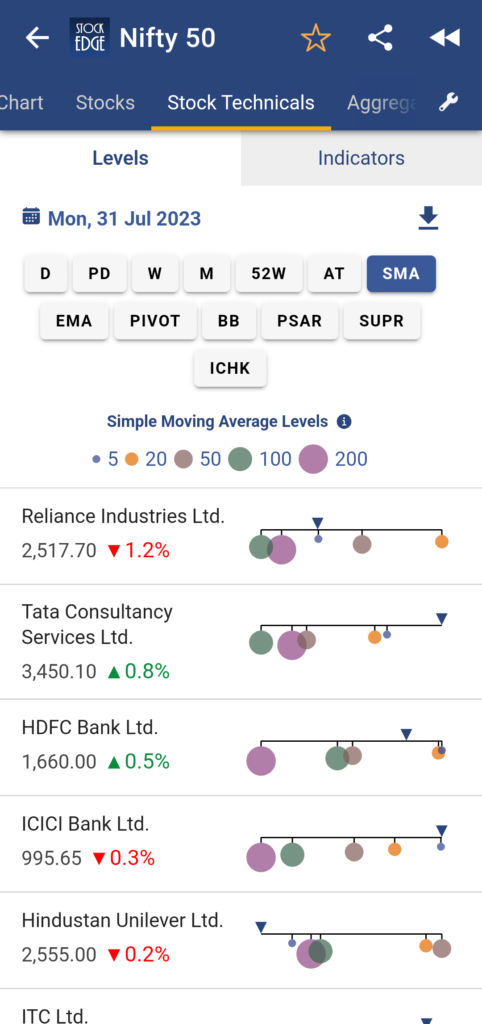
Analyzing index stocks just got easier with the Technical Peer Comparison feature. Compare the technical performance of index stocks within a specific index say Nifty 50, helping you identify potential outliers and trends.
Four New Shareholding Scans
Dive deep into shareholding patterns with our Four New Shareholding Scans. These scans provide you with detailed insights into consistent activity of increasing ownership by the major impact shareholders: Promoters, FII, DII and Institution, enabling you to make more informed investment decisions. The four new shareholding scans are:
- Consistent Increase in Promoter Shareholding
- Consistent Increase in FII Shareholding
- Consistent Increase in DII Shareholding
- Consistent Increase in Institution Shareholding
Two-Day Behaviour Scans
Stay attuned to short-term market behaviour using the Two-Day Behaviour Scans. Identify stocks that have displayed notable price and volume movements over the past two days, giving you a timely edge in your trading strategies. The 2 Day Behaviour Scans in Price Scans Category are:
- Opening at High for 2 Days
- Opening at Low for 2 Days
- Closing Above Previous High for 2 Days
- Closing Below Previous Low for 2 Days
- Making Higher Highs for 2 Days
- Making Lower Lows for 2 Days
Trending Stocks – All-Time High Low
Keep your finger on the pulse of market trends with the Trending Stocks – All-Time High Low feature. Quickly identify stocks that are hitting all-time highs or lows during intraday, allowing you to capitalize on emerging opportunities.
Import Portfolios Directly from Brokers
Simplify your portfolio tracking with the Import Portfolios feature. Now you can directly import your portfolios from supported brokers, streamlining your portfolio management process and ensuring accurate, up-to-date information.

Indices Wise Breakup in FII Derivative Statistics
Now track the FII activity statistics in the derivatives segment in a more detailed way via analysing the break up of FII investments based on different indexes.
Key Revamp of Some StockEdge Sections
We have revamped some of the key important sections as per the requests and feedback from our users which is of utmost importance to us. The sections that revamped for better user experience and analysis are
- Stock’s Technical Indicator Page
- Google News Feed
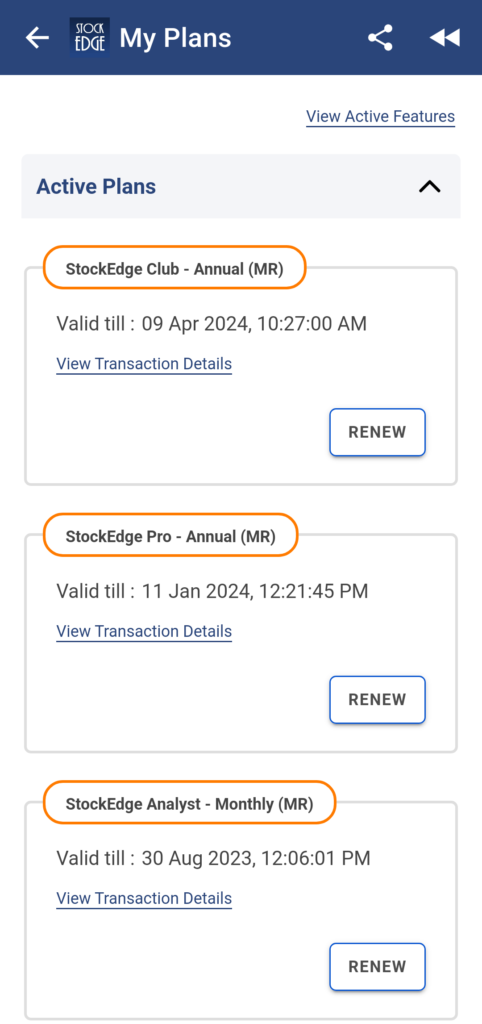
- My Plans Page

We’re excited to deliver these new features to you, and we believe they will significantly enhance your trading and investing journey. At StockEdge, we’re committed to continuous improvement and innovation, and this update is a testament to that commitment. Whether you are a seasoned trader or a beginner taking your first steps, StockEdge Version 11.0 is designed to enhance your investment journey and empower you to make better-informed decisions.
You can also, watch this video where Mr. Vivek Bajaj explained all the new features and its applications.
Thank you for choosing StockEdge as your go-to platform for market analysis and decision-making. We value your feedback, and if you have any suggestions or queries, please don’t hesitate to reach out to our support team.
If you enjoy using StockEdge, don’t hold back from sharing the platform with your near and dear ones.
Check out StockEdge’s Premium Plans to get the most out of it. Also, watch this space for our midweek and weekend editions of ‘Stock Insights‘.
Happy Investing and Trading with StockEdge Version 11.0!
-The StockEdge Team


