Table of Contents
StockEdge aims at continuously improving its platform and making the user experience seamless. Therefore, we at StockEdge keep introducing new features and modifying the existing ones at regular intervals. That being said, we are happy to release StockEdge Version 7.3 and believe that the new features will add significant value to users.
Premium Features include:
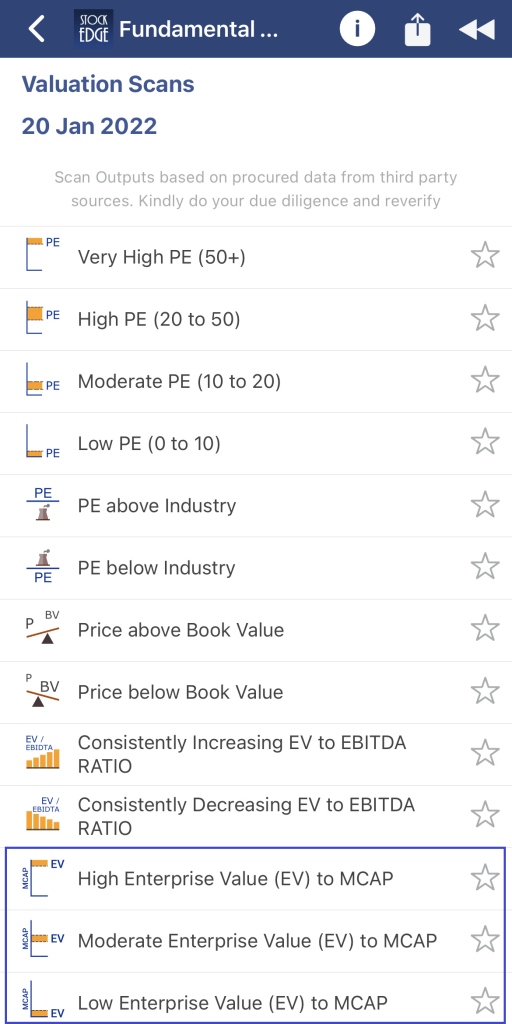
- Enterprise Value (EV) to Market Capitalisation Scan (MCAP)
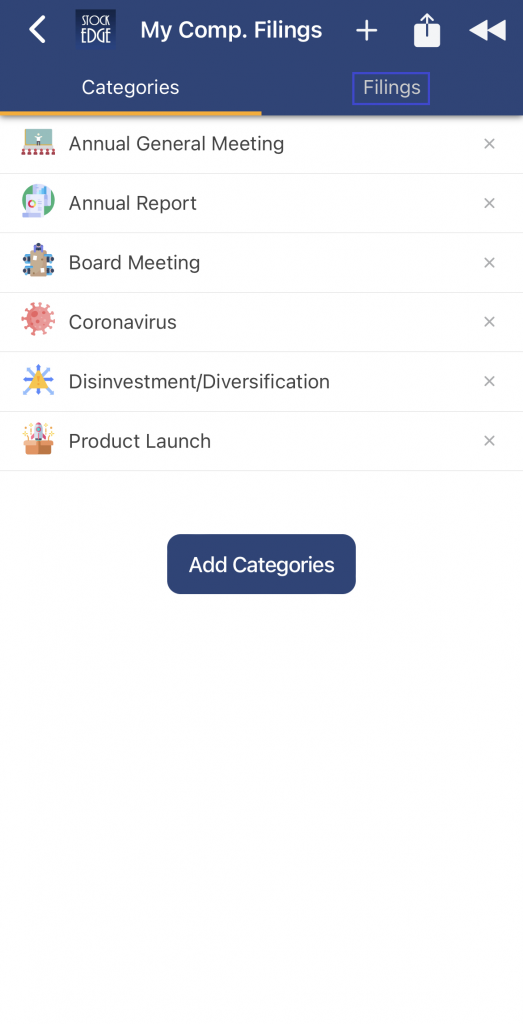
- My Company Filings Enhanced
Free Features include:
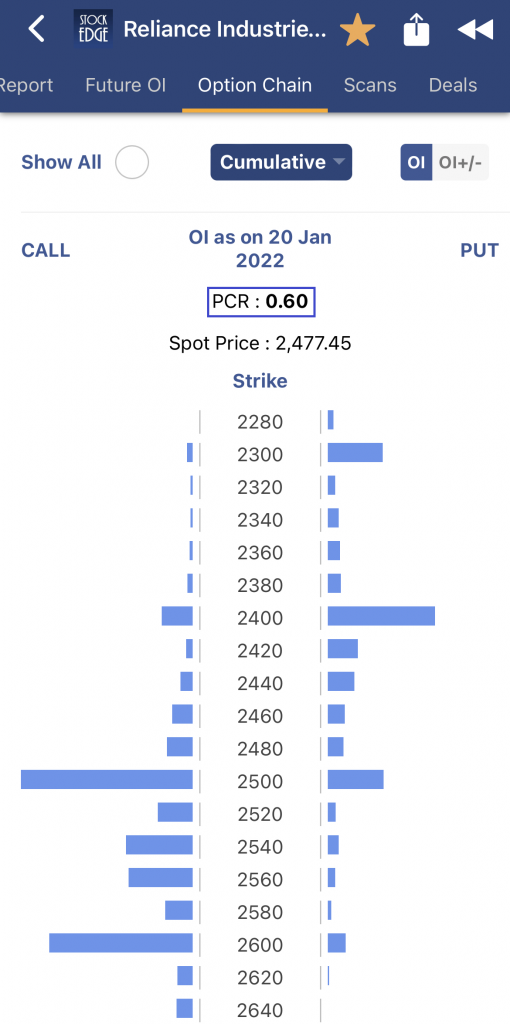
- PutCall Ratio in Stock Option Chain page
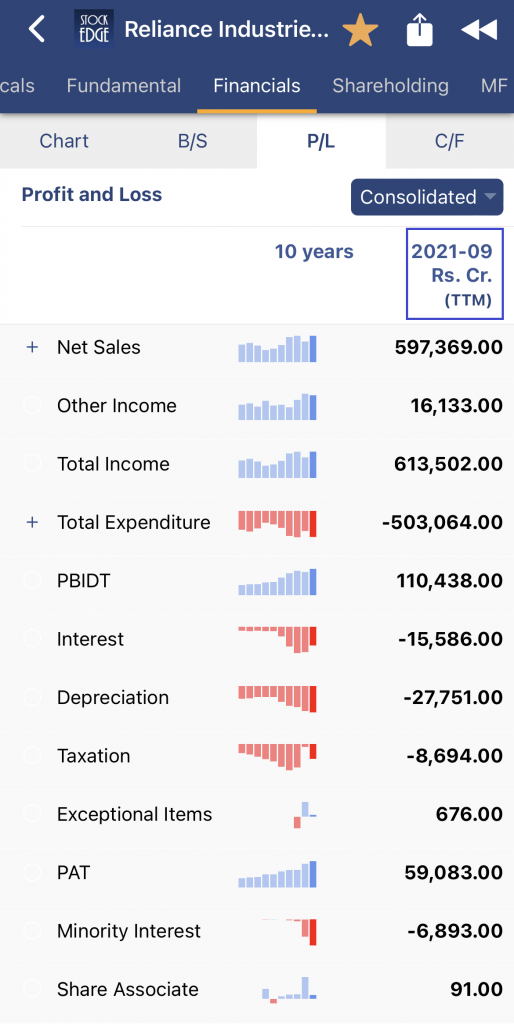
- Trailing Twelve Month (TTM) Profit/Loss
To know more about these new features, continue reading.
Enterprise Value (EV) to Market Capitalisation Scan (MCAP)
EV refers to the total value of the company. It includes market capitalization total debt and reduces cash and cash equivalents. Therefore, it is the amount needed to buy the company. In addition, three new scans have been introduced which compare EV to MCAP. These scans indicate whether a company is undervalued or overvalued. The scans that have been presented are:
- High Enterprise Value (EV) to MCAP
- Moderate Enterprise Value (EV) to MCAP
- Low Enterprise Value (EV) to MCAP
My Company Filings Modified
A new tab called Filings has been introduced in the “My Company Filings” section. With the introduction of this, users can now view all the filings of the categories marked by them as the favourite, in one place. User experience will be enhanced with this feature as they get all the filings relevant to them in one click.
PutCall Ratio (PCR)
PCR is a derivative indicator used to gauge the market’s overall sentiment. It is calculated by dividing the open interest in a put contract by the open interest in a call contract of a stock or an index on the same day.PCR is often viewed as a contrarian indicator by a few people. Users can now view the Cumulative PutCall Ratio (PCR) in the Option Chain page of FnO Stocks. With the introduction of this feature, users can make more informed decisions before investing.
Trailing Twelve Month Profit/Loss (TTM P/L)
TTM refers to the past 12 consecutive months (4 quarters) of a company’s financial data. These 12 months don’t necessarily have to coincide with the fiscal year ending period. StockEdge now displays quarterly TTM P/L on the “Financials” page under the P/L tab. Quarterly TTM is calculated by summing up the figures for the past consecutive 4 quarters. TTM helps market participants evaluate and value a company more accurately with the most recent data.
That’s all from Team StockEdge for now. We hope the new features make your investing journey impeccable. Let us know how you like these new features, and look out for another release soon.
Don’t hold back from sharing it with your near and dear ones if you enjoy using our platform.
Check out StockEdge’s Premium Plans to get the most out of it.
Also, keep watching this space for our midweek and weekend editions of ‘Trending Stocks‘ and ‘Stock Insights‘.


