StockEdge.com
  • Products
    • StockEdge Premium
    • StockEdge Pro
    • StockEdge Club
  • Stories
StockEdge Blog
  • Trending Stocks
  • Insights
  • Technical Analysis
  • Fundamental Analysis
  • StockEdge Tutorials
  • Mutual Fund
No Result
View All Result
  • Trending Stocks
  • Insights
  • Technical Analysis
  • Fundamental Analysis
  • StockEdge Tutorials
  • Mutual Fund
No Result
View All Result
StockEdge
Home Trending Stocks
A graphic image of a stock market trend with the company name “uflex ltd. ” and its logo. The background is a gradient of blue and gray.

Trending Stocks – Uflex Ltd.

StockEdge by StockEdge
November 22, 2023
Reading Time: 4 mins read
5.7k
VIEWS
Share on FacebookShare on XShare On WhatsApp
A candlestick chart showing stock prices of uflex ltd. From apr 2021to june 2021.

Among other trending stocks, check out the share trend of Uflex Ltd.

Uflex Ltd. – Highlights

  • The shares of Uflex Ltd. was trading at Rs.569.40, up by 19.3%, hitting a 52-week high of Rs.572.90 in today’s trading session.
  • The stock price has increased by 173.09% in last one year, while the benchmark index S&P BSE Sensex has increased by 50.31%.
  • The massive rally in the stock was after the company reported more than two-fold jump in consolidated net profit in the quarter ended on March 31, 2021.
  • “Although the quarter saw steep increases in raw material prices coupled with availability issues, we managed to deliver a strong performance to wrap up the year,” said Uflex Group CFO Rajesh Bhatia.
  • The company’s overall net profit increased by 163% year on year (YoY) to Rs 264.7 crore, owing to strong operational performance. Consolidated revenue increased 45% year on year to Rs 2,572 crore, while consolidated Ebitda increased 87% year on year to Rs 516.4 crore, and margins improved to 20.1% from 15.6% in Q4FY20.
  • The company said “We saw an increase in demand for packaging materials and ancillary businesses, as well as newer clients. In Q4FY21, the company’s total production volume increased by 33.7 percent year on year to 126,822 metric tonnes (MT), while total sales volume increased by 43.5 percent year on year to 136429 MT “.
  • For the fiscal year 2020-21, total production volume was 4,63,065 million tonnes, and total sales volume was 4,62,418 metric tonnes, representing annual increases of 21% and 21.5 percent, respectively.
  • Aside from that, Uflex has announced a capital expenditure (capex) of Rs 120 crore for a printing line and some associated equipment, in response to the growing demand for the company’s products (aseptic packaging). The aforementioned capex plan will be financed with both owned and borrowed funds.
  • In addition, the company announced the commissioning of a brownfield BOPP film line in Egypt with a capacity of 42,000 TPA. Going forward, the management expects higher volumes from the company’s newly established capacities in FY22 and will strive to maintain Ebitda margins of 20%.
  • Uflex Ltd. is the largest flexible packaging company in India and a rising global player. Over the last three decades, it has built an unblemished reputation and defined the contours of the packaging industry in India and around the world. It assists its customers in preserving freshness and extending the shelf life of food products as a leading name in packaging solutions.
  • Since its inception in 1985, it has grown into a multibillion-dollar company by focusing on customer trust, value creation, quality innovation, and customer satisfaction. UFlex has an unrivalled global reach and unhindered speed, making it truly multinational. It is headquartered in Noida (National Capital Region, New Delhi) and has state-of-the-art manufacturing facilities in India, the UAE, Mexico, Poland, Egypt, and the United States.

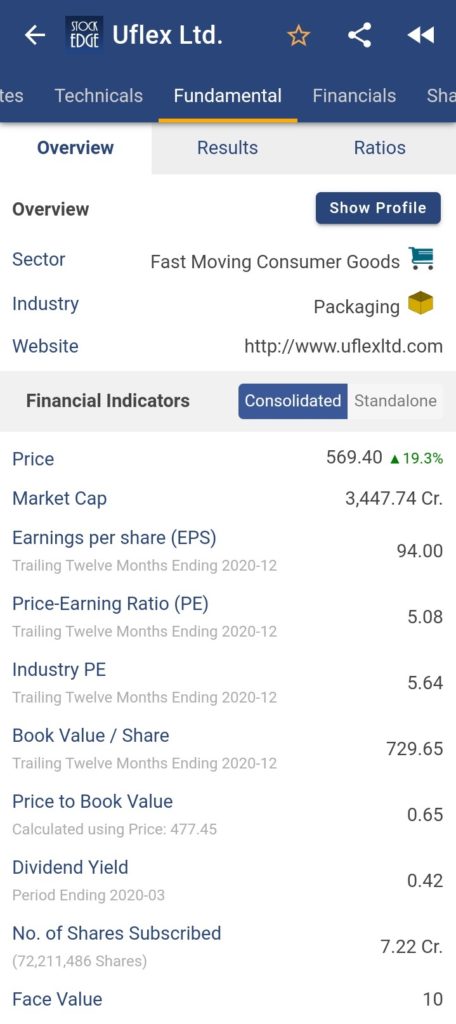
For more fundamental data and analysis, click on Uflex Ltd.

A snap of stockedge app showing fundamentals of uflex ltd. The page is divided into three sections: technicals, fundamentals, and financials. The technicals section has a chart with the stock price and other information. The fundamentals section has information about the company’s earnings, price-to-earnings ratio, and other financial metrics. The financials section has information about the company’s balance sheet, income statement, and cash flow.

Read our latest article on Laurus Labs Ltd. – A leading research-driven pharmaceutical company

To get more detailed analysis and Reports on Stocks, visit our Edge Report Section by subscribing to our StockEdge premium plans

Disclaimer: This document and the process of identifying the potential of a company has been produced for only learning purposes. Since equity involves individual judgments, this analysis should be used for only learning enhancements and cannot be considered to be a recommendation on any stock or sector.

Tags: Quarterly Resultstrending stocksUflex Ltd.
ShareTweetSend
Open A Zero Brokerage Account In Kotak Open A Zero Brokerage Account In Kotak Open A Zero Brokerage Account In Kotak
Previous Post

Trending Stocks – Bajaj Healthcare Ltd.

Next Post

Trending Stocks – Vodafone Idea Ltd.

StockEdge

StockEdge

StockEdge is a self-help Equity and Mutual Fund research tool. It empowers retail investors to identify investment opportunity with all the necessary data and analytics.

Next Post
A graphic representation of trending stock "vodafone idea ltd. " in a background gradient of green and blue.

Trending Stocks – Vodafone Idea Ltd.

A graphic representation of trending stock "route mobile ltd. " in a green background.

Trending Stocks – Route Mobile Ltd.

A yellow banner with the text "stock insights" and "borosil renewables ltd. " in white and blue lettering.

Borosil Renewables Ltd. - As Bright as the Sun

Disclaimer

StockEdge (Kredent InfoEdge Pvt. Ltd.) is a SEBI-registered Research Analyst (RA) entity (SEBI Registration No: INH300007493). The information provided in this article is for educational and informational purposes only and should not be considered as an offer to buy or sell any securities or investment products.

The stocks, securities, and investment instruments mentioned herein are not recommendations under SEBI (Research Analysts) Regulations, 2014. Readers are advised to conduct their own due diligence and seek independent financial advice before making any investment decisions.

Investments in securities markets are subject to market risks. Please read all related documents carefully before investing. Investing in Equity Shares,
Derivatives, Mutual Funds, or other instruments carry inherent risks, including potential loss of capital. StockEdge (Kredent InfoEdge Pvt. Ltd.) does not provide any guarantee or assurance of returns on any investments. Past performance is not indicative of future performance.

Contact Us
  • Timing (Mon-Sat): 10 am to 7 pm
  • Sales: +919830994463
  • Support: +919830994402
  • Club Support: +916289906895
  • Affiliate: +917003567131
Recent Posts
3 PSU Stocks in India - Blog Cover Image
Top 3 PSU Stocks in India
2 Ethanol Stocks in India
Top 2 Ethanol Stocks in India
Important Links
  • StockEdge.com
  • StockEdge Premium
  • StockEdge Pro
  • StockEdge Club
  • Compare Plans
An Initiative Of
Logo of KREDENT INFOEDGE with SEBI Registration no.

© 2025 Kredent InfoEdge Pvt Ltd.

Facebook-f Twitter Instagram Linkedin-in Youtube Pinterest-p Whatsapp Telegram

Get StockEdge App

No Result
View All Result
  • Home
  • Article Categories
    • Trending Stocks
    • Insights
    • Technical Analysis
    • Fundamental Analysis
    • StockEdge Tutorials
    • Mutual Fund
  • Stories
  • Products
    • StockEdge Premium
    • StockEdge Pro
    • StockEdge Club
  • Visit StockEdge.com

© 2024 Kredent InfoEdge Pvt Ltd.