Table of Contents
Before understanding Fama Ratio and using it to evaluate mutual funds, it is very important to understand what is CAPM (Capital Asset Pricing Model).
CAPM tells us the relationship between systematic risk and expected return for assets, particularly stocks.
Calculation:
The formula for calculating the expected return of an asset given its risk is as follows:
ER = Rf + B (Rm – Rf)
Where ER = expected return of investment
Rf = risk-free rate of return
B = beta of the investment
(Rm – Rf) = market risk premium
The assumption of a single risk factor, beta describes the inability of the CAPM. Fama and French started with the observation that two classes of stocks have tended to do better than the market as a whole:
- small caps and
- stocks with a high book-value-to-price ratio (customarily called “value” stocks). Then they added the two factors to CAPM to reflect a portfolio’s exposure to these two classes:
r – Rf = beta3 x ( Km – Rf ) + bs x SMB + bv x HML + alpha
where r = portfolio’s return rate,
Rf = risk-free return rate,
Km = return of the stock market.
SMB and HML stand for “small-cap minus big” and “high book/price minus low”; it measures the historic excess returns of small caps and “value” stocks over the market as a whole. By the way, SMB and HML are defined, the corresponding coefficients bs and bv take values on a scale of roughly 0 to 1: bs = 1 would be a small-cap portfolio, bs = 0 would be large-cap, bv = 1 would be a portfolio with a high book/price ratio, etc.
Fama and French with the help of this model highlighted that investors must be able to tackle the extra short-term volatility and periodic underperformance that can occur in a short time frame. Investors with a long-term horizon of 10 years or more will be rewarded for losses suffered in the short term. Fama and French tested their model using thousands of random portfolios and found that when size and value factors are combined with the beta factor, it could then explain as much as 90% of the return in a diversified stock portfolio.
The ability to explain 90% of a portfolio’s return compared to the market as a whole, investors can now construct a portfolio in which they receive an average expected return according to the relative risks they assume in their portfolios. The main factors driving expected returns are sensitivity to the market, sensitivity to size, and sensitivity to value stocks, as measured by the book-to-market ratio.
With this model, you can construct a portfolio where he/she can see the average expected return, all according to the relative risks assumed.
With more than 2500 schemes in India, selecting the right mutual fund to invest in can be a tough task, especially for people with no or little knowledge. These individuals can use tools like the Fama Ratio to evaluate or compare mutual funds.
How to find the Fama Ratios of different mutual funds in StockEdge?
You can find the Fama Ratios of different mutual funds easily online in our StockEdge application or the web version. StockEdge provides all the important tools and information for its users to analyze and invest in Indian mutual funds. Fama Ratio can act as a tool of evaluation, but it can’t be considered as the only parameter.
To analyze all the important factors of any mutual fund, one should use other measuring instruments as well. For that, all you need to do is just download the application, select the Mutual Fund tab, and explore.
- Click on the M.F tab on the home screen of the application.
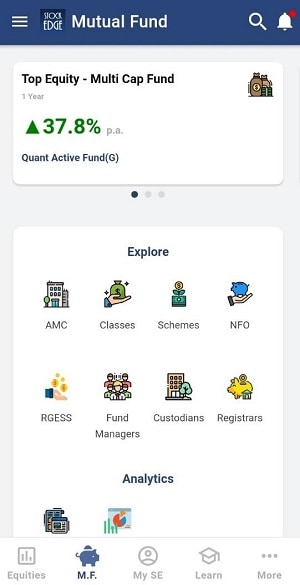
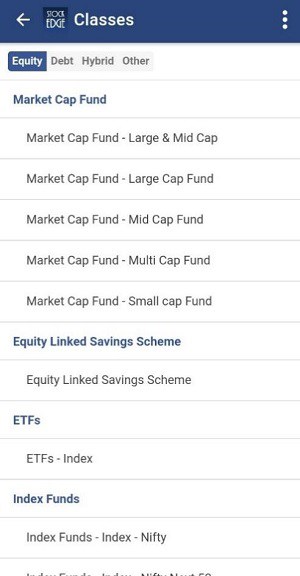
- Click on Classes and select the type (Equity, Debt, Hybrid, Others). For e.g.:- You select Equity and select “Market Cap Fund – Large & Mid Cap”.
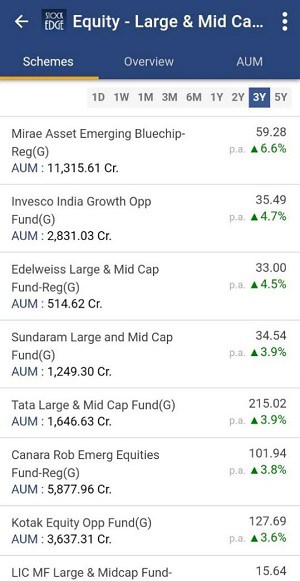
- Then you can select the different schemes and can compare their Fama Ratio like in the picture depicted below:-
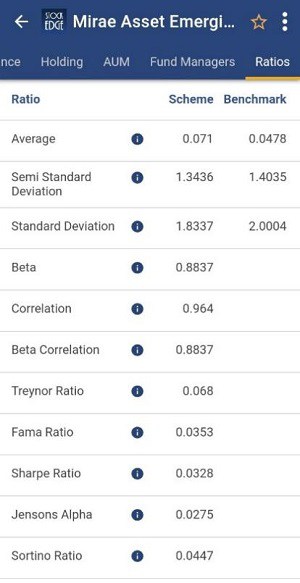
- Select the first fund and scroll towards the right to check the ratios section. Now you can compare the ratios with other funds and schemes and use this information along with other parameters. Also, you can check the holdings of the fund by clicking on the section.
Conclusion
So StockEdge is the only platform where you get filtered information, which helps in making your analysis faster, better, and easier within minutes. So what are you waiting for start using Stock and Mutual Fund Analytics today and become a profitable and smart trader cum investor.
Click here to know more about the offering of StockEdge Premium
You can check out the desktop version of StockEdge using this link https://web.stockedge.com/








How to find ratios of different similar class of mutual fund schemes in a single page. ?