Table of Contents
Things you should know before buying stocks.
Before buying stocks, we have to research a company thoroughly. We need to research about how the company has performed in the last few years and compare it with its peers and so on. We can analyze the stock based on both technical indicators and fundamental factors using the StockEdge app in just five minutes.
Suppose, we need to find out about a company before taking up the trade, StockEdge will give us full details about the company. You must be wondering how it is possible to get full information about the company in one click. This is what we will discuss in this article. Let us take an example of ITC Ltd.
Stocks Prices
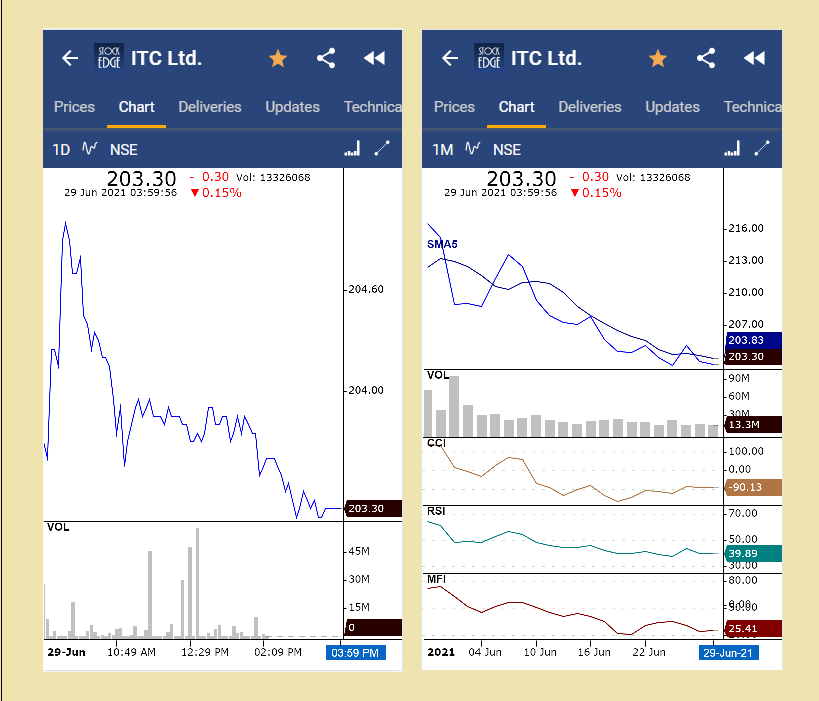
When we select the “stock” tab, a search panel will come. We can search for any company which is listed in NSE and BSE to get the information. Suppose we want to know about ITC Ltd, just type ITC, and click on the company’s name about which we want to know, the price panel will come.
We will see the daily chart of ITC Ltd. We have the option to change the time frame from monthly, quarterly, one year, 2 years and 5 years. Both BSE and NSE price charts are available, we can choose between NSE and BSE charts.
When we choose the monthly chart, we have the options to put technical indicators in the charts (however, this is possible in case of paid version). We can select up to 4 technical indicators. In the picture below I have chosen Simple Moving Average (5 periods), Relative Strength Index, Commodity Channel Index and Money Flow Index. We also have the option to draw the trend line on the chart.
Stocks Deliveries
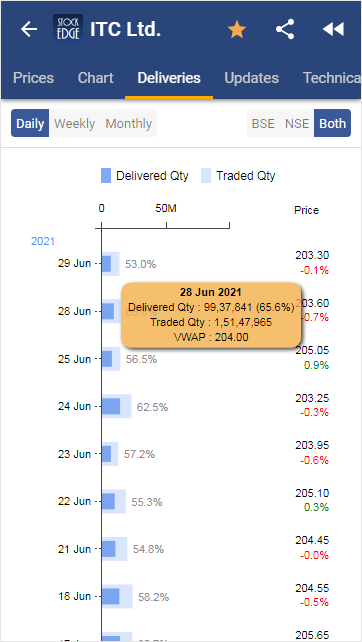
When we look at the company ’s chart, delivered and traded quantity are the two important parameters to be analyzed. Stock Edge not only provides us with only NSE or BSE traded and delivered quantity and VWAP but also provides us with the average traded and delivered quantity of both the indexes. It is very rare to find this feature in other financial applications. StockEdge has also incorporated Weekly and Monthly Volume & Delivery with all the same features and indicators of daily volume and delivery to enhance and strengthen the analysis to next level.
Stocks Technicals
Let us move on to technical panel. The technical panel has three tabs:-
- Performance
- Levels
- Indicators
Stocks Performance
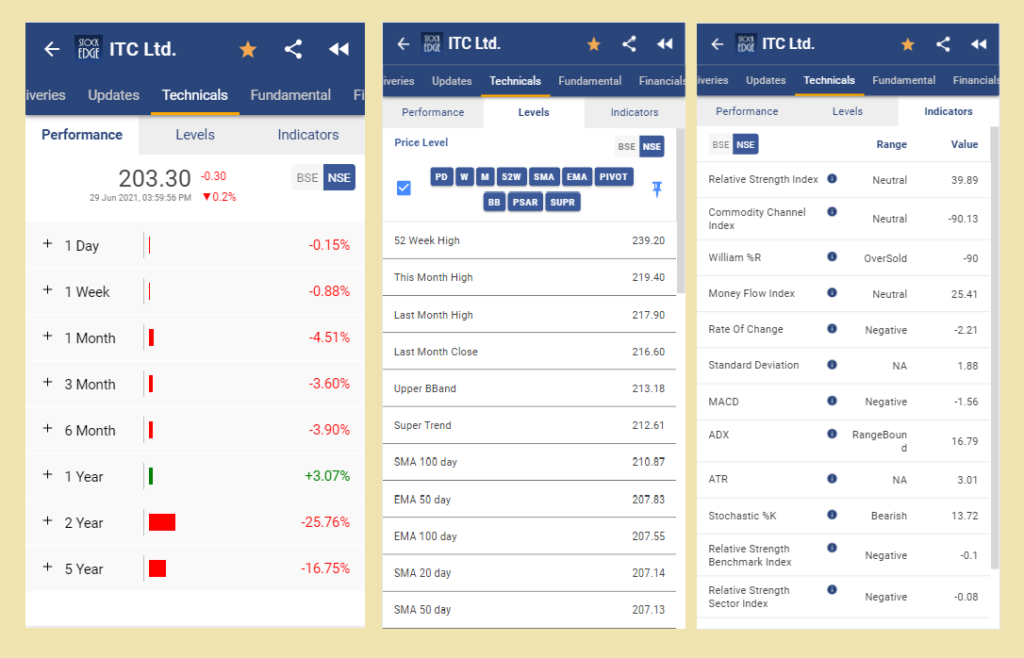
The performance screen tells us about how the company has performed over the years (upto 5 years). We can also track the performance in multiple time frames such as weekly, monthly, quarterly, and yearly of both NSE and BSE. The data is presented so well that by looking at it we can say that in which year the company has performed its best.
Stocks Levels
This section gives us information about different price levels of the stock in weekly, monthly and yearly time frames like the previous day close, day high, day low, LTP, previous day open and low.
It also gives us a different time period of Simple Moving Average (SMA) and Exponential Moving Average (EMA) like 20, 50, 100 and 200 periods. It also gives us different support and resistance pivot levels which are very important for any technical analyst.
Stocks Indicators
StockEdge consists of many different types of technical indicators. In this screen we will get different kinds of technical indicators such as Relative Strength Index, Commodity Channel Index, William % R, ADX, ATX, MACD etc. There is an “i” icon which tells us about the meaning of that particular indicator. We can also get to know about the range whether the stock is neutral, negative, positive, oversold or overbought and also the value of the indicator.
Stocks Fundamental
StockEdge is known for its data presentation. The fundamental section consists of the Overview, Results and Ratio panels. Let us discuss each of this in detail.
Overview
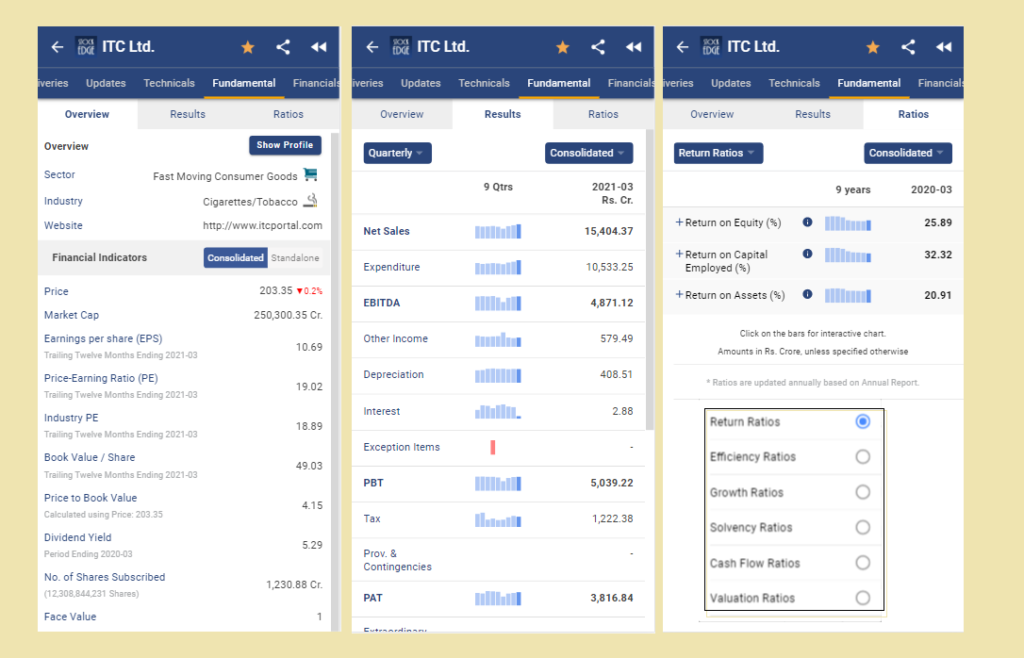
When we open the Fundamental panel, we will get the fundamental overview of ITC Ltd. or any stock. The overview section tells us about which sector and industry the company belongs to. It also tells us about the major financial indicators such as Earning Per Share (EPS), Price Earnings Ratio (PE), Industry PE and so on both consolidated and standalone basis.
Results
The Results panel consist of the Quarterly, Half yearly & Annual results of the company, both consolidated and standalone. It is not possible for us to remember the results of all the NSE and BSE listed companies and of all the quarters. Therefore, StockEdge helps us in viewing the results and also comparing the results with its past quarters. We can get the idea of the company in which we are investing is whether growing or not.
Ratios
Ratio Analysis is the key parameter of Fundamental Analysis. It helps us to understand the performance and efficiency over the years and also shows the comparison with its peers. The fundamental section of StockEdge consists of many ratios like the Return ratios, Efficiency ratios, Growth ratios, Solvency ratios, Cash Flow Ratios and valuation ratios of the last five years both consolidated and standalone. It does not only tell the value but also explains what ratio implies.
Financials
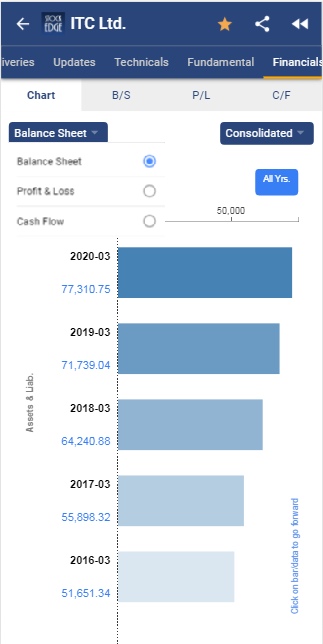
StockEdge gives us financial information about the balance sheet, profit and loss and cash flow of the company both standalone and consolidated. When you click on the bars, you will also get a further classification of that particular financial parameter. Isn’t that great!
Shareholding
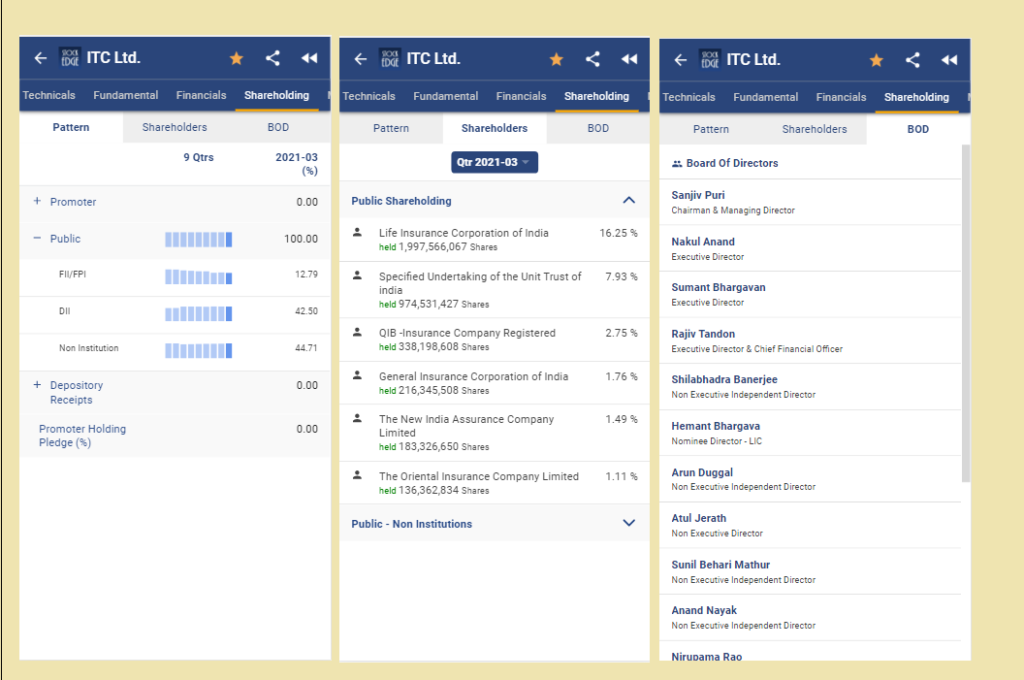
The shareholding panel of StockEdge consists of the pattern and shareholders. When we do an analysis of the company it is important to analyze the shareholding pattern. In the shareholding pattern, StockEdge gives us how much percent of the promoter and public shareholders make up the shareholding pattern of the company of the present and last quarters.
The shareholder’s screen consists of the Promoter, Public, Institutional and Non-institutional shareholder. It is important to know which mutual funds are holding the shares ITC Ltd. or any other company while doing fundamental analysis.
Future OI
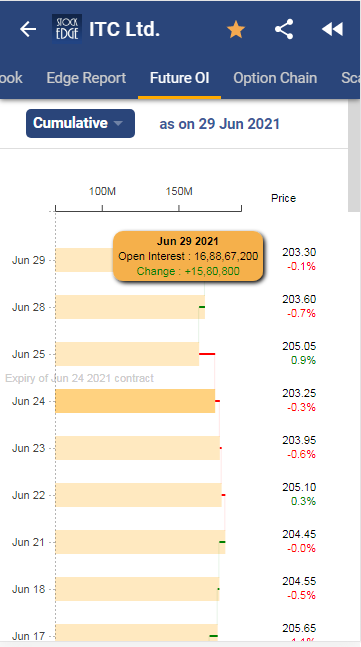
If you deal in futures & options, then you must be knowing how important it is to study the open interest in the market. StockEdge does not only give the present, near and far months OI data, it also gives the cumulative OI data which you will not find in other financial applications.
Option Chain
StockEdge gives us the strike prices of Call and Put options of the present, near and far months. This data is presented so well that with a glance of it, we will get to know which strike price has the greatest OI.
Scans
StockEdge provides us with technical, fundamental and combination scans. We can filter out stocks using these scans. Let us discuss how:-
Technical Scans
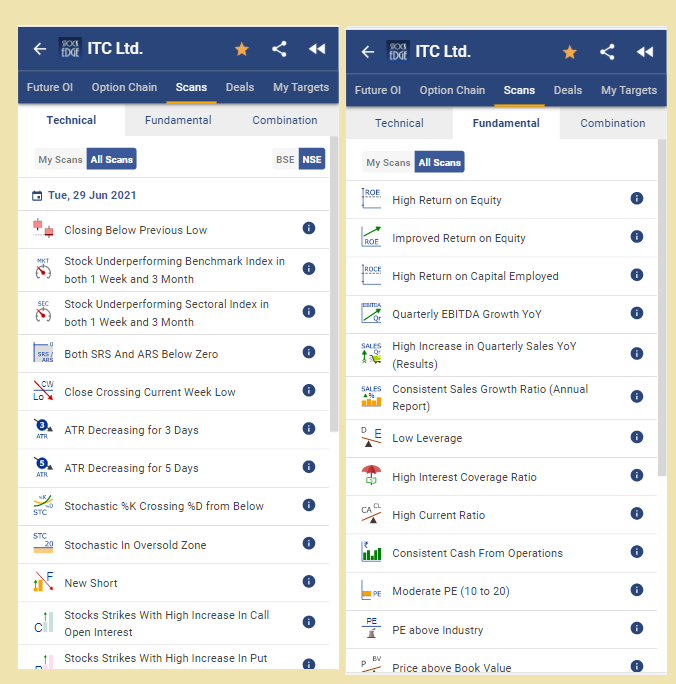
StockEdge provides us with technical scans. It consists of a number of technical scans such as Money Flow Index (MFI), Relative Strength Index (RSI), Simple Moving Average and Exponential Moving Average etc. When we click on this tab, it will provide what technical indicators are saying about a stock on daily basis.
Fundamental Scans
Same goes for the fundamental scans. When we click the fundamental scans tab in the StockEdge, it gives us which fundamental parameter does the stock fulfill on a given day.
Combination Scans
StockEdge has come up with this new feature, Combination Scans. In this, we can combine fundamental and technical scans according to our wish and filter out the stocks for trading. This is a paid feature and it is available when you become a paid member of the StockEdge.
Deals
We are always interested to know what the major institutions are doing in the form of bulk or block deals or is there insider buying or selling happening. We can easily know all these data from StockEdge. We also get to know the name of mutual funds and individuals who are placing the bulk or block deals or doing insider trading.
Updates
The update panel in the StockEdge provides us with the daily news, announcements, corporate actions and feed of ITC Ltd. or any other stock.
News
The news screen provides us with the daily news of the company in a few words so that we can quickly read them and focus more on the research and its subsequent impact on the market. It also helps us to trade accordingly.
Announcements
The announcement screen provides us with the daily announcement of the company like notice of the annual general meeting, announcement under any regulation related to both NSE and BSE.
Corporate Actions
StockEdge helps to track the corporate actions taken by ITC Ltd. or any other stock about which you want to know. We can track down the Ex-Date and Record-Date of dividends and bonuses announced by the company.
Feeds
This feature of StockEdge is powered by Google News Feeds. You will get all the news feeds about the company from Google in this screen
My Targets
Last but not the least; you can set the target for the stock. When the target is met, you will be able to see that in achieved targets tab in StockEdge
To know more you can watch the video below:
Bottomline
You must be wondering that how can we use so many features that we have discussed above in five minutes? This what makes StockEdge unique. You can get the end to end information about any stock which is listed in NSE or BSE in just five minutes. The data is presented in such a way that we can make trading decisions in just five minutes.


