Table of Contents

What is Treynor Ratio?
The Treynor ratio is a powerful tool that investors use to evaluate the performance of mutual funds. This ratio was first introduced by Jack Treynor in 1965 and has since become an industry standard for measuring the excess return per unit of market risk.
The market risk of a fund is measured by beta, which is a measure of the fund’s sensitivity to the fluctuations of the broader market. Beta consists of systematic risk, which is the risk that cannot be diversified away by investing in a diversified portfolio. This means that the Treynor ratio is best used for funds that are fully diversified and have zero or negligible unsystematic risk.
The Treynor ratio is calculated by dividing the excess return of the fund over the risk-free rate by its beta. The risk-free rate is typically the return on a 90-day treasury bill or a G-Sec. By comparing the Treynor ratio of different funds, investors can determine which funds are generating higher returns for a given level of risk.
The Treynor ratio is also known as the reward-to-volatility ratio. This is because it measures the excess return per unit of market risk. The higher the ratio, the better the fund is performing relative to its level of risk. A high Treynor ratio indicates that the fund is generating a high return for a given level of market risk.
Treynor Ratio Formula
Treynor Ratio = (Portfolio Return – Risk Free Return)/Beta of a fund
Treynor Ratio is used to compare different Mutual fund Schemes on risk-adjusted parameters. While comparing the mutual fund schemes we should keep in mind that the funds should have the same attributes or features. Funds with a higher Treynor ratio will produce a better risk-adjusted return.
Let’s consider an example:-
| Fund A | Fund B | |
| Portfolio Return | 13% | 16% |
| Risk free return | 6% | 6% |
| Beta | 0.9 | 1.5 |
| Treynor Ratio | (13%-6%)/0.9 = 7.78 | (16%-6%)/1.5 = 6.67 |
| Better Risk-adjusted return |
It can be observed that Fund A has a better risk-adjusted return. Although Fund B seems to be a better choice based on the return, higher returns are due to the high risk taken by that fund.
Treynor ratio v/s Sharpe ratio
Sharpe Ratio is a metric, similar to the Treynor ratio, used to analyze the performance of different portfolios, taking into account the risk involved. The equation for calculating Treynor Ratio is similar to the method of Sharpe Ratio for assessing the risk and volatility in the market with just one exception.
The main difference between the Sharpe ratio and the Treynor ratio is that the Treynor Ratio uses the systematic risk (beta), while the Sharpe ratio uses the total risk or the standard deviation.
The Sharpe ratio tells us how well a portfolio performs in comparison to a risk-free investment. First, we calculate the expected or the real return on investment for an investment portfolio, then subtract the risk-free investment’s return on investment, and then divides that result by the standard deviation of the investment portfolio or fund.
Treynor ratio can only be applied to well-diversified portfolios whereas Sharpe Ratio can be applied to all kinds of portfolios.
Limitations of Treynor Ratio
Treynor ratio gives importance to how the portfolios behaved in the past. It might happen the fund manager makes some changes in the mutual fund, in that case, the portfolio return and the beta of the fund will change and the portfolio can behave differently in the future considering new changes.
For example, if a fund has been delivering a 15% rate of return for the past several years at an average, it can’t be guaranteed that it will keep on doing the same thing in the upcoming years as well. This is something that the Treynor ratio does not consider.
Higher the Treynor ratio of a portfolio the better is its performance. A higher ratio signifies a portfolio is a more suitable investment. You should check the Treynor ratio of the fund when selecting the mutual fund before investing.
With as many as 44 registered fund houses and 2500 active schemes in India, selecting the right mutual fund to invest can be a tough and challenging task, especially for people with no or little knowledge. These individuals can use tools like the Treynor Ratio to evaluate or compare mutual funds. You can find the Treynor Ratios of different mutual funds easily online in our StockEdge application or the web version.
See also: 5 Steps to analyze Mutual Funds for better Investments
StockEdge provides all the important tools and information for its users to analyze and invest in Indian mutual funds. To analyze all the influencing factors of any mutual fund, one should use other measuring instruments as well. For that, all you need to do is just download the application, select the Mutual Fund tab, and explore. Steps to be followed:
- Click on the M.F tab on the home screen of the application.

- Click on Classes and select the type (Equity, Debt, Hybrid, Others). For e.g.:- You select Equity and select “Market Cap Fund – Large & Mid Cap”.
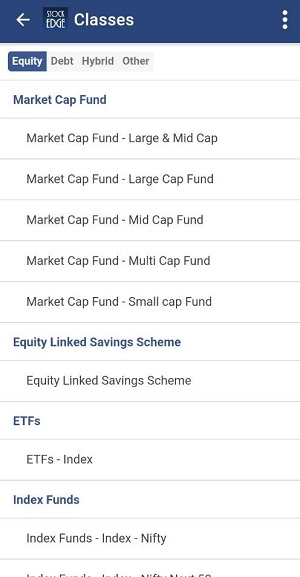
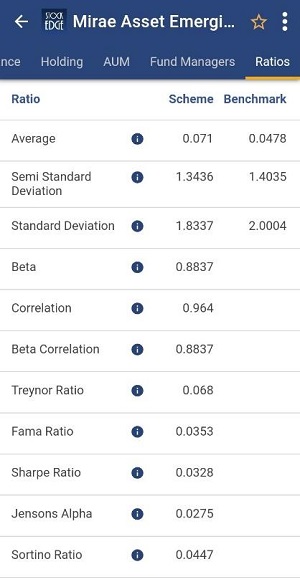
- Select the different schemes and can compare their Treynor Ratio like in the picture depicted below:-

- Select the first fund and scroll towards the right to check the ratios section. Now you can compare the ratios with other funds and schemes and use this information along with other parameters. Also, you can check the holdings of the fund by clicking on the section.
Avail the course on Elearnmarkets : Mutual Funds Made Easy.
Conclusion
So StockEdge is the only platform where you get filtered information, which helps in making your analysis faster, better and easier within minutes. So what are you waiting for, start using Stock and Mutual Fund Analytics today and become a profitable and smart trader cum investor? These are part of the premium offerings of StockEdge app.
Click here to know more about the offering of StockEdge Premium
You can check out the desktop version of StockEdge
Also give a read on:






Thanks for such useful learning