Table of Contents
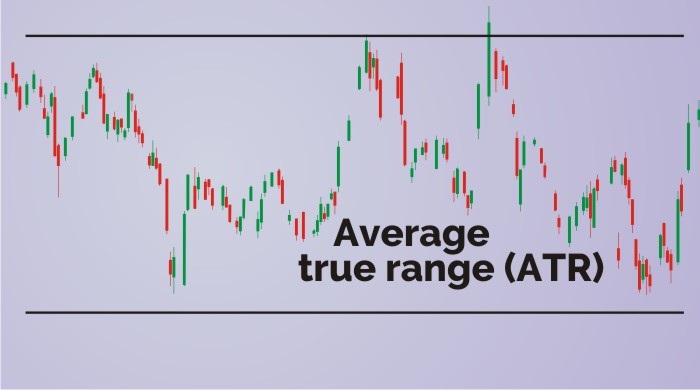
Average True Range (ATR) is a type of technical analysis indicator which measures market volatility.
ATR is a measure of volatility introduced by market technician J. Welles Wilder Jr. in his book, “New Concepts in Technical Trading Systems.”
Average true range (ATR) is a volatility indicator that shows how much an asset moves, on average, during a given time frame. The indicator can help day traders confirm when they might want to initiate a trade, and it can be used to determine the placement of a stop loss.
What is Average True Range (ATR)?
Average True Range (ATR) is based on 14 periods and can be calculated on an intraday, daily, weekly or monthly basis. The first TR value is simply the High minus the Low, and the first 14-day ATR is the average of the daily TR values for the last 14 days.
ATR can be used to validate the enthusiasm behind a move or breakout. A bullish reversal with an increase in ATR would show strong buying pressure and reinforce the reversal. A bearish support break with an increase in ATR would show strong selling pressure and reinforce the support break.
For measuring the recent volatility one can use a shorter average like 2 – 10 periods. For longer volatility, one can use 20- 50 periods.
Average True Range Formula:
Current ATR = [(Prior ATR x 13) + Current TR] / 14
– Multiply the previous 14-day ATR by 13.
– Add the most recent day’s TR value.
– Divide the total by 14
To know more about Average True Range, watch the video below on StockEdge ATR Stock Scan Tutorial:
Using Average True Range in StockEdge App:
We have discussed about the basics of ATR, now let us discuss how to use this technical indicator to filter out stocks for trading:
See also: Narrow Range Scan
In StockEdge there are many Average True Range scans available for filtering out stocks for trading and enhancing the user’s research and analytics skillset :
Let us discuss a few of these scans:
Example 1: ATR Increasing for 3 days and ATR Decreasing for 3 days:
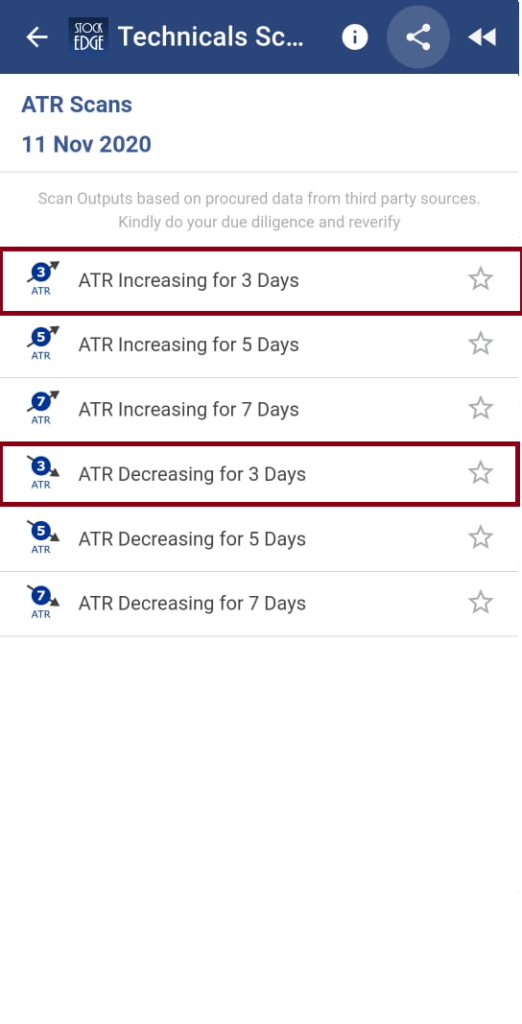
ATR Increasing for 3 days indicates that the stock is creating higher ATR for the last 3 days whereas ATR Decreasing for 3 days indicates that the stock is creating lower ATR for the last 3 days.
When we click on ATR Increasing for 3 days, we get a list of stocks which fulfill this criterion:
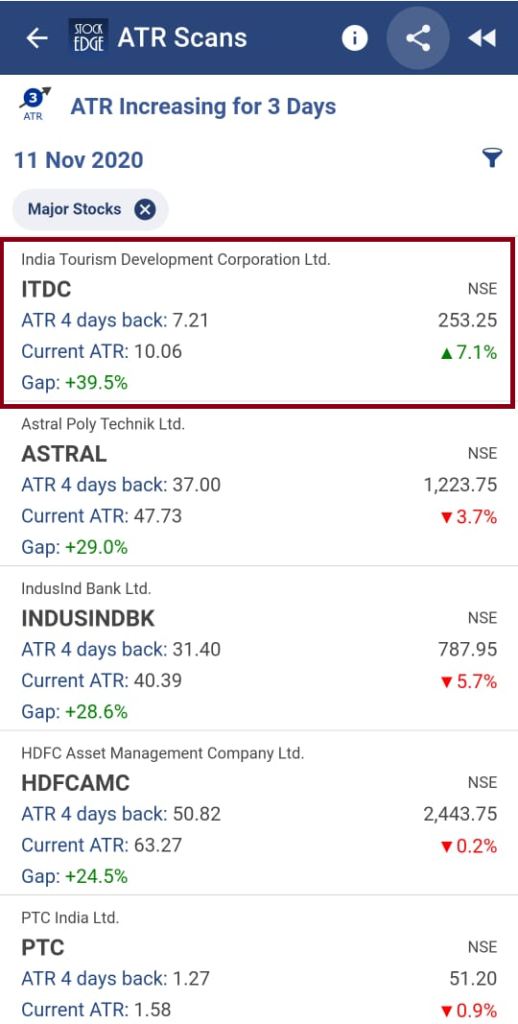
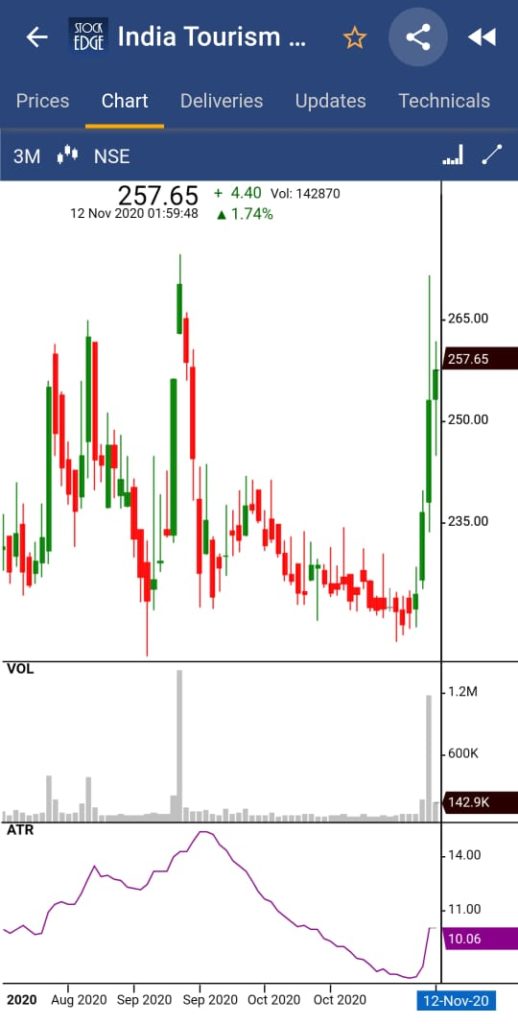
After clicking on ITDC Ltd, we get a technical chart with ATR plotted in the sub-graph:
Example 2: ATR Increasing for 5 days and ATR Decreasing for 5 days:
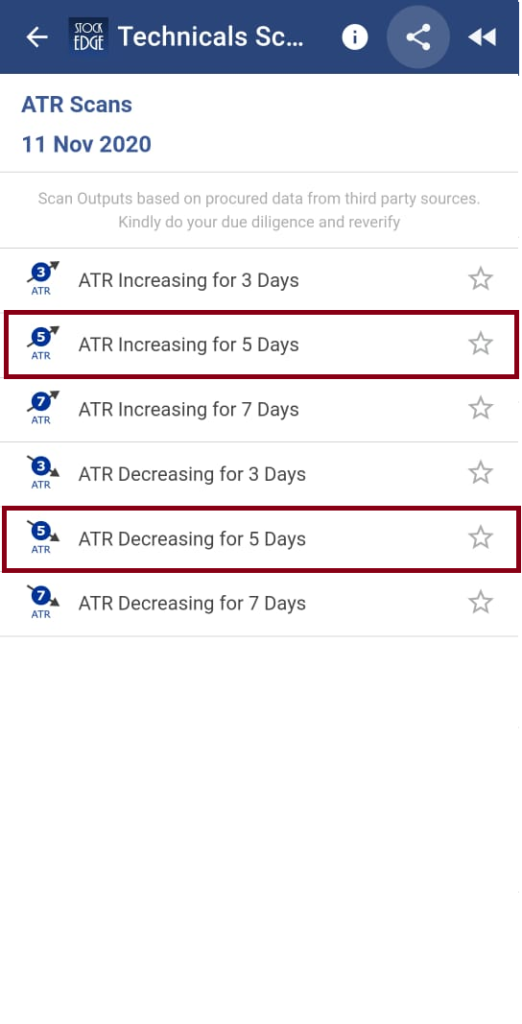
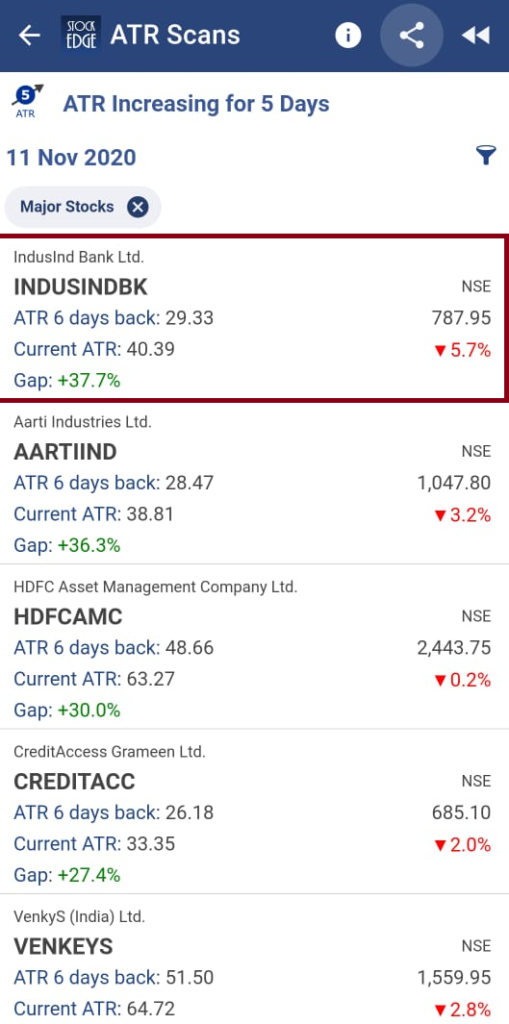
ATR Increasing for 5 days indicates that the stock is creating higher ATR for the last 5 days whereas ATR Decreasing for 5 days indicates that the stock is creating lower ATR for the last 5 days.
When we click on ATR Increasing for 5 days, we get a list of stocks which fulfill this criterion:
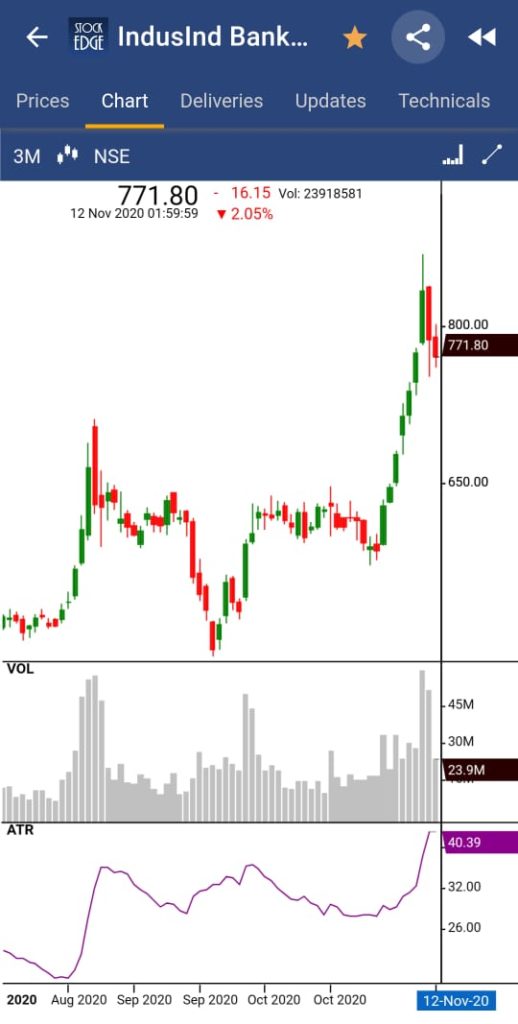
After clicking on IndusInd Bank, we get a technical chart with ATR plotted in the sub-graph:
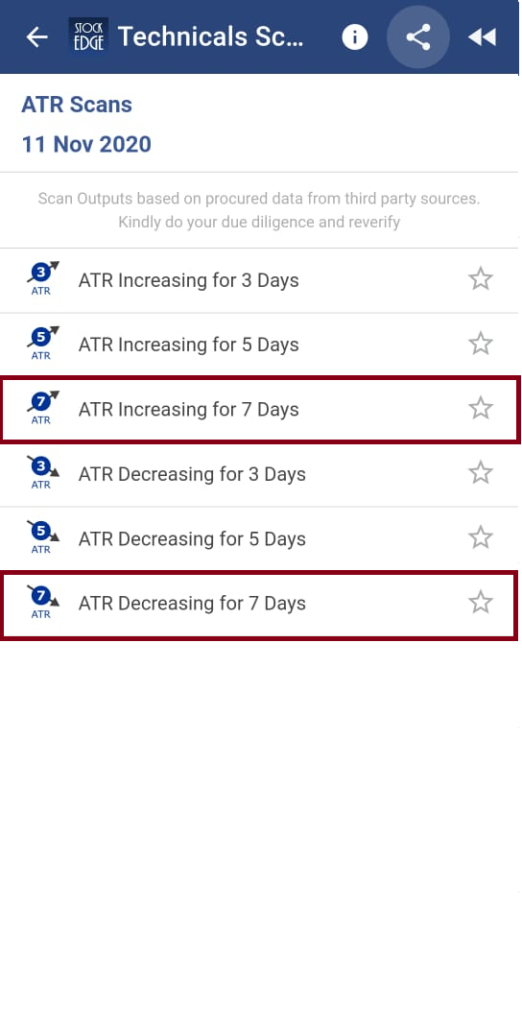
Example 3: ATR Increasing for 7 days and ATR Decreasing for 7 days:
ATR Increasing for 7 days indicates that the stock is creating higher ATR for the last 7 days whereas ATR Decreasing for 7 days indicates that the stock is creating lower ATR for the last 7 days.
When we click on ATR Decreasing for 7 days, we get a list of stocks that fulfill this criterion:
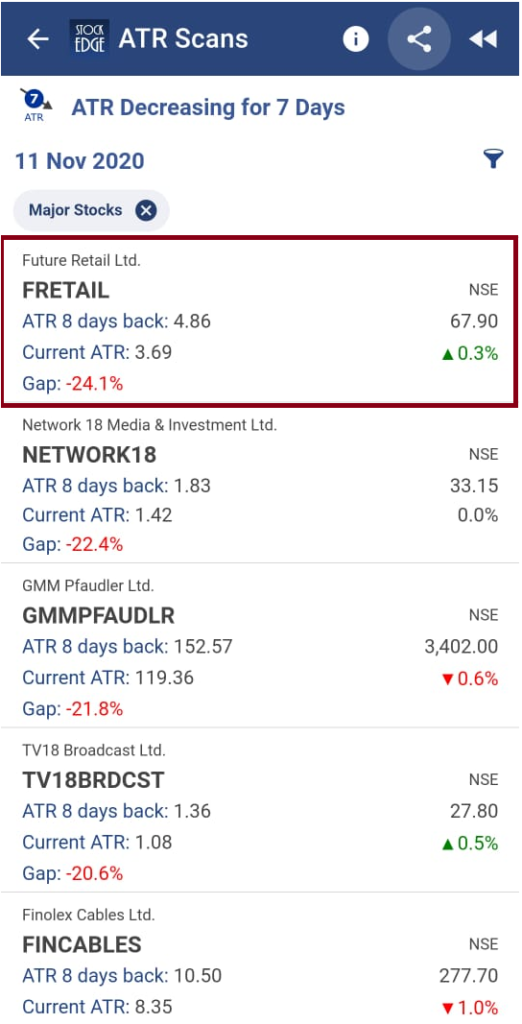
Above are examples of the ATR scans which help to confirm your trade decisions and also list the stocks which fulfill the criteria of the scans for that particular day.
You can filter out the stocks and can trade accordingly using these scans.
Frequently Asked Questions
How do you calculate the average true range?
It is based on 14 periods which can be calculated on an intraday, daily, weekly or monthly basis. The TR value is simply the High minus the Low, and the first 14-day Average True Range is the average of the daily True Range values for the last 14 days.
What does the average true range mean?
It is the average of true ranges over the specified period. It measures volatility, taking into account any gaps in the price movement.
Join StockEdge Club to get more such Stock Insights. Click to know more!
You can check out the desktop version of StockEdge.
Also Read : The Ultimate Guide to Trade using Average True Range.




Correctly explained.very helpful.Keep it up.All the best
thank you
Very lucidly explained
We are glad you liked the content. Keep following us on Twitter to read more such Blogs!
I want to become a club member
Hi Balkrishan, Our sales team will get back to you.
This is a very good article about the correct usage of the ATR indicator. Thank you.