Table of Contents
New Version of Stockedge Release Announcement
Added following cutting edge new Outputs for daily stock market research:
- Participant Wise Open Interest
- 2 Year and 5 Year Breakout Scans
Added following few features in existing outputs as per feedback by existing users:
- 20 Exponential Moving Average Scans
- Gainers/Losers tab in My Watchlists
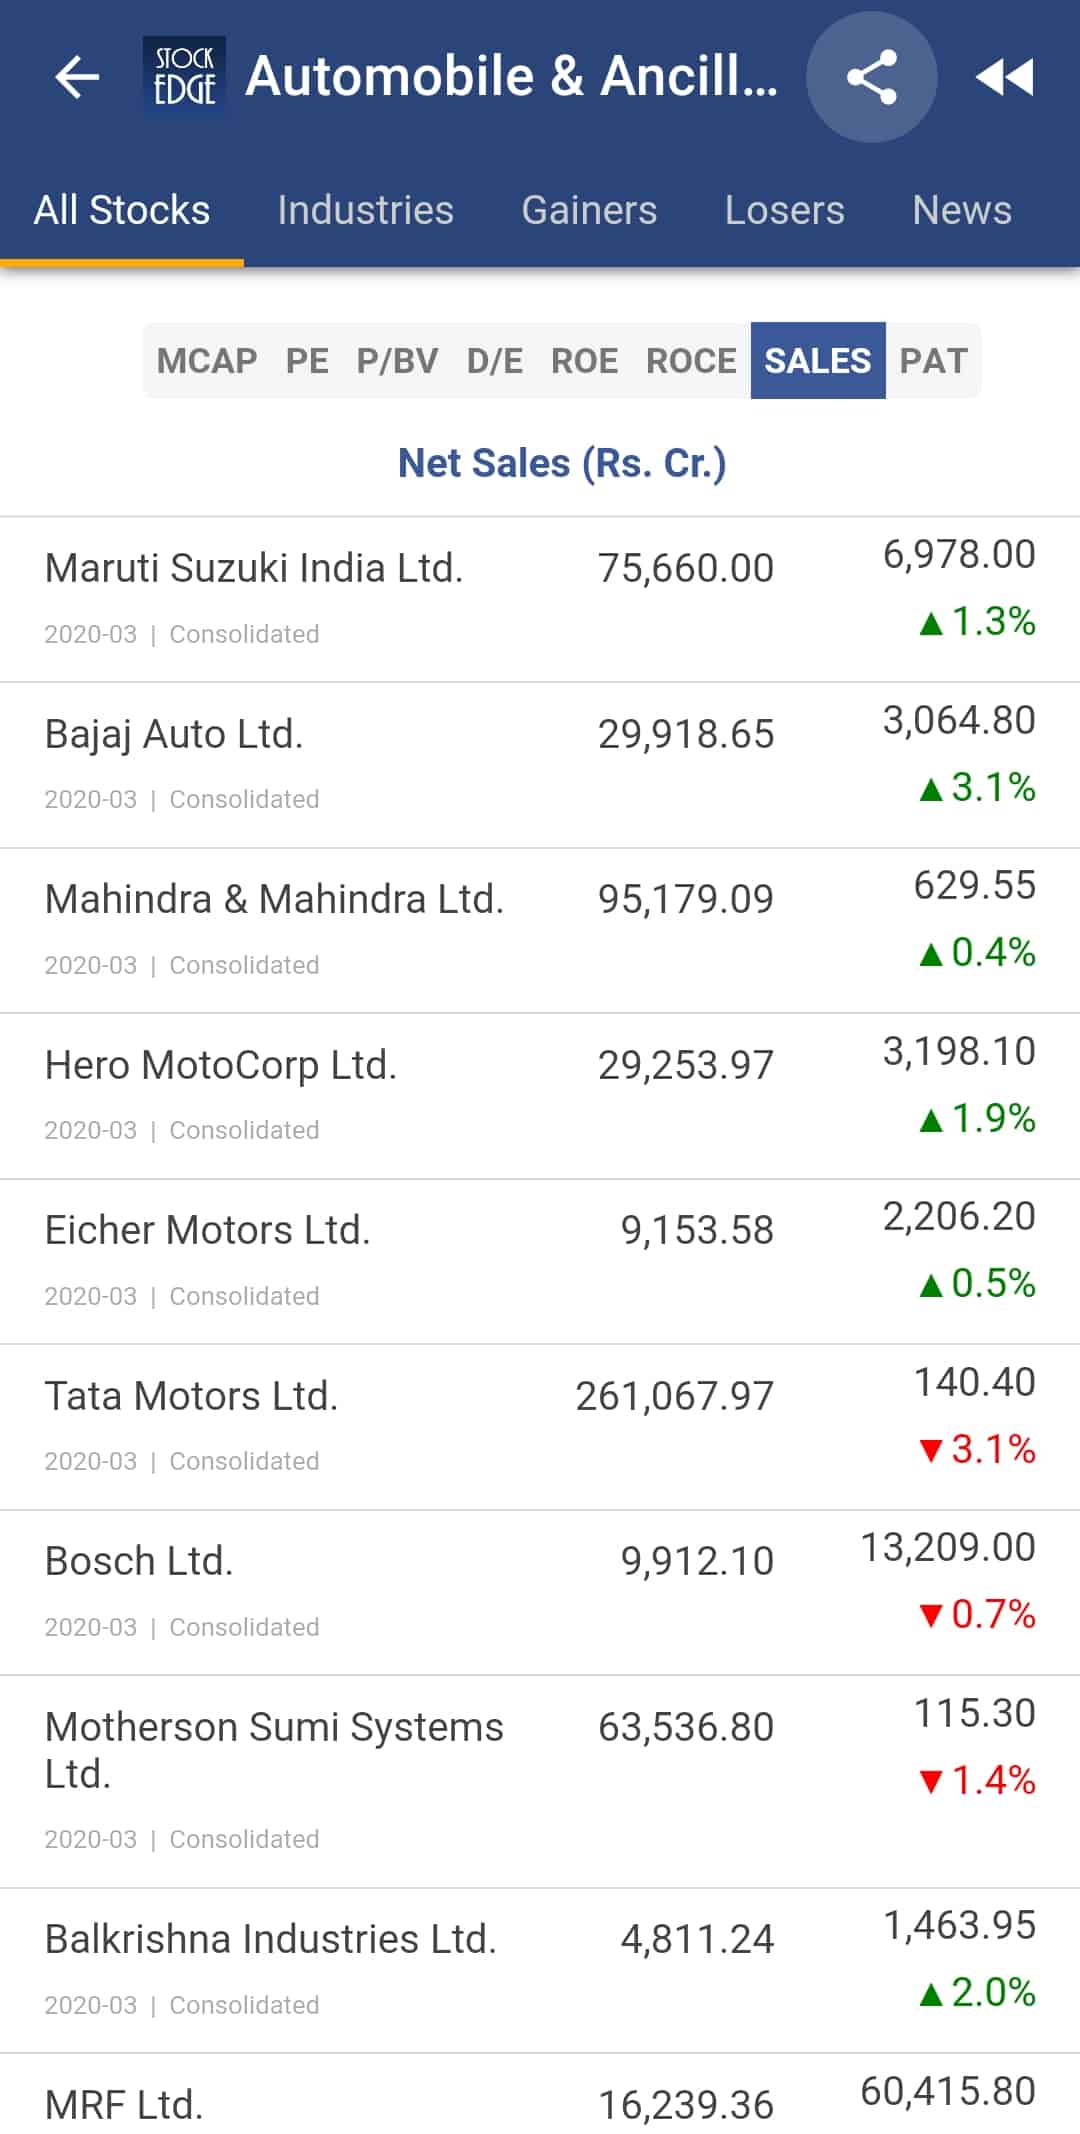
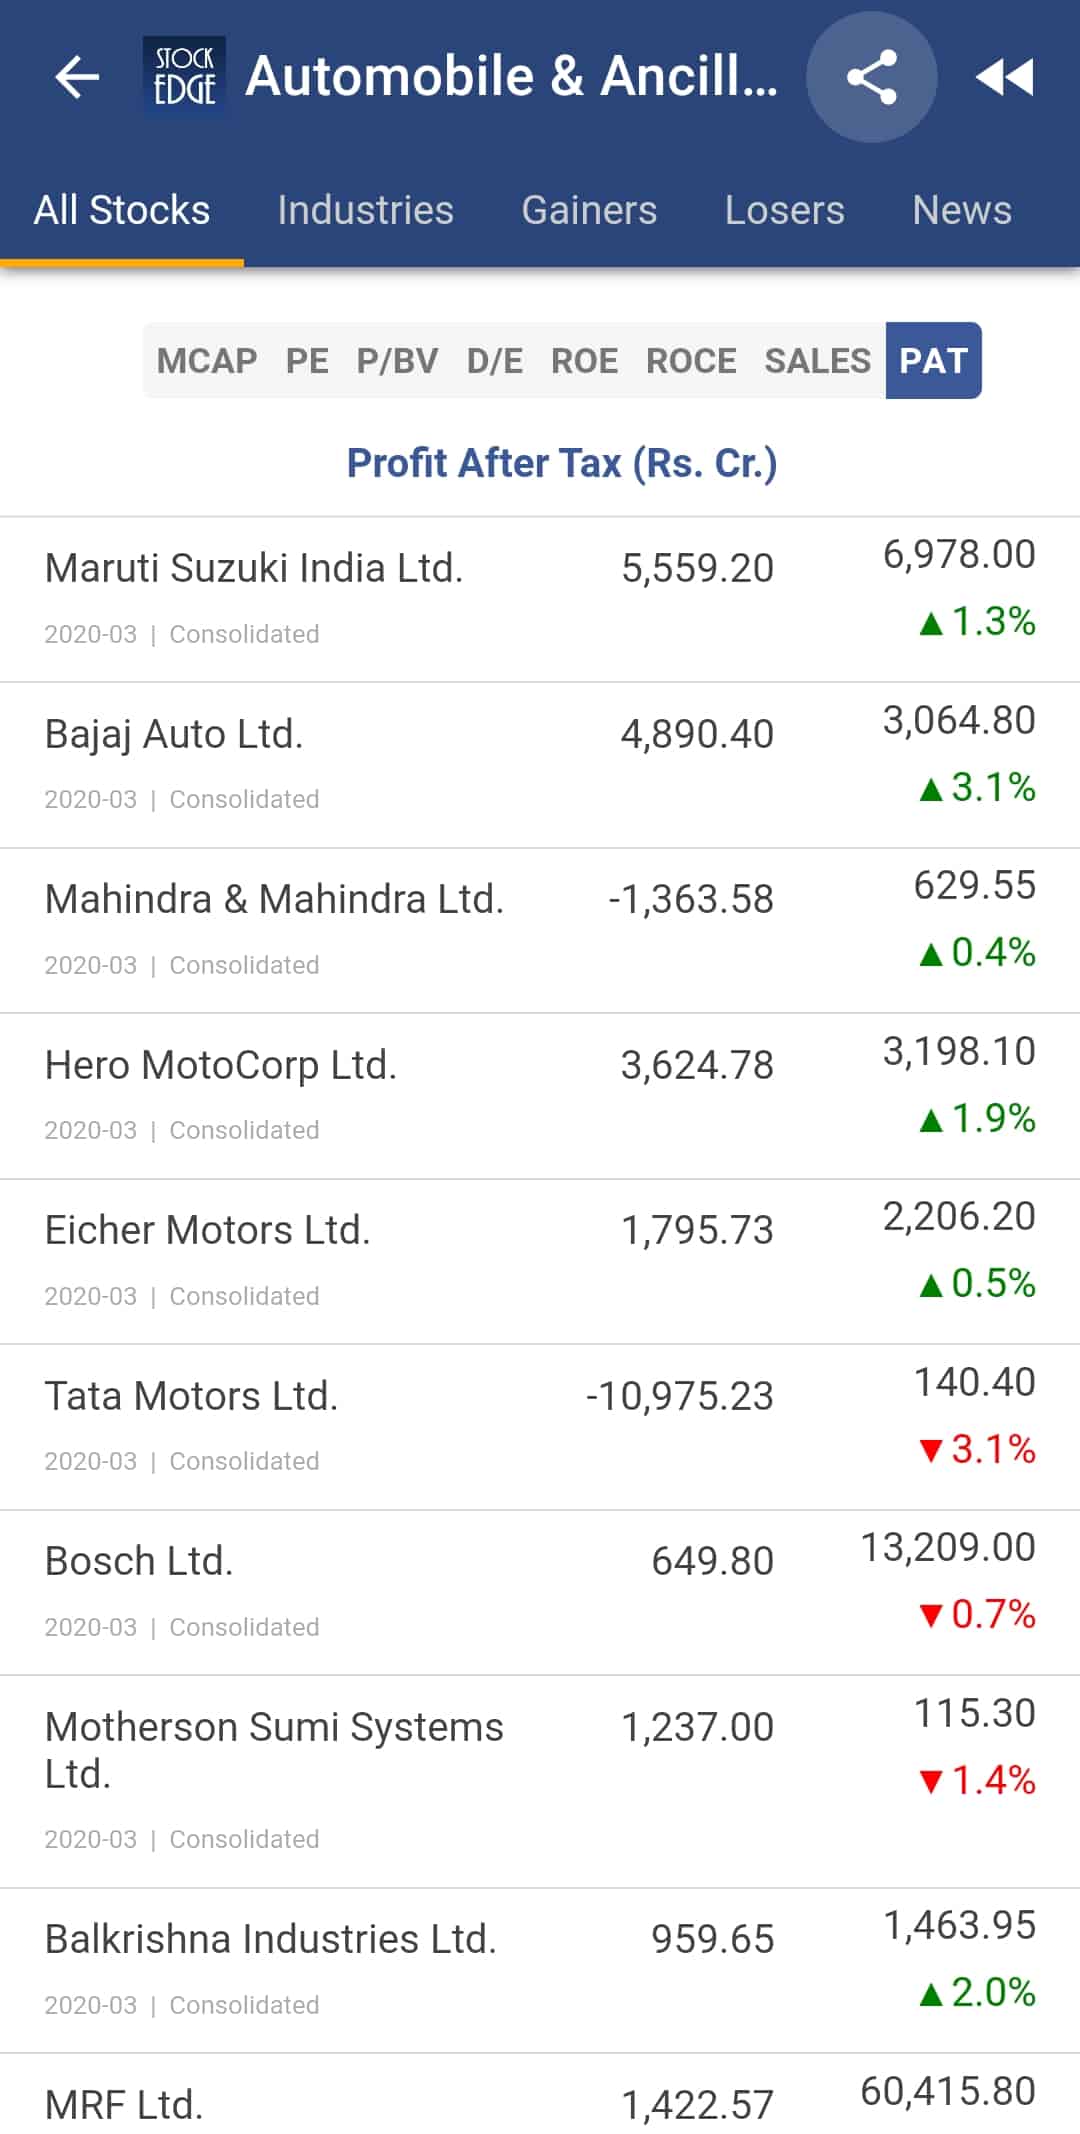
- Two New Parameters in Sector/Industry for filtering out stocks : Net Sales and PAT
Now let us have a brief overview of what are these features all about.
Participant Wise Open Interest
Open Interest is the number of outstanding futures and options contracts that have not been settled or closed. There are four categories as defined by the exchanges: Client, DII, FII and Pro. Their daily derivatives position gives a good indication of the possible trend in the market.
This feature is located in the DAILY UPDATE section and is further divided into three subsections: Gross, Net and Participants.
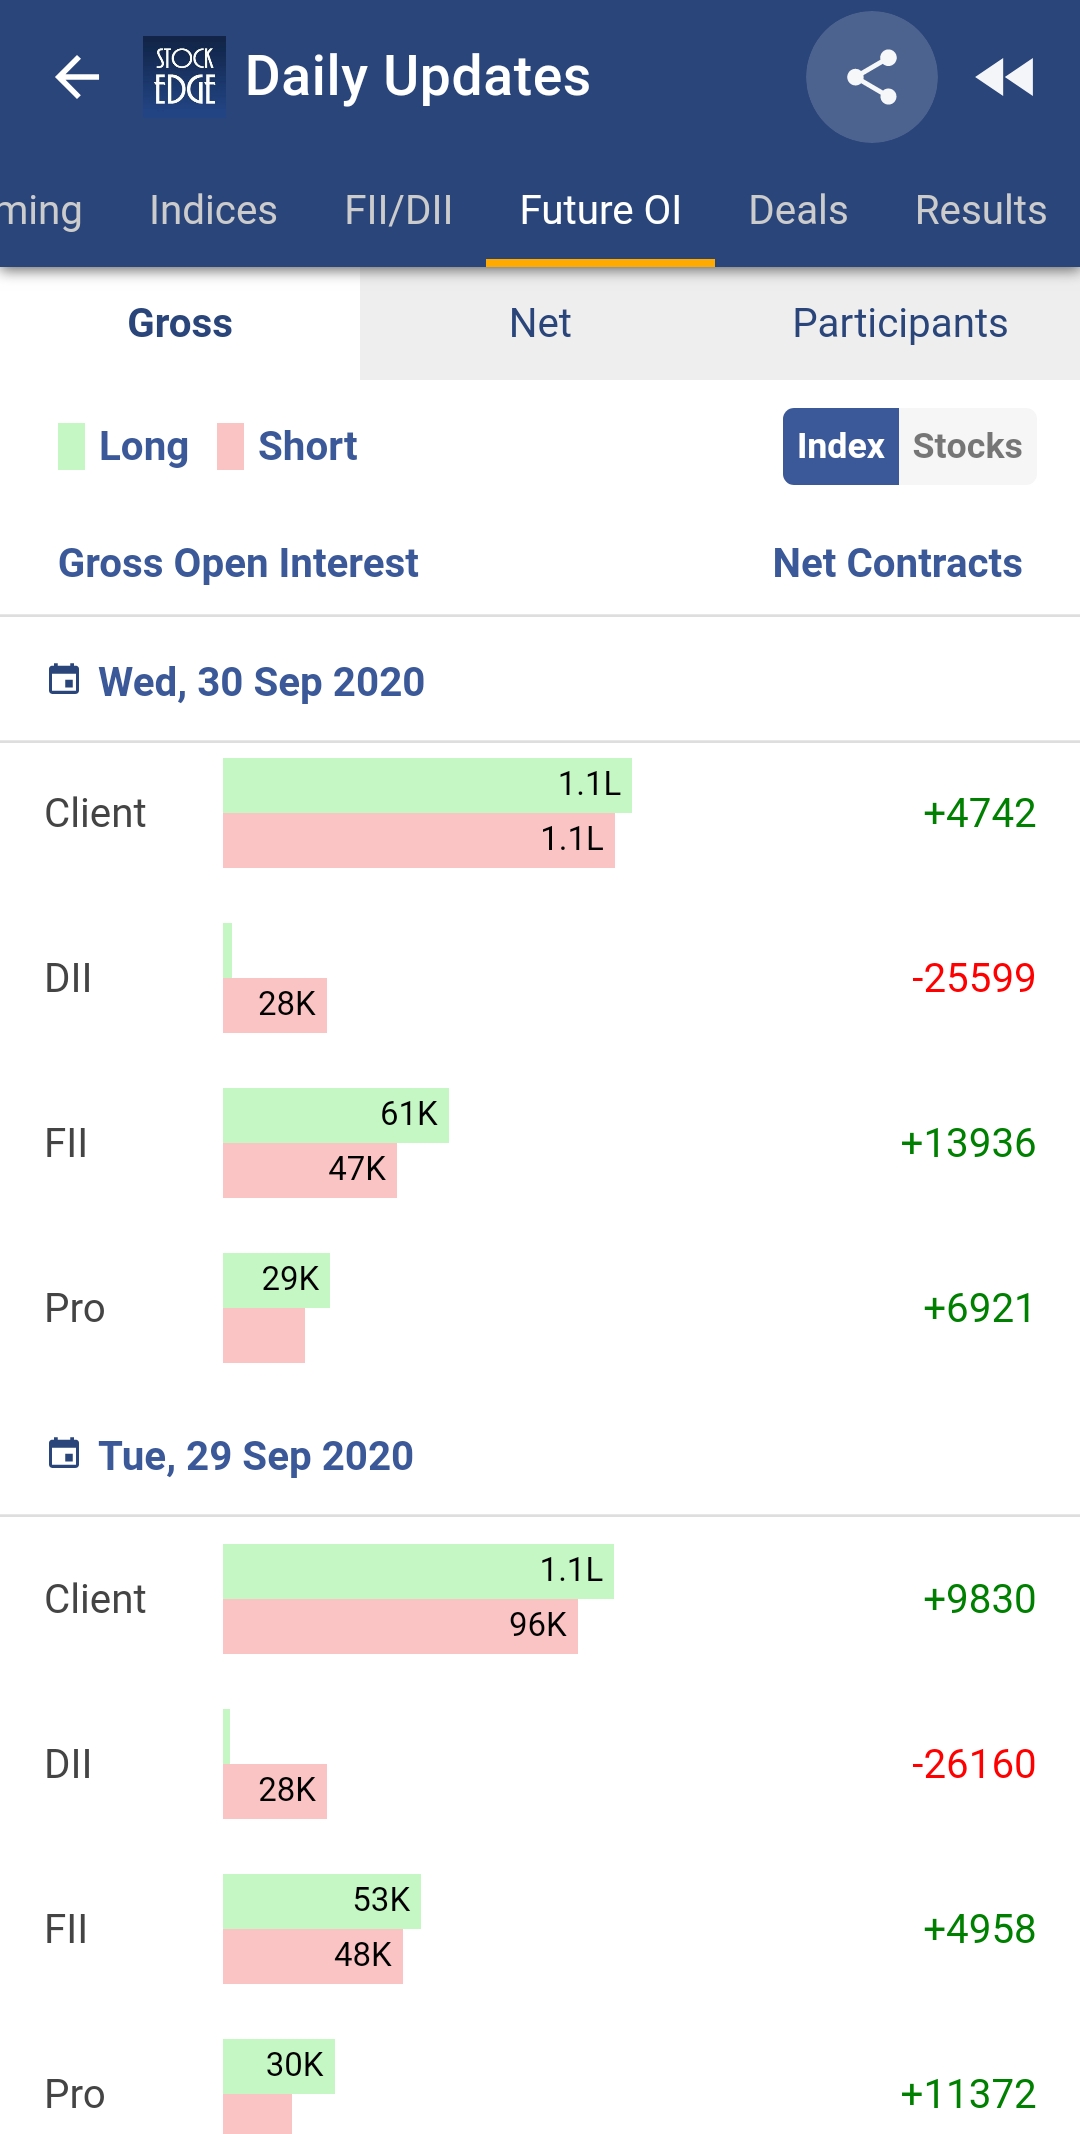
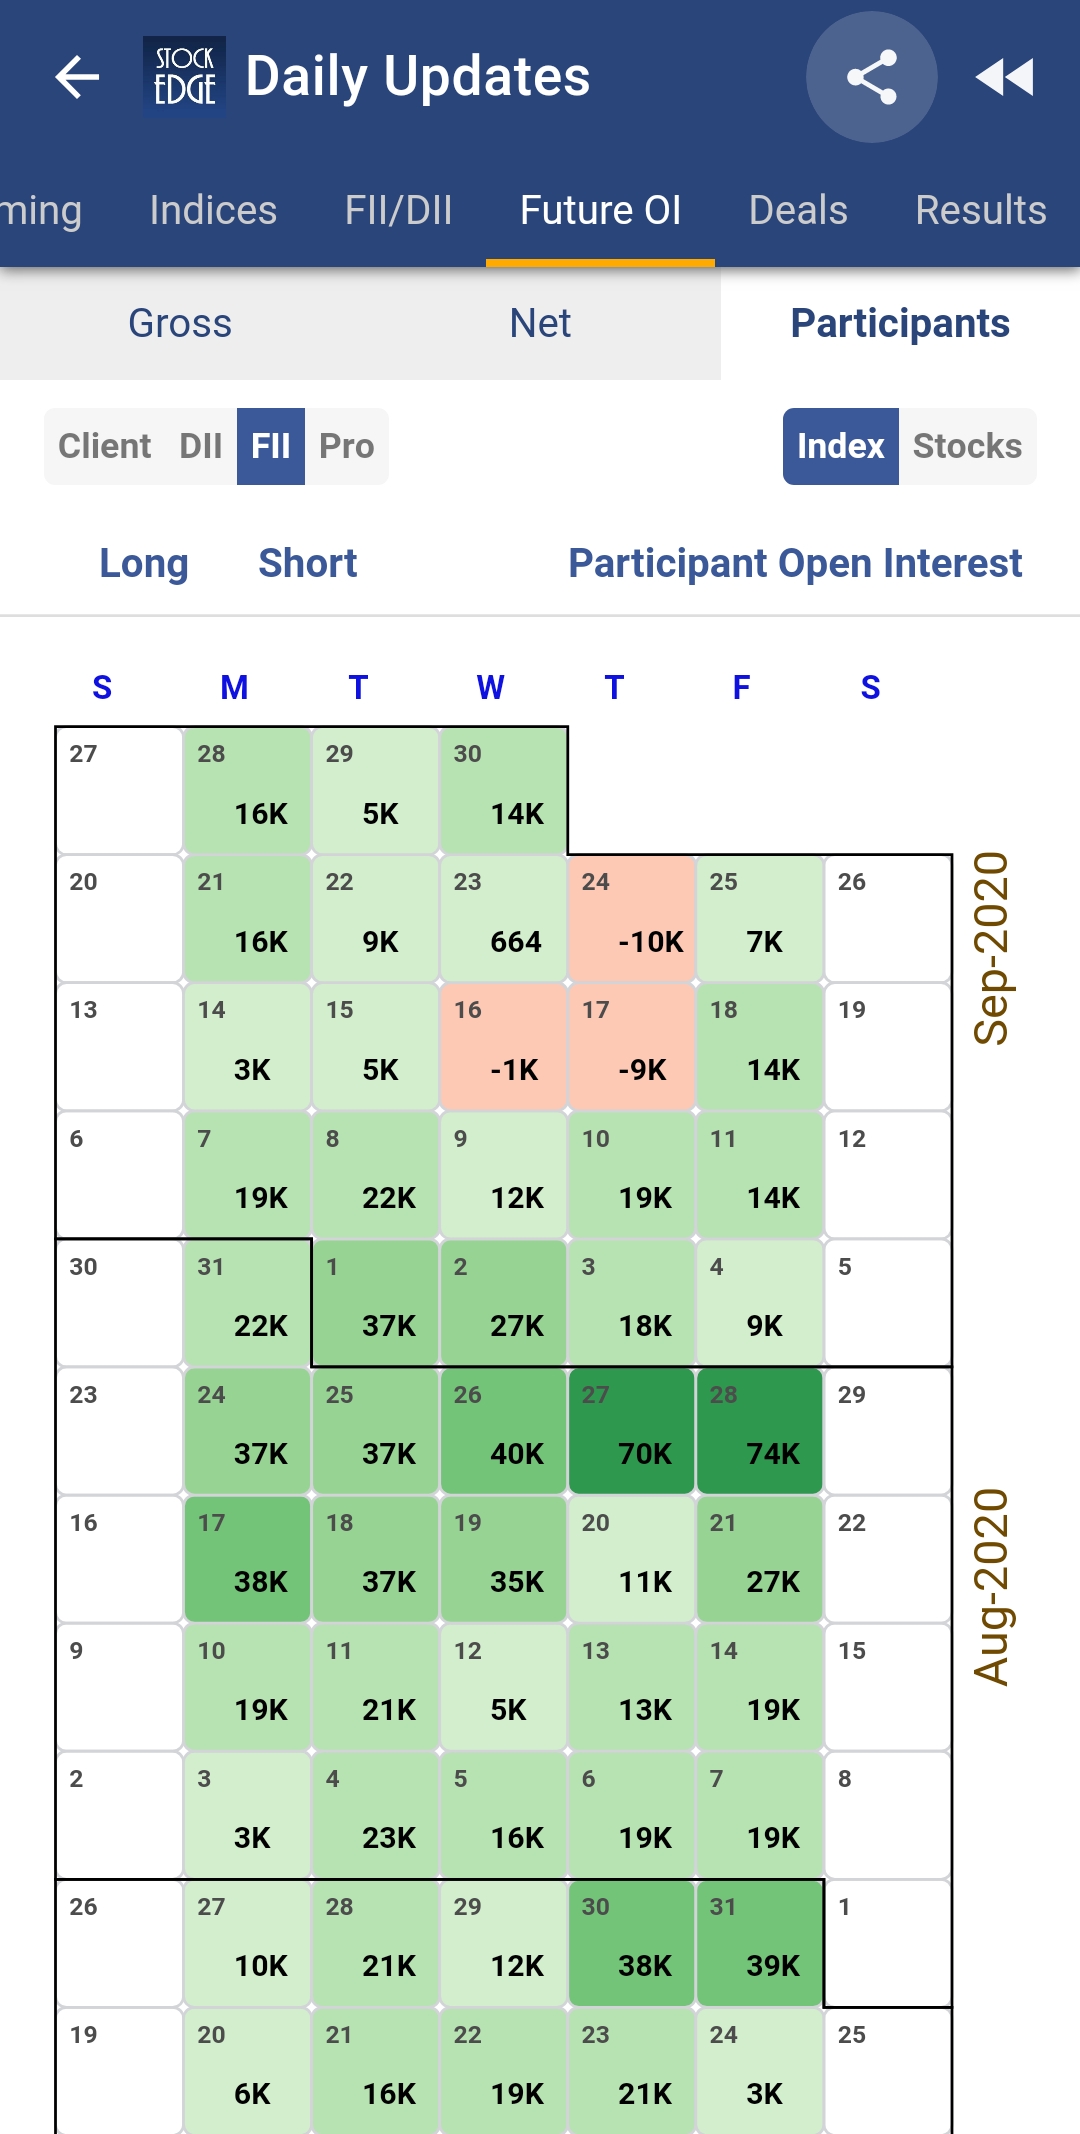
StockEdge shows this data for both Index and Stocks Futures to further help you to filter and strengthen your research and study. You will see below the images of the Gross tab and Participants Tab wherein
In the Gross tab, gross values of open interest contracts in terms of long and short positions are provided in a bar graphical presentation along with the net values.
In Participants Tab, you will see a calendar heat map for FII depicting the trend followed by them over a period of time. Here you will get to see a different section for each participant.
In the Net tab, you will get to see the net values of open interest contracts in a colorful bar presentation.
Visit our website to check out “daily update” feature.
2 Year and 5 Year Breakout Price Scans
A breakout is a price movement wherein a stock price moves above or below a resistance or support level respectively. A trader would initiate a long position when there is a breakout above the resistance level and a short position when there is a breakout below the support level.
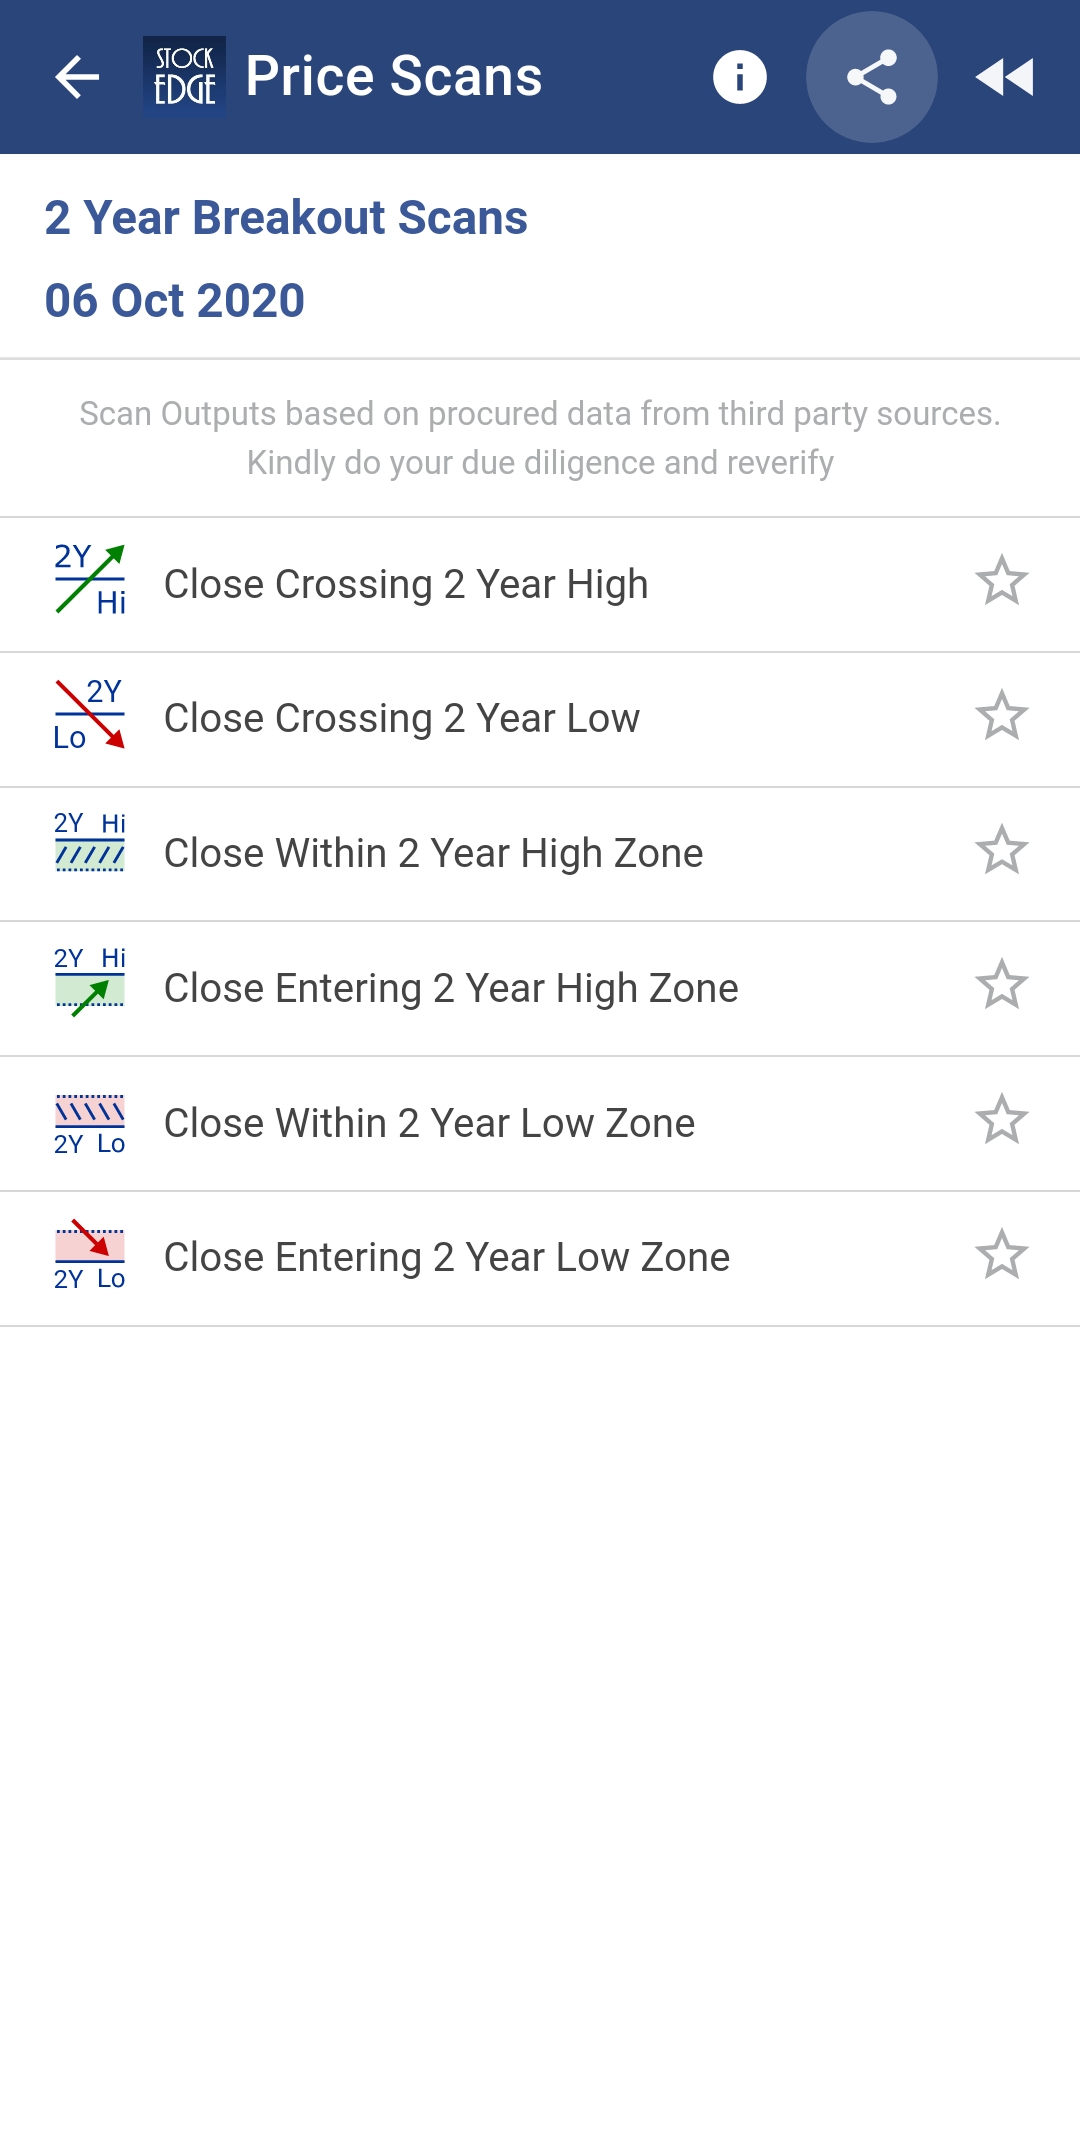
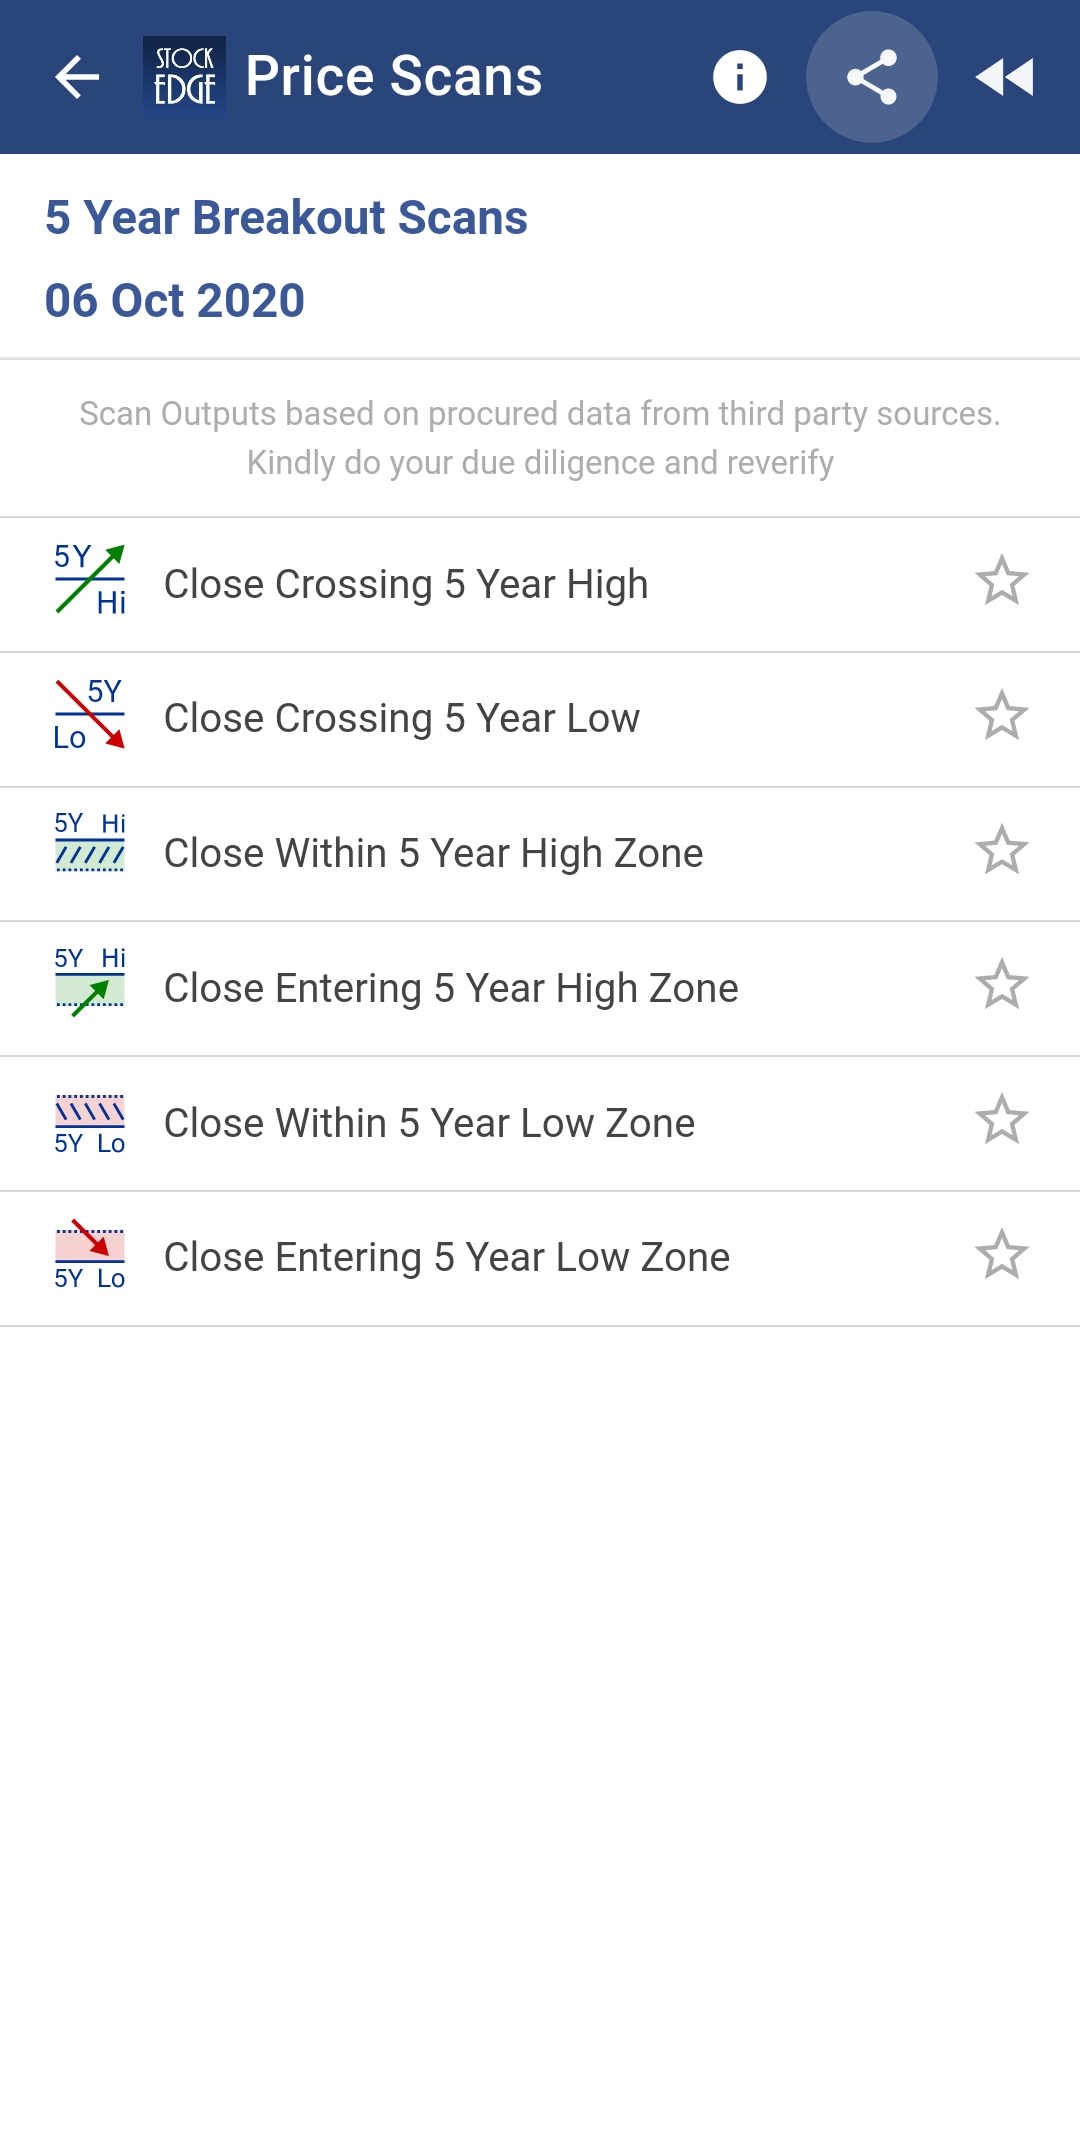
StockEdge is providing six scans each for both the time periods of 2 Year and 5 Year for different analysis parameters and indicators.
2 Exponential Moving Average Scans
Exponential Moving Average is technical chart indicator which tracks the price movement of a stock over a predefined period of time. It is similar to Simple Moving Average except that more weight is given to recent data. It helps in predicting the future price trends of a stock and as in stock will move for an uptrend or a downtrend.
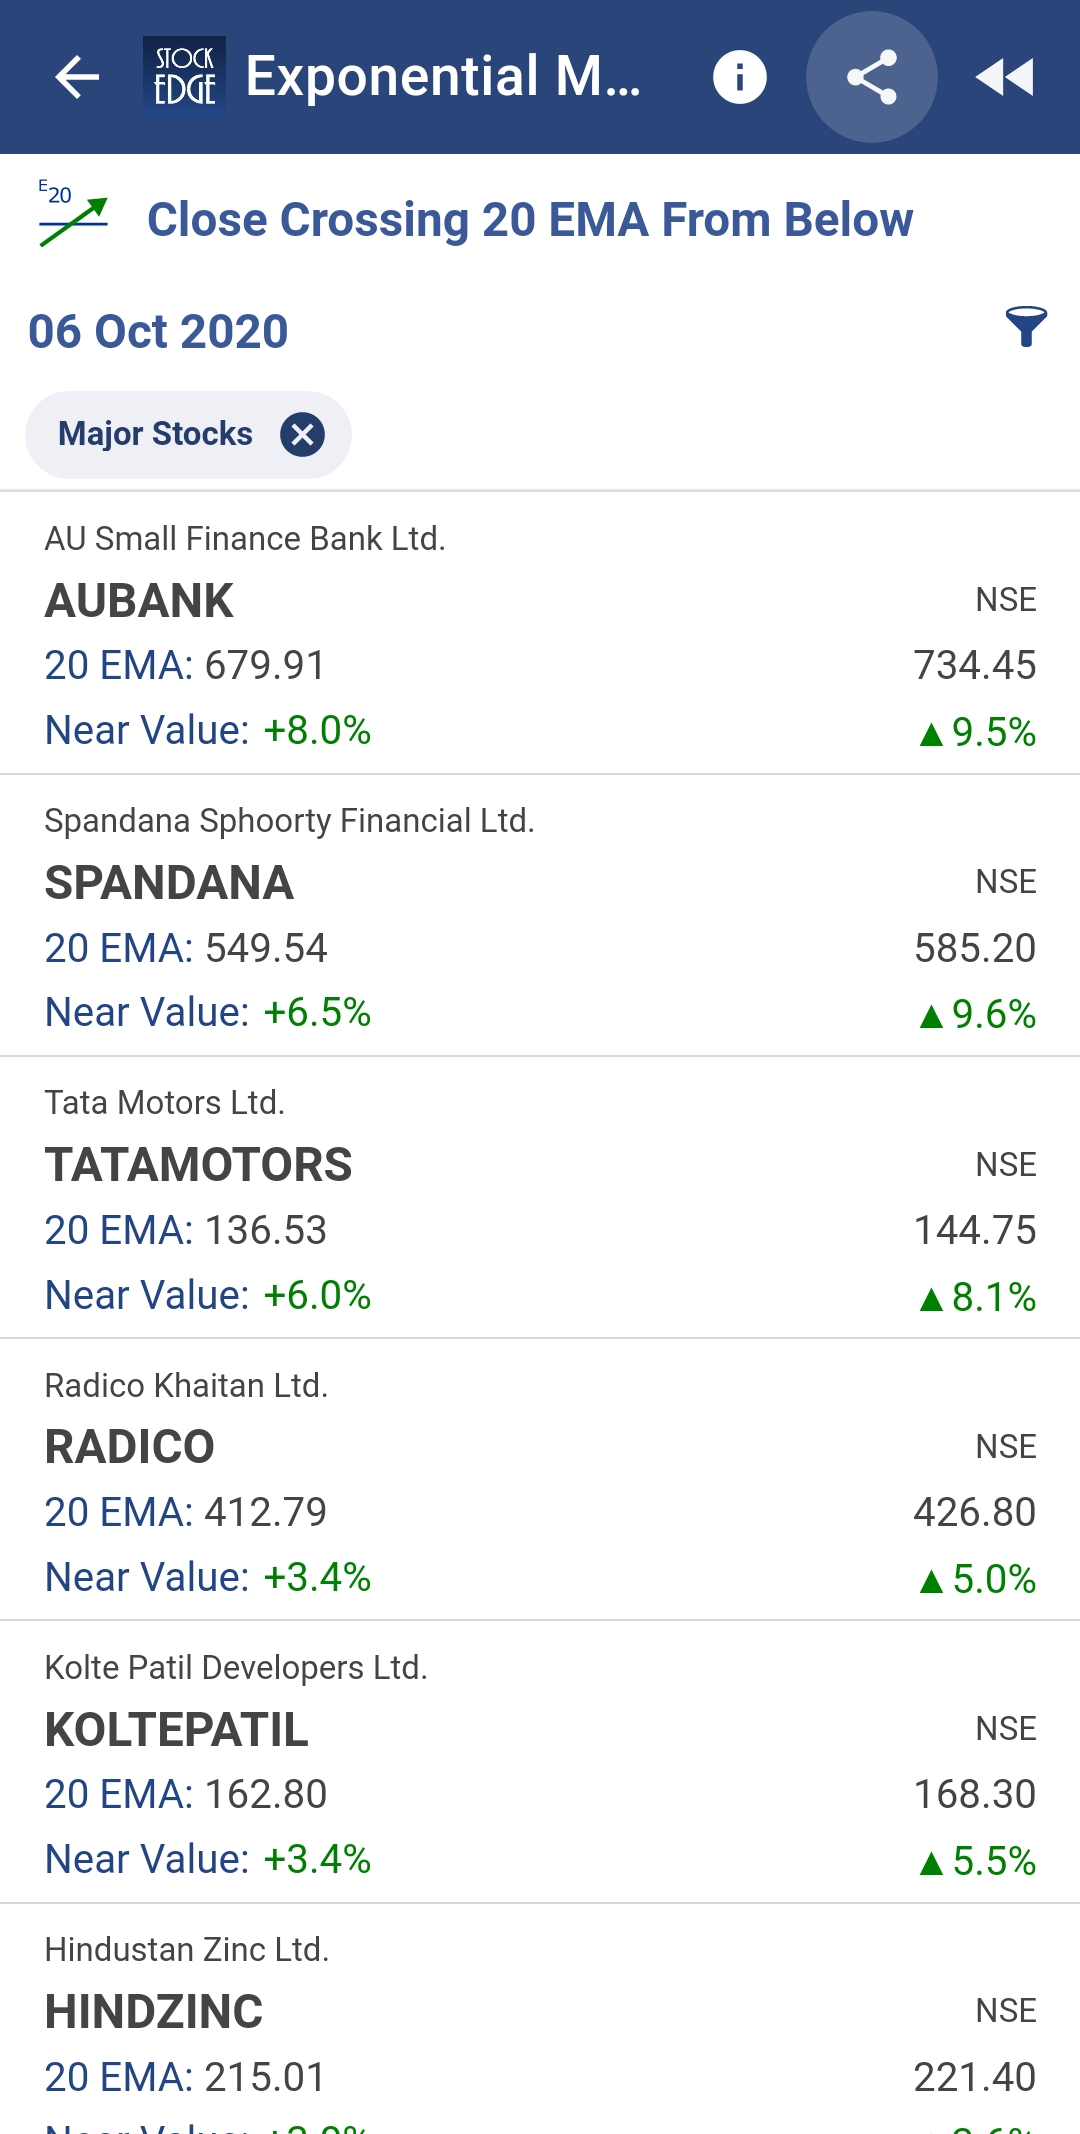
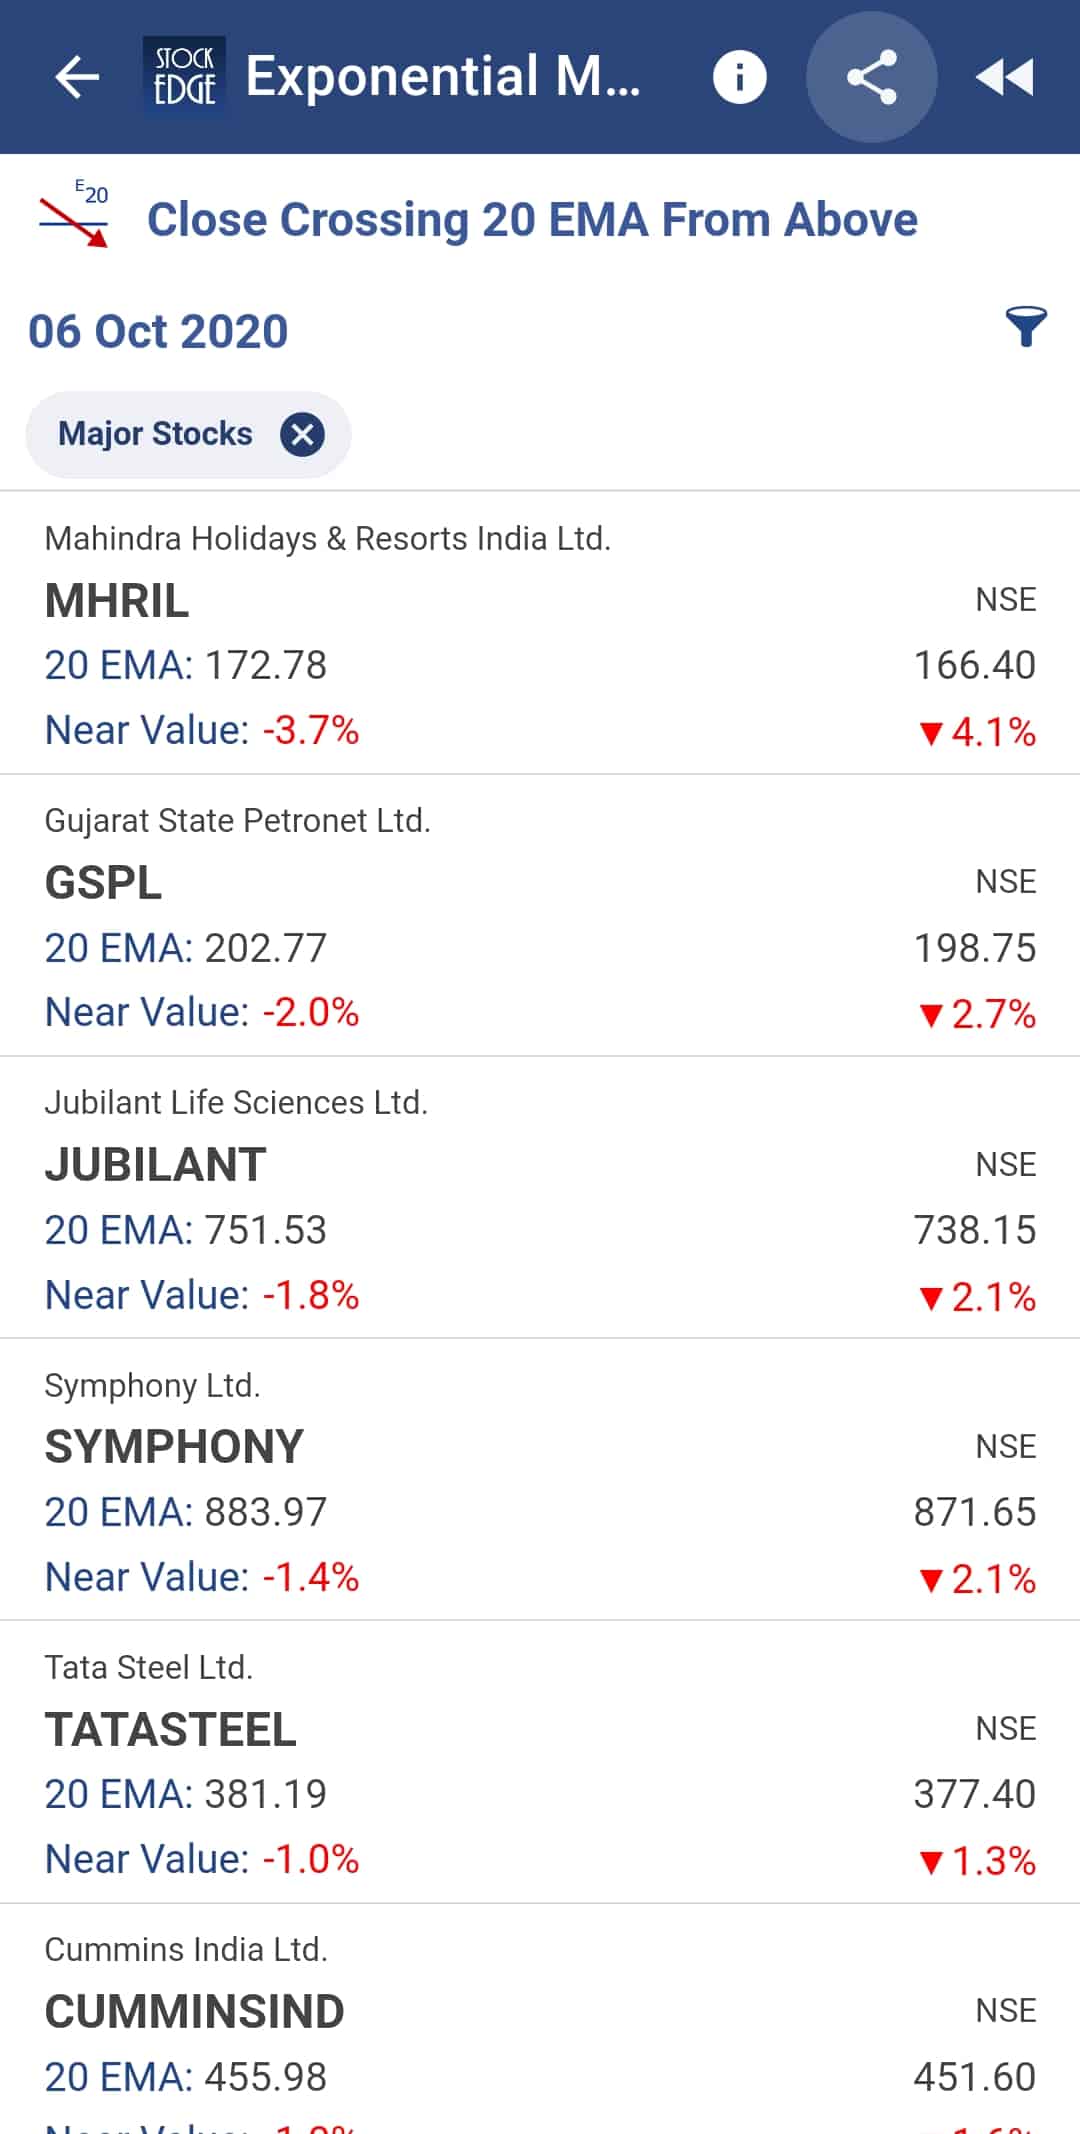
StockEdge adds two more scans in the basket of previous EMA scans and they are Close Crossing 20 EMA from Below and Close Crossing 20 EMA from Above where the former is a bullish indicator and the latter being the bearish indicator.
Visit “Exponential Moving Average” to start using this feature
Gainers/ Losers Section in My Watch Lists Section
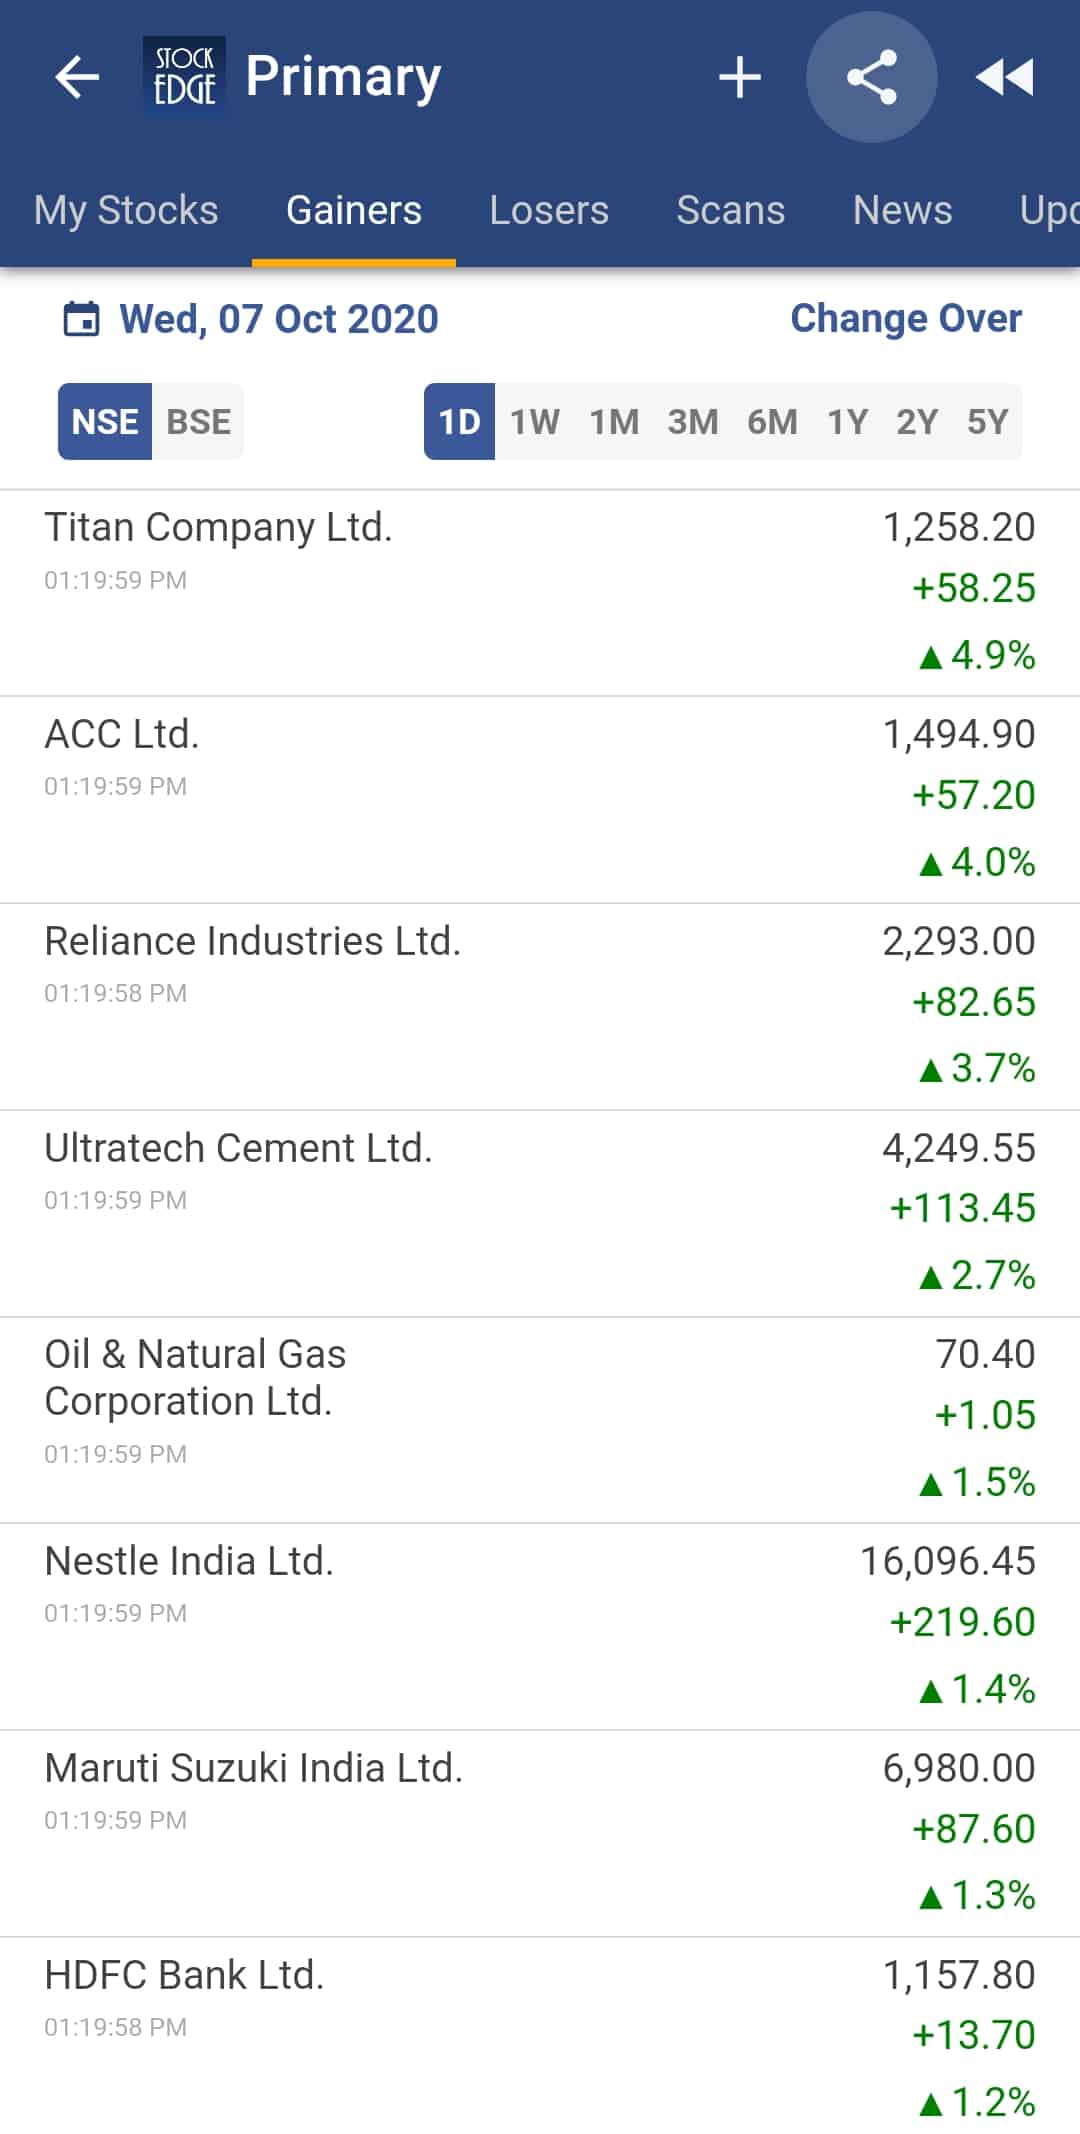
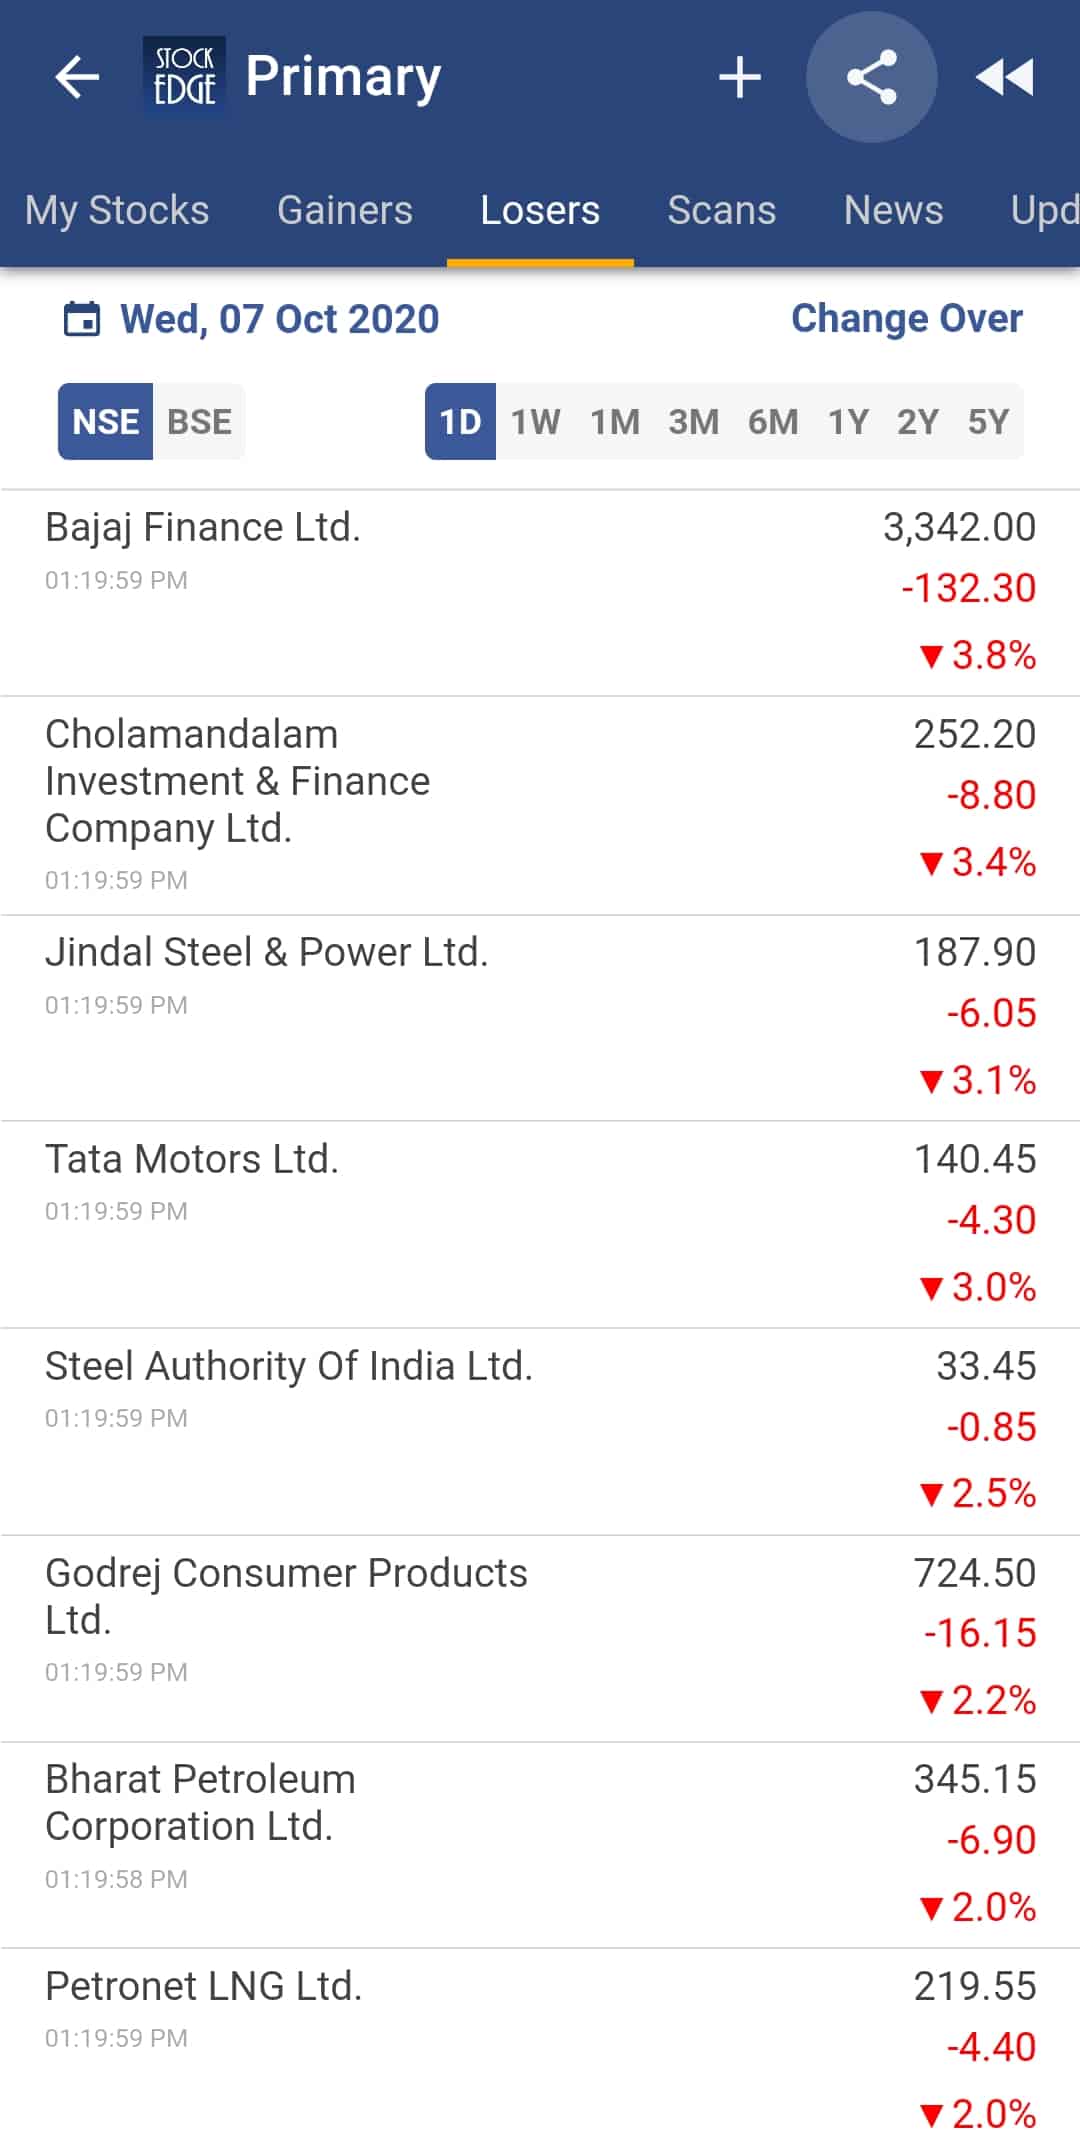
StockEdge adds an extension to its previous feature of My Watchlists located in My StockEdge by adding two more tabs of Gainers and Losers for your respective watchlist. Gainers tab will show the list of stocks present in your watchlist that have increased in price over a period of time and Losers tab will show the list of stocks that have decreased in price over a period of time. See gainers and losers of the day in stockedge web app.
Sales and Profit After Tax(PAT) Parameter in Sector/Industry
In the Sector/ Industry section you will see that StockEdge has two more parameters along with the previous ones for filtering out stocks. They are Net Sales and PAT. You can filter out stocks on the basis of Net Sales and PAT in a descending order for that respective sector/industry.
For more further details on the above mentioned features, you can read our blog for the same:
- Participant Wise Open Interest – Click Here
- 2 Year and 5 Year Breakout Scans – Click Here
Many more interesting features have been added to make your experience all the more beautiful. So do not miss the chance to use this powerful tool, using which you can become an Independent Investor/trader.
Click here to download the latest version of StockEdge App make your analysis faster, better and easier within minutes.







How to update latest version of Stock edge