StockEdge.com
  • Products
    • StockEdge Premium
    • StockEdge Pro
    • StockEdge Club
  • Stories
StockEdge Blog
  • Trending Stocks
  • Insights
  • Technical Analysis
  • Fundamental Analysis
  • StockEdge Tutorials
  • Mutual Fund
No Result
View All Result
  • Trending Stocks
  • Insights
  • Technical Analysis
  • Fundamental Analysis
  • StockEdge Tutorials
  • Mutual Fund
No Result
View All Result
StockEdge
Home StockEdge Version Updates
A promotional image for stock edge with a blue background. The left side contains a dark square with white text that reads stock edge. The right side has white text that reads update to new version of stockedge

Update to the latest version of Stockedge

StockEdge by StockEdge
January 11, 2024
Reading Time: 3 mins read
1.1k
VIEWS
Share on FacebookShare on XShare On WhatsApp

Table of Contents

  • Stockedge 5.1
  • Business Houses
  • Narrow Range Scans

StockEdge is glad to announce its latest version loaded with more new and exciting features which will help you to enhance your stock research further.

Stockedge 5.1

So StockEdge 5.1 will provide all the existing features along with two more new features like

  • Business Houses
  • NR 4 & 7 Scan, NR 4 & 7 Breakout/ Breakdown Scans

Now when the market is so volatile and we all are wondering what to do, where to start from. This is the best time start using StockEdge it not only provides an ocean of data but at each data point it provides learning via Information Panel in the form of text, Blog and videos.

Business Houses

Business Houses are a public or private structure business that forms a group of various companies dealing in different segments. There are 33 business houses including both Family and Institutional that are incorporated in India.

StockEdge is providing with all the relevant and descriptive data for all the respective 33 houses to further help you to filter and strengthen your research and study.
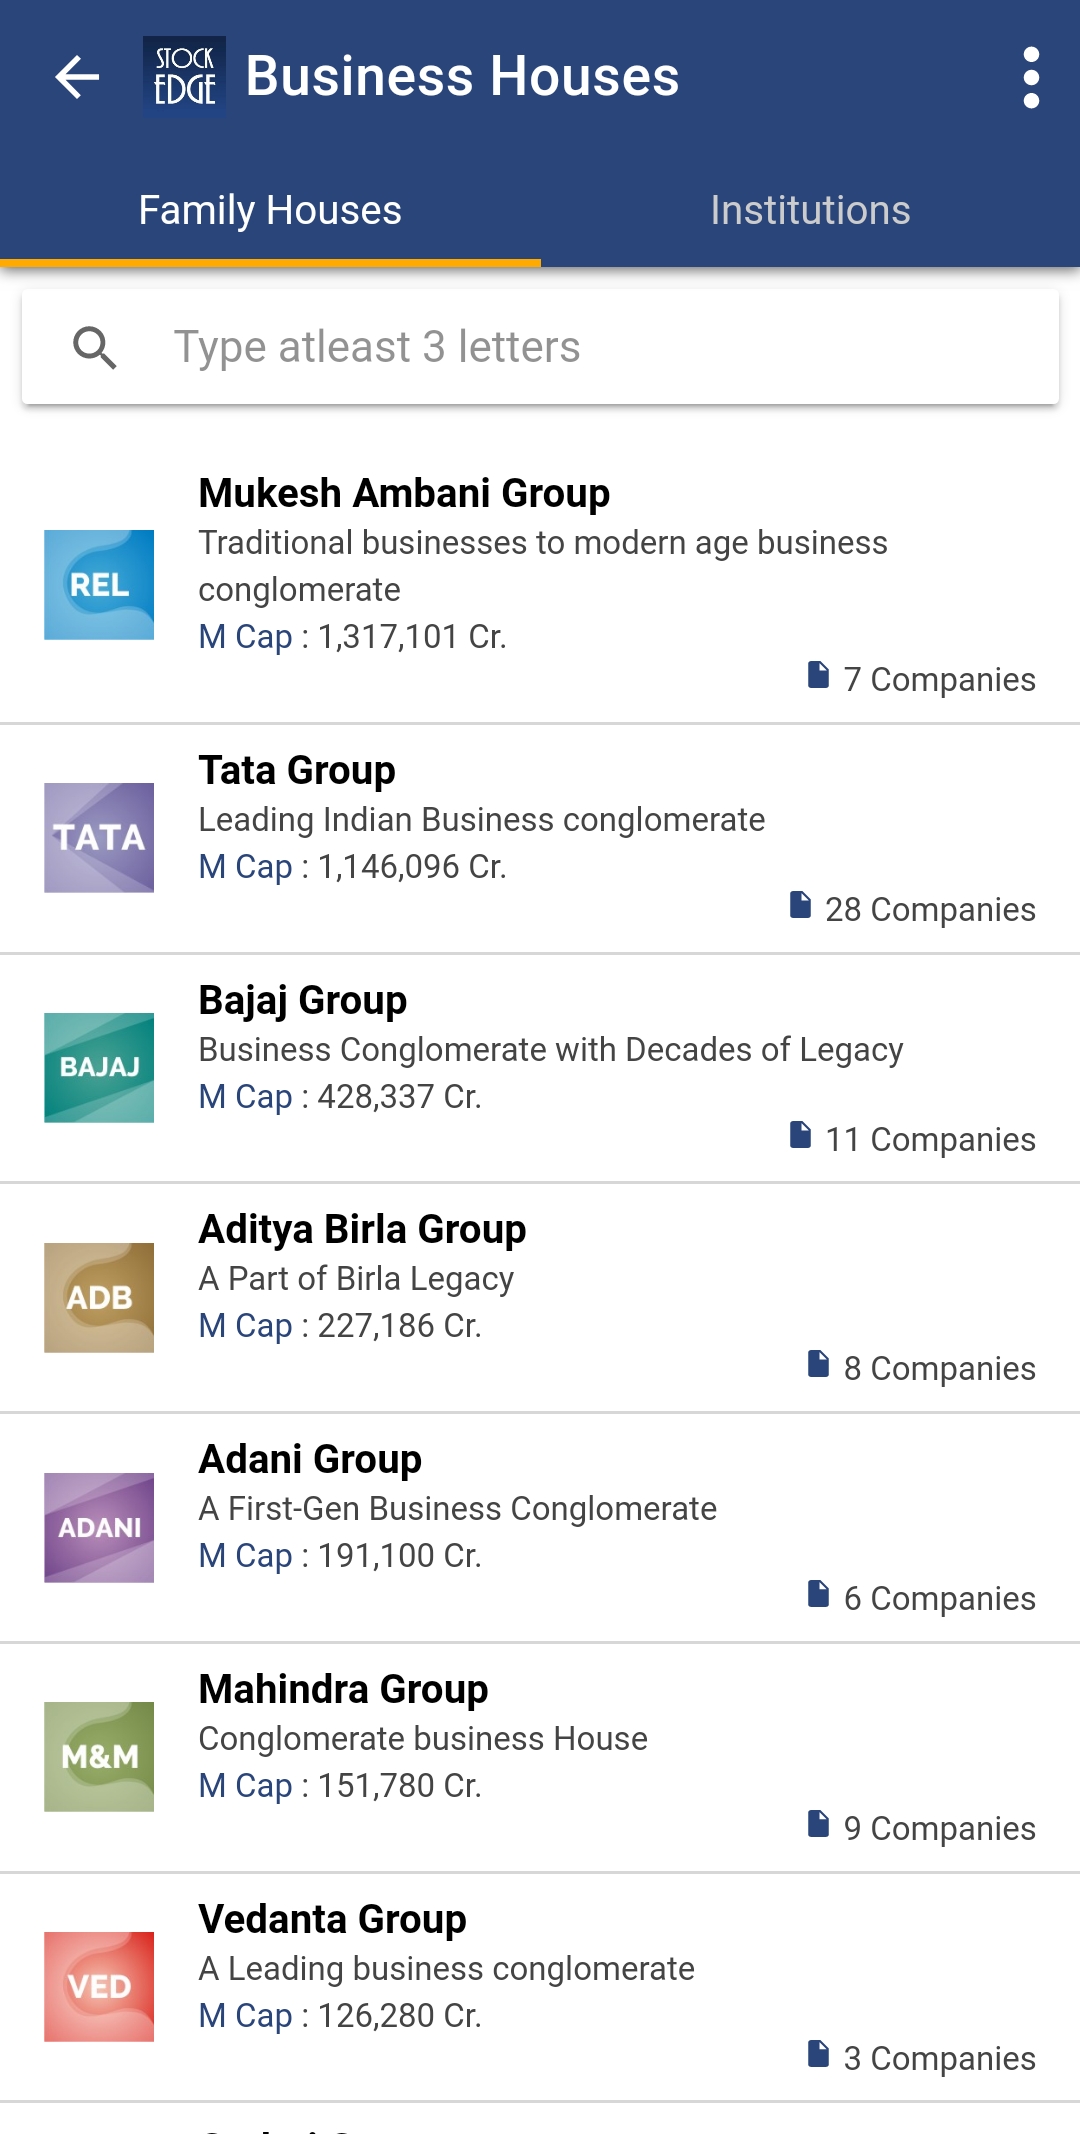
This is a screenshot of a list of indian business conglomerates and their details. The list is presented in a mobile app(stockedge) interface and is sorted alphabetically. Each entry in the list has the conglomerate’s name, a brief description, and the number of companies under it. The list includes conglomerates such as reliance industries, tata group, adani group, and vedanta group.

Narrow Range Scans

Narrow Range trading strategy is a breakout based method which assumes that the price of security trends up or down after a brief consolidation in a narrow range. The default lookback period of this strategy is 7 days which means that if the price range of any particular days is lowest as compared to last 7 days, then that day is termed as NR 7 day. Similarly, if the price range of any particular days is lowest as compared to the last 4 days, then that day is termed as NR 4 day.
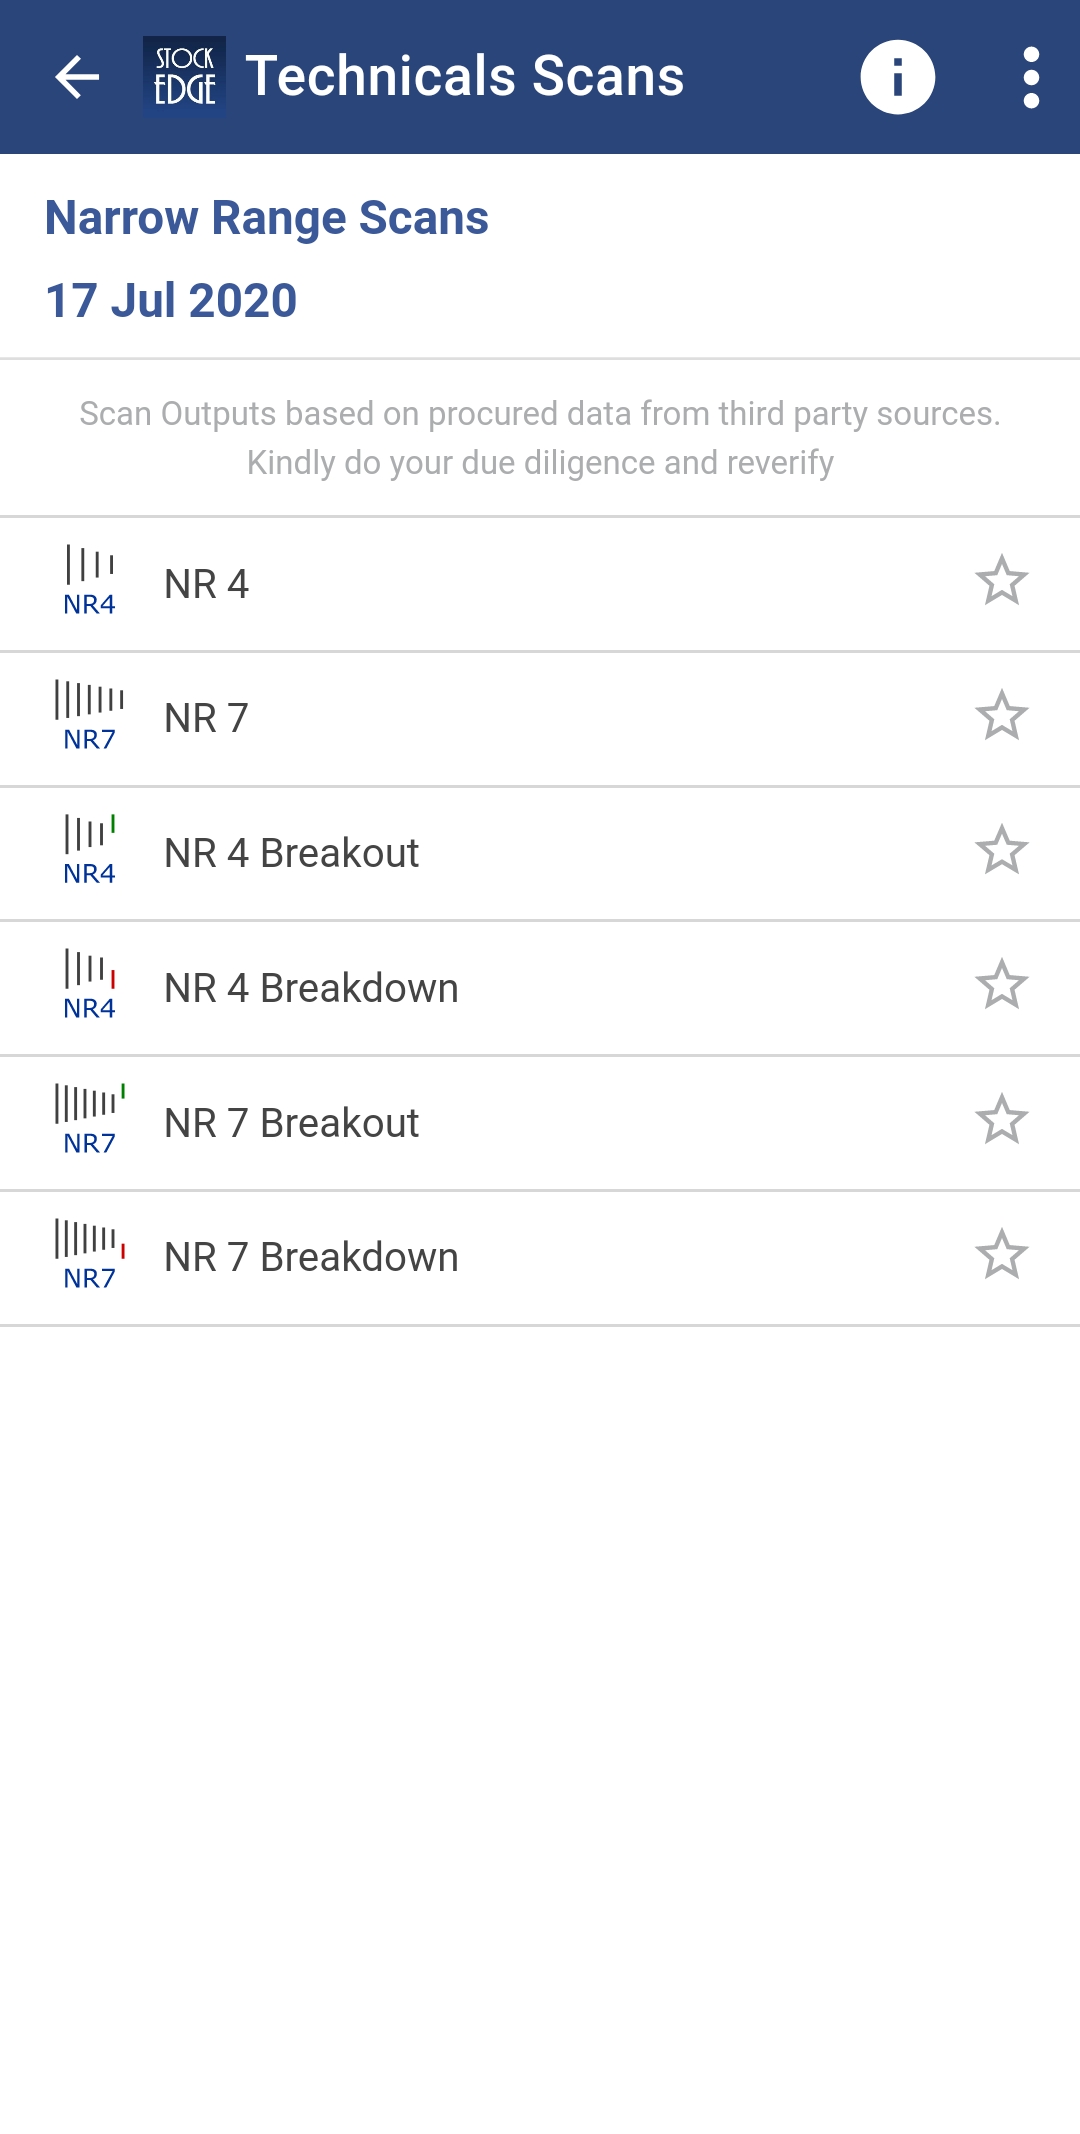
This is a screenshot of a list of technical scans with ratings on the stockedge app.

For more further details on Business Houses and Narrow Range Scans, you can read our blog for the same:

  • Business Houses
  • Narrow Range Scans

Many more interesting features have been added to make your experience all the more beautiful. So do not miss the chance to use this powerful tool, using which you can become an Independent Investor/trader.

Click here to download the latest version of StockEdge App make your analysis faster, better and easier within minutes.

Tags: business housesnarrow range
ShareTweetSend
Open A Zero Brokerage Account In Kotak Open A Zero Brokerage Account In Kotak Open A Zero Brokerage Account In Kotak
Previous Post

What is Narrow Range Scans?

Next Post

5 Steps to analyze Mutual Funds for better Investments

StockEdge

StockEdge

StockEdge is a self-help Equity and Mutual Fund research tool. It empowers retail investors to identify investment opportunity with all the necessary data and analytics.

Next Post
A person looking at a tablet computer with a financial news app on the screen. The text “mutual funds” is written on the screen.

5 Steps to analyze Mutual Funds for better Investments

A graphic representation of "mutual funds" in a blue background. The graphic has the words “mutual funds” in white text on the left side and the words “sharpe ratio” in white text on the right side. The graphic has a line graph in orange and white in the center, which appears to be showing the performance of a mutual fund over time. The graphic has the words “mutual funds” in white text on the left side and the words “sharpe ratio” in white text on the right side. The graphic has a line graph in orange and white in the center, which appears to be showing the performance of a mutual fund over time.

How to use Sharpe Ratio to analyze mutual funds?

A logo with the text "long time frame scans" in blue and white, with a line graph underneath and the text "2y" and "5y" to the right. The logo appears on a blue background.

2 year and 5 year Price Breakout Scan

Comments 1

  1. Avatar of venkata siva prasad kanishetty Venkata Siva Prasad Kanishetty says:
    5 years ago

    I am really impressed the tool which are available with the StockEdge App.

Disclaimer

StockEdge (Kredent InfoEdge Pvt. Ltd.) is a SEBI-registered Research Analyst (RA) entity (SEBI Registration No: INH300007493). The information provided in this article is for educational and informational purposes only and should not be considered as an offer to buy or sell any securities or investment products.

The stocks, securities, and investment instruments mentioned herein are not recommendations under SEBI (Research Analysts) Regulations, 2014. Readers are advised to conduct their own due diligence and seek independent financial advice before making any investment decisions.

Investments in securities markets are subject to market risks. Please read all related documents carefully before investing. Investing in Equity Shares,
Derivatives, Mutual Funds, or other instruments carry inherent risks, including potential loss of capital. StockEdge (Kredent InfoEdge Pvt. Ltd.) does not provide any guarantee or assurance of returns on any investments. Past performance is not indicative of future performance.

Contact Us
  • Timing (Mon-Sat): 10 am to 7 pm
  • Sales: +919830994463
  • Support: +919830994402
  • Club Support: +916289906895
  • Affiliate: +917003567131
Recent Posts
Check out the Top 3 Consumption Stocks in India
Top 3 Consumption Stocks in India
Ather Energy IPO: All You Need to Know
Important Links
  • StockEdge.com
  • StockEdge Premium
  • StockEdge Pro
  • StockEdge Club
  • Compare Plans
An Initiative Of
Logo of KREDENT INFOEDGE with SEBI Registration no.

© 2025 Kredent InfoEdge Pvt Ltd.

Facebook-f Twitter Instagram Linkedin-in Youtube Pinterest-p Whatsapp Telegram

Get StockEdge App

No Result
View All Result
  • Home
  • Article Categories
    • Trending Stocks
    • Insights
    • Technical Analysis
    • Fundamental Analysis
    • StockEdge Tutorials
    • Mutual Fund
  • Stories
  • Products
    • StockEdge Premium
    • StockEdge Pro
    • StockEdge Club
  • Visit StockEdge.com

© 2024 Kredent InfoEdge Pvt Ltd.

Get 20% off on StockEdge Premium.