Table of Contents
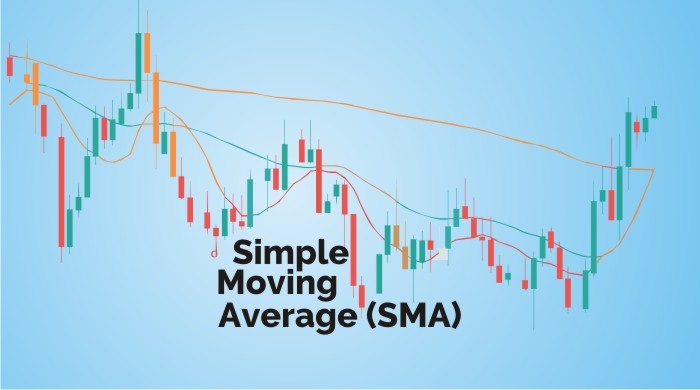
Simple Moving Average is a type of moving average which is one of the core technical indicators of technical analysis.
It is calculated by simply calculating the average price over a particular period.
It is known as the “moving” average as average value keeps changing along with the chart.
Let us discuss this indicator in details:
What is Simple Moving Average?
The Simple Moving Average is the most popular technical analysis tool that is used by traders. The Simple Moving Average (SMA) is used for identifying trend direction, and can also be used for generating potential buy and sell signals.
The formula for calculating Simple Moving Average is :
Simple Moving Average (SMA) = P1 + P2 + P3/No of periods
Where P is the price of the stock.
To know more about Simple Moving Average, you can watch the video below:
Using Simple Moving Average in Stockedge App:
Above we have discussed the moving average, now let us discuss how can we use this technical indicator to filter out stocks for trading:
In StockEdge there are many Simple Moving Average scans available for filtering out stocks for trading:
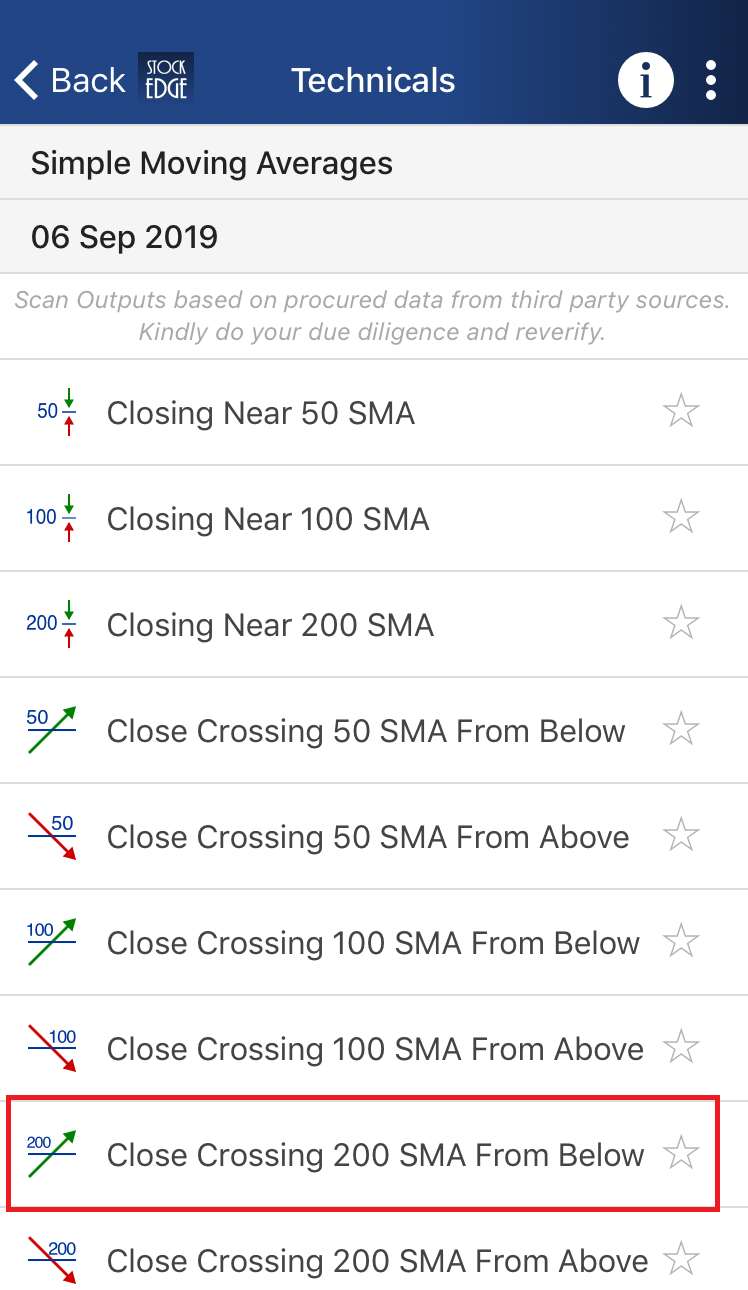
Here is a snapshot of the Simple Moving Average scans:
In StockEdge we have multiple SMA scans.
For a daily timeframe, a trader can use 5, 20 and 50 SMA.
For a long time period like weeks and months, a trader can use 100 and 200 SMA.
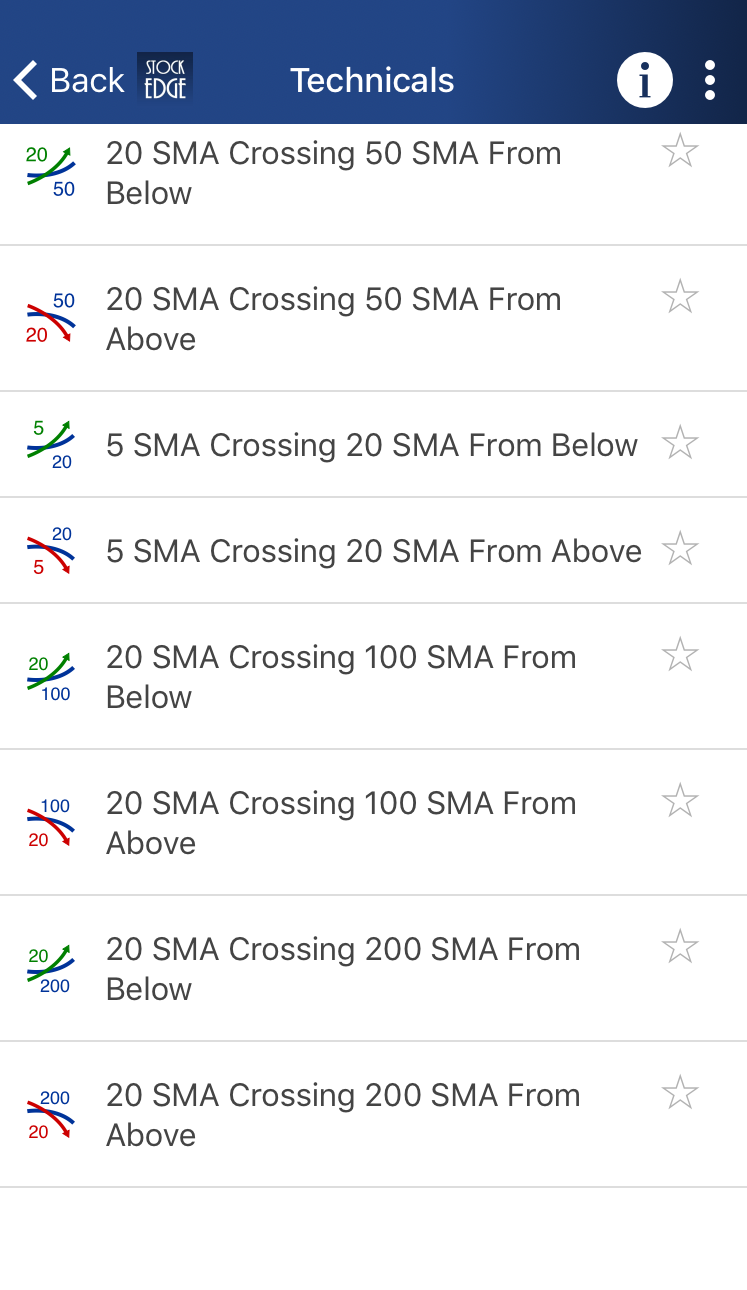
Now let us discuss some of the scans and how can it generate buy and sell signals with it:
A. Close Crossing 200 SMA from Below:
We generally use 200 SMA for longer timeframe trade. This scan indicates that the 200 days SMA has crossed the prices from below.
This is a bullish scan and it indicates that the stock has turned bullish and one can make a buy position in this stock.
After clicking on this scan one can see a list of stocks which has fulfilled these criteria:
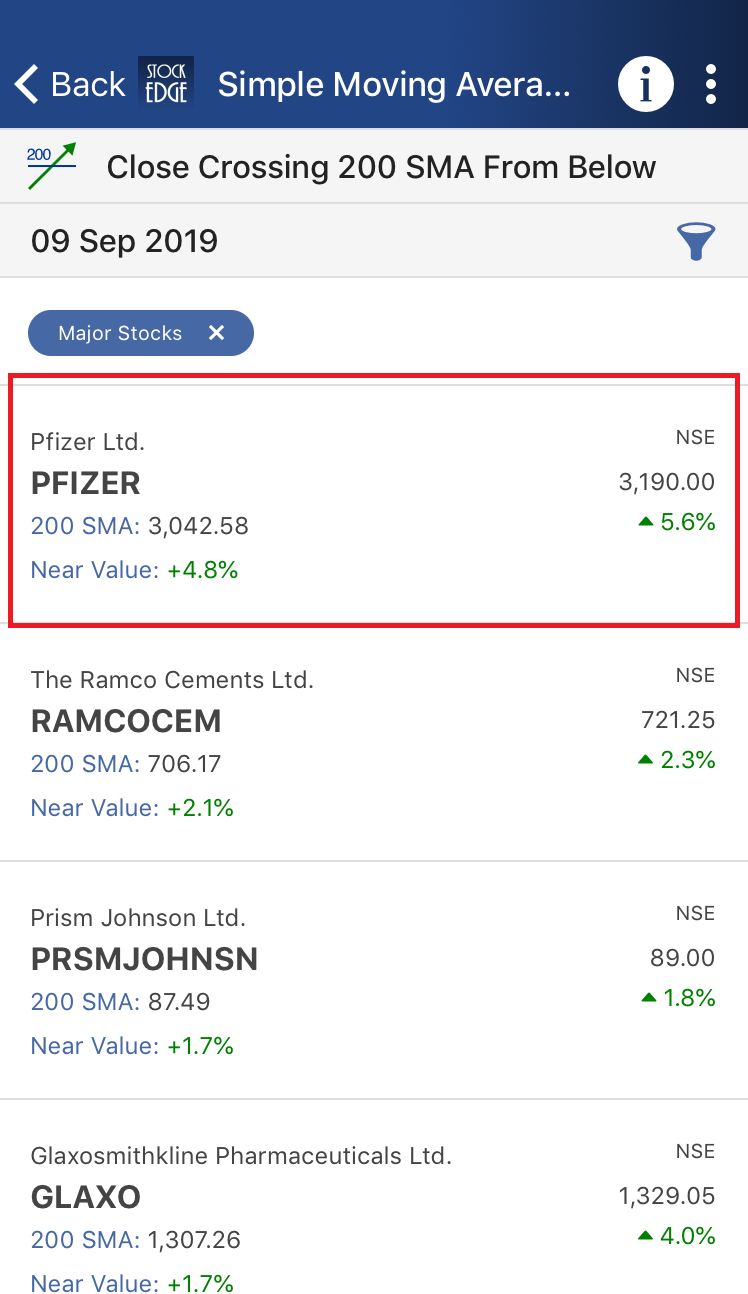
From the above image, we can see the list of stocks which fulfil this criterion.
On clicking on the particular stock we get the technical chart with 200 SMA plotted on the prices as below:
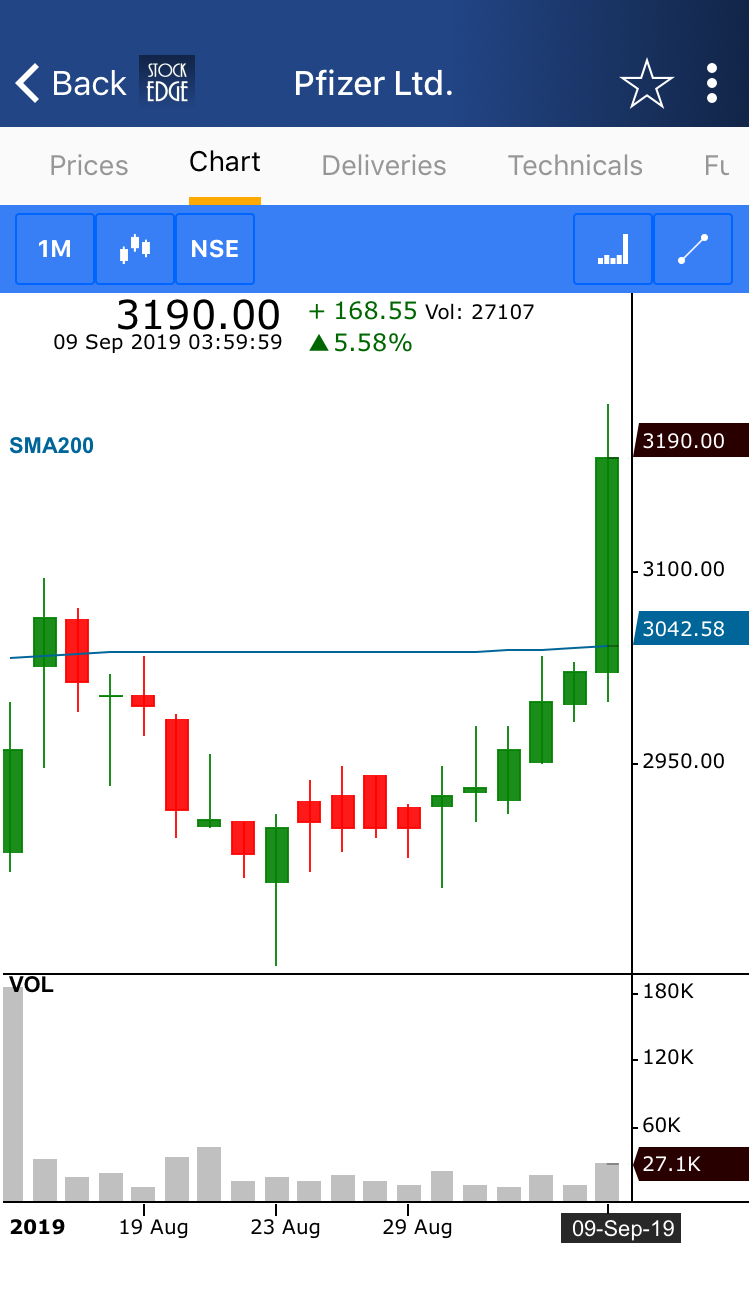
From the technical chart above we can see how the 200 SMA has cut the prices from below and give a bullish indication.
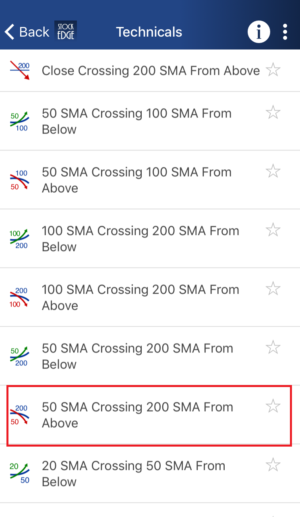
B. 50 SMA Crossing 200 SMA from Above:
One can also get buy or sell signals from the crossover of two SMAs when a shorter period SMA crosses longer period from above or below.
When a shorter period crosses longer period SMA from above it generates a bearish signal and when a longer period crosses shorter period SMA from below it generates bullish signal.
This scan indicates that the 50 SMA has crossed the 200 SMA from above.
This is bearish scan and it indicates that the stock has turned bearish and one can short this stock.
After clicking on this scan one can see a list of stocks which has fulfilled this criterion:
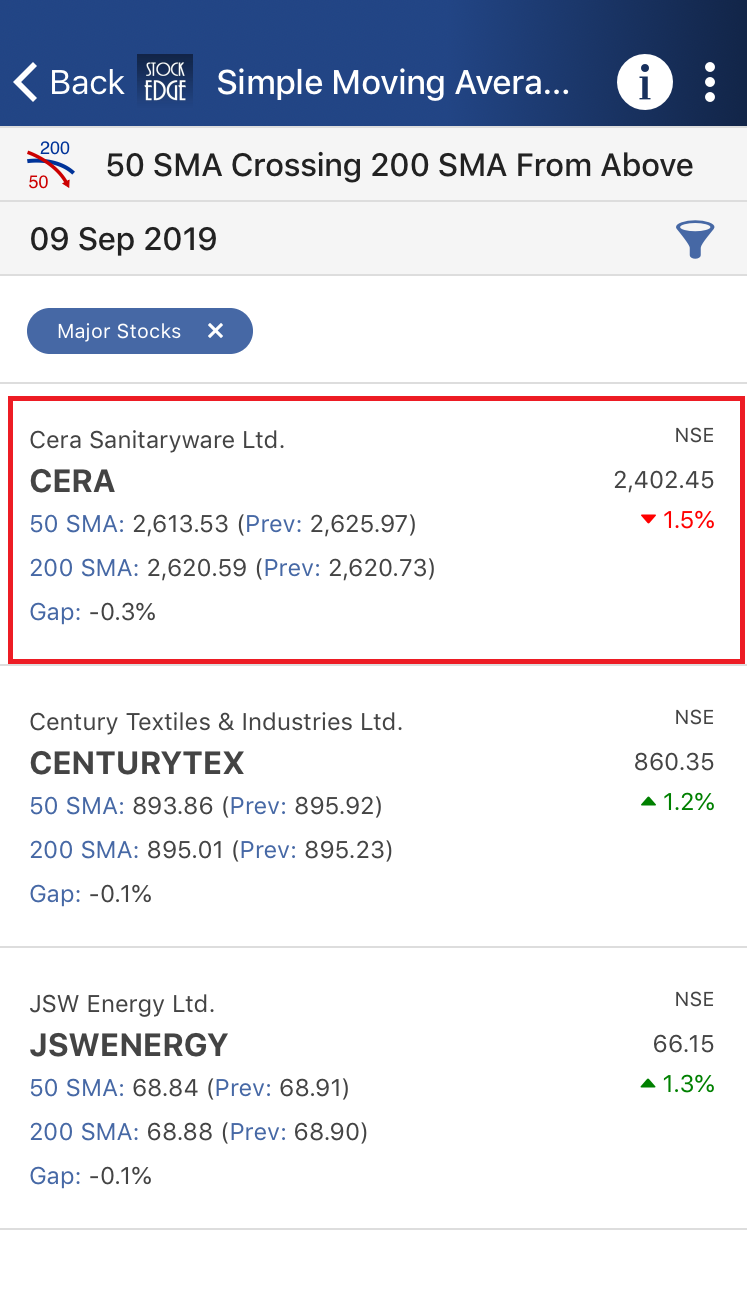
From the above image, we can see the list of stocks which fulfil this criterion.
On clicking on the particular stock we get the technical chart where we can see how 50 SMA is crossing 200 SMA from above and giving a bearish signal:
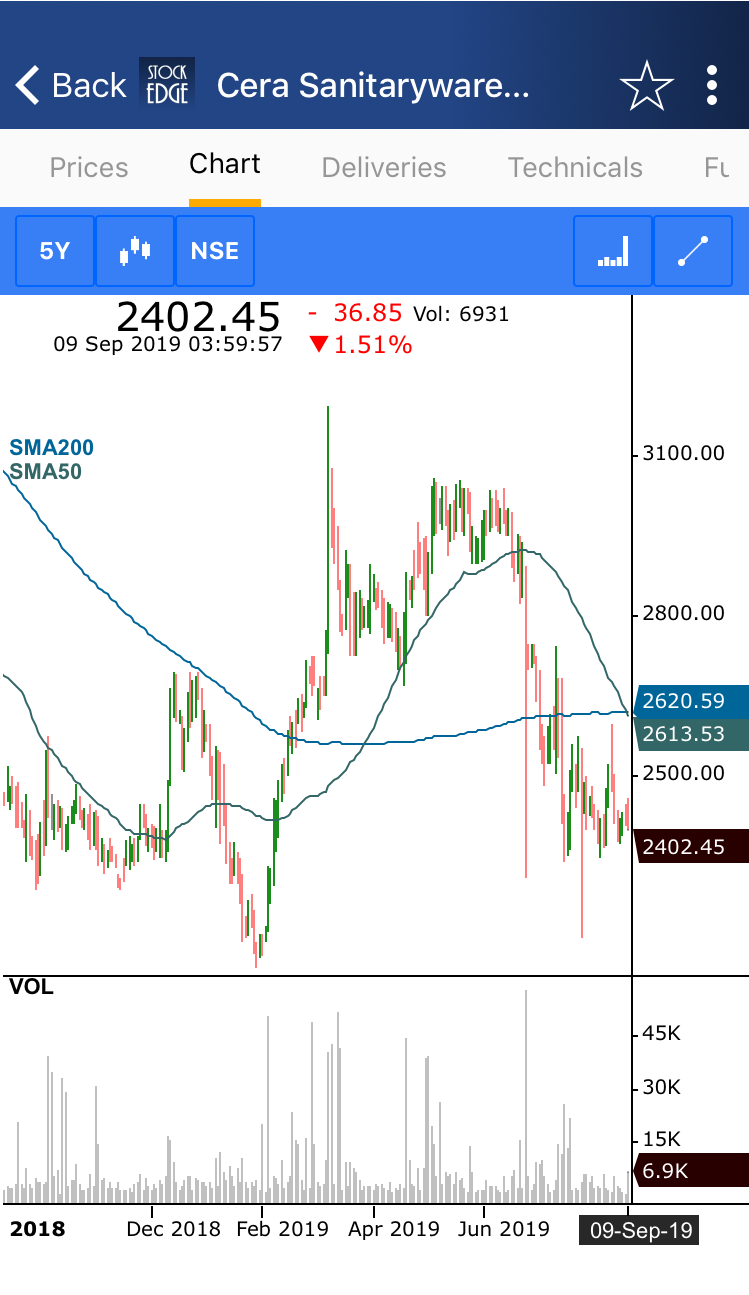
Check Out Also: Narrow Range Scans
Above are examples of the SMA scans that generates buy and sell signals and also give us a list of the stock which fulfils the criteria of the particular day.
You can filter out the stocks and can trade accordingly using these scans.
Simple Moving Average scans is one of the free tool offered by StockEdge App which you can download from here.
Interactive charts are only available for paid subscribers. You can check out our subscriber plans from here.
To have a comprehensive idea of Simple Moving Average, click here.


