Table of Contents
Here we are again, with another engrossing feature called ‘Investment Ideas’. Already a lover of our Case Studies? The new feature ‘Investment Ideas’ is the cherry on the cake. Use this feature to effortlessly filter out stocks nearing Key Levels and take investment decisions.
Here is a short brief on Edge Reports and Case Studies followed by a deeper understanding of the new feature ‘Investment Ideas’.
As is known, Edge Reports is one of the most prominent features of StockEdge. These are analytical and informative reports prepared by the StockEdge Analyst Team. The reports are categorized into Case Studies, ConCall Analysis, InfoGraphics, and IPO Notes. Our in-house experts and analysts briefly analyze stocks and present their findings in the form of descriptive and statistical data through these reports. These reports are prepared with utmost thoroughness and present a detailed analysis of stocks in an extremely informative yet simple manner that is easy for the user to understand.
Let’s dive into the details of Case Studies.
CASE STUDIES
A Case Study is a well-crafted research report giving a 360* view of a company and its financials. The reports discuss the fundamental indicators of a stock and the analyst’s interpretation of it. On reading these reports, users will understand the fundamental aspects of a stock. The report is accompanied by a spider chart having 6 variables and an EdgeMeter.
The 6 variables are Growth, Profitability, Efficiency, Solvency, Valuation, and Quality and an Edge Meter is a graded measurement of these variables of a stock on a scale of 1 to 5, with 5 denoting the highest rating. The sum of each variable’s Edge Meter results in an Edge Meter Score out of a total of 30 Edge Meter points, and a high score indicates a positive outlook of the stock.
INVESTMENT IDEAS
A new feature called Investment Ideas has been implemented in the Analytics section of our platform. In this section, users will get a list of stocks that the StockEdge Analyst Team is optimistic about and the case studies prepared on them along with an overview of the related Spider Chart, Edge Score points, Key Level and Gap.
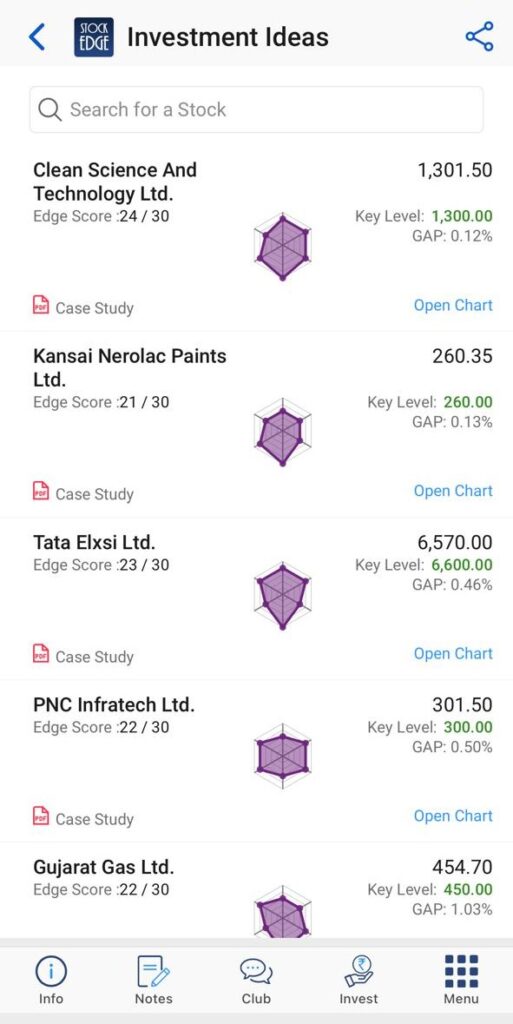
Significance of Key Level
On the basis of our fundamental analysis, we provide key upside and downside levels in case studies. The colors green and brown signify key downside and upside levels, respectively. The same has now been highlighted in the Edge Chart to provide a better visual aid.
Significance of Edge Score
The edge score provided here is taken from the Case Study (available under Edge Reports). In our case studies, we analyze a company on the basis of six parameters to provide a rating out of 30. The spider chart adjacent to Edge Score is a visualization of the same.
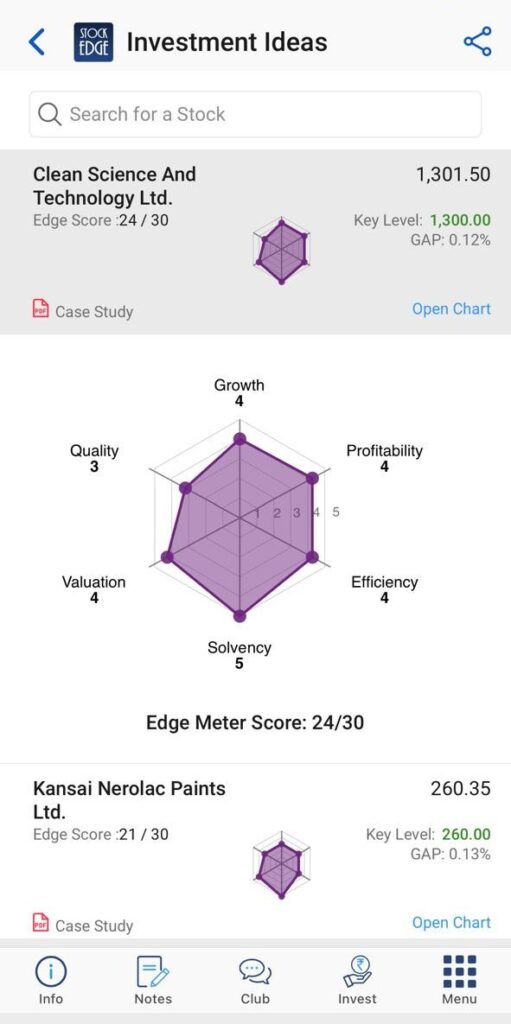
Significance of Gap
Gap indicates the percentage difference between the Key Level and the Last Traded Price. The lower gap indicated the stock is trading close to any of the key levels indicated in the case study. The key level might be a lower level or an upper level.
How to use it?
Investable stocks on this page are sorted in ascending order of difference between key level and LTP i.e. any stock trading near its mentioned key level would by default appear on top.
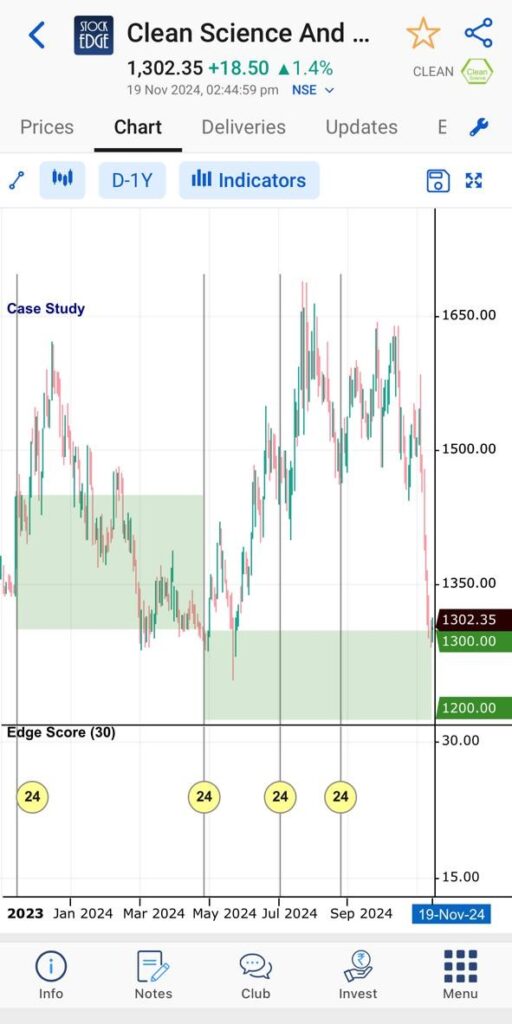
On clicking on any stock in the Investment Ideas section, a user will be redirected to the Edge Chart with the Case Study Levels plotted on them. These levels relate to the Support and Resistance levels for a stock on the basis of the latest case study published on it.
From a graphical aspect, a green-shaded region on the graph indicates a support price range while a single green line indicates a single support price level. Similarly, a brown shaded range indicates a resistance price range while a single brown line indicates a single resistance price level. Users get an indication of the support and resistance range of a stock through this feature.
The StockEdge Analyst Team puts in a tremendous effort to create each report and it is done with absolute thoroughness with the aim of making every user financially literate. That being said, every user must do their own research before investing in the markets.
So what are we waiting for start picking winning stocks ideas and invest accordingly by studying these interactive edge charts and detailed reports published on each of the stocks in the case studies section of Edge Reports.
Investment Ideas is one of the paid tools offered by the StockEdge app.
Check out StockEdge’s Premiuhttps://stockedge.com/premiumm Plans to get the most out of it.
Visit StockEdge to get customized reports and various scans.
For more blogs visit the blog section of StockEdge.




The new conseft is very nice ….(7.1 versions).it’s very helpful for investment
After recent upgrades the app is taking more response time, sometime very long.