StockEdge.com
  • Products
    • StockEdge Premium
    • StockEdge Pro
    • StockEdge Club
  • Stories
StockEdge Blog
  • Trending Stocks
  • Insights
  • Technical Analysis
  • Fundamental Analysis
  • StockEdge Tutorials
  • Mutual Fund
No Result
View All Result
  • Trending Stocks
  • Insights
  • Technical Analysis
  • Fundamental Analysis
  • StockEdge Tutorials
  • Mutual Fund
No Result
View All Result
StockEdge
Home Tutorials Technical Tutorials
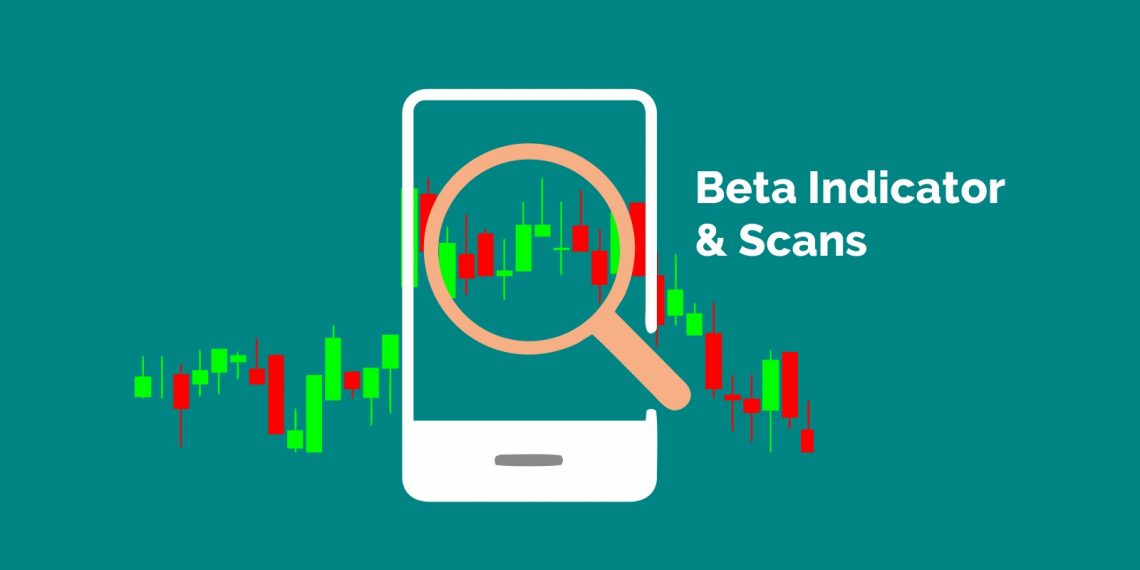
A image of a phone in a magnifying glass showing candlestick chart and a text written beta indicator & scans in green color.

A Powerful Technical Indicator Beta & Beta Scans

StockEdge by StockEdge
January 4, 2024
Reading Time: 4 mins read
7.6k
VIEWS
Share on FacebookShare on XShare On WhatsApp

The Beta of a stock measures the stock’s volatility compared to the market or the benchmark index. It measure’s the price sensitivity of a stock in relation to a related benchmark index. The beta of an individual stock gives market participants an indication of how risky the stock is.

Beta is calculated as:

Beta = Correlation of Stock Price Return and Index Price Return * (Standard Deviation of Stock Price Return / Standard Deviation of Index Price Return)

The time frame and periodicity used to calculate beta is not fixed and can be altered based on the user’s needs. At StockEdge, we have calculated it using daily price returns for a period of one year. It gives an indication whether a stock will move in the same direction as the market and how risky or volatile it is in relation to the market. The beta of a market or the benchmark index is always 1.

A stock’s beta can be greater than 1, equal to 1, less than 1 and even 0. A value greater than one indicates that the benchmark index and the market will move in the same direction but the stock will be more volatile than the index while a value less than 1 indicates that the benchmark index and stock will move in the same direction but the stock will be less volatile than the index.

A negative value indicates that the price returns of the benchmark index and stock are inversely related and will move in opposite directions. For eg: Value of 1.4 indicates that the stock is 40% more volatile than the market and of 0.4 indicates that the stock is only 40% as volatile as the market.

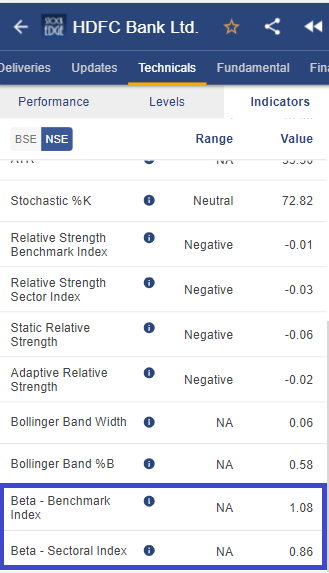
On StockEdge, with the new version update, free and paid users both can now see this useful information in the Technicals page under the Indicators tab. This value will be available against the benchmark index as well as the related sectoral index. Benchmark Beta will give users an idea of how volatile the stock is in relation to the overall market or the benchmark index. The Sectoral Beta will help users to conduct a deeper study to understand how volatile the stock is compared to the sector as a whole.

A screenshot of a stock market app displaying various technical indicators for hdfc bank ltd. The indicators include stochastic %k, relative strength sector benchmark, static relative strength, bollinger band %b, beta - benchmark index, and india vix.

To aid equity research further, StockEdge is releasing 6 new scans for its paid users. These scans are:

1.       High Beta – Benchmark Index: This scan will filter out stocks whose value is greater than 1.4 against the benchmark index.

2.       Low Beta – Benchmark Index: This scan will filter out stocks whose value is less than 0.3 against the benchmark index.

3.       Negative Beta – Benchmark Index: This scan will filter out stocks whose value is negative against the benchmark index.

4.       High Beta – Sectoral Index: This scan will filter out stocks whose value is greater than 1.4 against the sectoral index.

5.       Low Beta – Sectoral Index: This scan will filter out stocks whose value is less than 0.3 against the sectoral index.

6.       Negative Beta – Sectoral Index: This scan will filter out stocks whose value is negative against the sectoral index.

The stockedge with a list of technical scores for a stock. The list is divided into four sections: high beta - benchmark index, low beta - benchmark index, high beta - sectoral index, and low beta - sectoral index.

It is an important indicator while doing equity research. At StockEdge, we continuously believe in improving the user’s experience and making the users more financially literate and introducing such useful information and feature is an attempt to move a step further to meet our objectives and goals. If you enjoy using StockEdge, don’t hold back from sharing it with your loved ones.

Check out StockEdge’s Premium Plans to get the most out of it.

Also, keep watching this space for our midweek and weekend editions of ‘Trending Stocks‘ and ‘Stock Insights‘.

Tags: betabeta scanscorrelationtechnical indicator
ShareTweetSend
Open A Zero Brokerage Account In Kotak Open A Zero Brokerage Account In Kotak Open A Zero Brokerage Account In Kotak
Previous Post

StockEdge Version Update 7.4 – Enhancing your Investment Journey

Next Post

How is Cosmo Films Ltd. planning to change the packaging landscape?

StockEdge

StockEdge

StockEdge is a self-help Equity and Mutual Fund research tool. It empowers retail investors to identify investment opportunity with all the necessary data and analytics.

Next Post
A graphic design featuring the logo and name of “stock insights” on the left side, and “cosmo films ltd. ” with its logo and tagline “engineered to enhance” on the right, set against a bright yellow background with angular design elements

How is Cosmo Films Ltd. planning to change the packaging landscape?

A image of a line graph and a text put call ratio (pcr) scans in a blue background.

Introducing Put-Call Ratio a Derivative Indicator in the Market

A graphic representation with logos of trending stocks in a gradient background of red and orange.

3 Stocks with positive relative strength

Comments 2

  1. Avatar of thakur arun pal singh THAKUR ARUN PAL SINGH says:
    3 years ago

    Wow that’s Great to add Beta Scan. Heartiest Gratitude 🌹

  2. Avatar of uma Uma says:
    3 years ago

    Thank you

Disclaimer

StockEdge (Kredent InfoEdge Pvt. Ltd.) is a SEBI-registered Research Analyst (RA) entity (SEBI Registration No: INH300007493). The information provided in this article is for educational and informational purposes only and should not be considered as an offer to buy or sell any securities or investment products.

The stocks, securities, and investment instruments mentioned herein are not recommendations under SEBI (Research Analysts) Regulations, 2014. Readers are advised to conduct their own due diligence and seek independent financial advice before making any investment decisions.

Investments in securities markets are subject to market risks. Please read all related documents carefully before investing. Investing in Equity Shares,
Derivatives, Mutual Funds, or other instruments carry inherent risks, including potential loss of capital. StockEdge (Kredent InfoEdge Pvt. Ltd.) does not provide any guarantee or assurance of returns on any investments. Past performance is not indicative of future performance.

Contact Us
  • Timing (Mon-Sat): 10 am to 7 pm
  • Sales: +919830994463
  • Support: +919830994402
  • Club Support: +916289906895
  • Affiliate: +917003567131
Recent Posts
2 Ethanol Stocks in India
Top 2 Ethanol Stocks in India
Check out the Top 3 Consumption Stocks in India
Top 3 Consumption Stocks in India
Important Links
  • StockEdge.com
  • StockEdge Premium
  • StockEdge Pro
  • StockEdge Club
  • Compare Plans
An Initiative Of
Logo of KREDENT INFOEDGE with SEBI Registration no.

© 2025 Kredent InfoEdge Pvt Ltd.

Facebook-f Twitter Instagram Linkedin-in Youtube Pinterest-p Whatsapp Telegram

Get StockEdge App

No Result
View All Result
  • Home
  • Article Categories
    • Trending Stocks
    • Insights
    • Technical Analysis
    • Fundamental Analysis
    • StockEdge Tutorials
    • Mutual Fund
  • Stories
  • Products
    • StockEdge Premium
    • StockEdge Pro
    • StockEdge Club
  • Visit StockEdge.com

© 2024 Kredent InfoEdge Pvt Ltd.