Table of Contents
In today’s blog, we will analyze an Information Technology (IT) giant Tech Mahindra Stock.
The Information Technology (IT) industry in India has been growing at a faster pace for more than two decades now. The sector has witnessed several ups and downs. One such black swan event in the stock market was the Satyam Computers Scam, which was one of the largest accounting scams in India. The company was formerly the crown jewel of the Indian Information Technology (IT) industry.
In 2009, a huge corporate fraud was committed by the founder and chairman of Satyam Computer Services. The impact on its share price was devastating to many investors.
But why are we discussing Satyam Computers before starting with the analysis of Tech Mahindra stock? That’s because, in 2012, the Indian multinational technology giant Tech Mahindra acquired Satyam Computers. Today, the company offers innovative, customer-centric digital experiences, enabling enterprises, associates, and society to rise.
Company Overview
Tech Mahindra, a prominent player in the IT sector, is part of the Mahindra Group, which was founded in 1945. With a workforce of 2,60,000 employees across more than 100 countries, Tech Mahindra is a key contributor to India’s Nifty 50 index, offering innovative solutions in technology and digital transformation. Tech Mahindra Limited is an Information Technology company with over 1,50,000 professionals helping 1,247 global customers, including Fortune 500 companies.
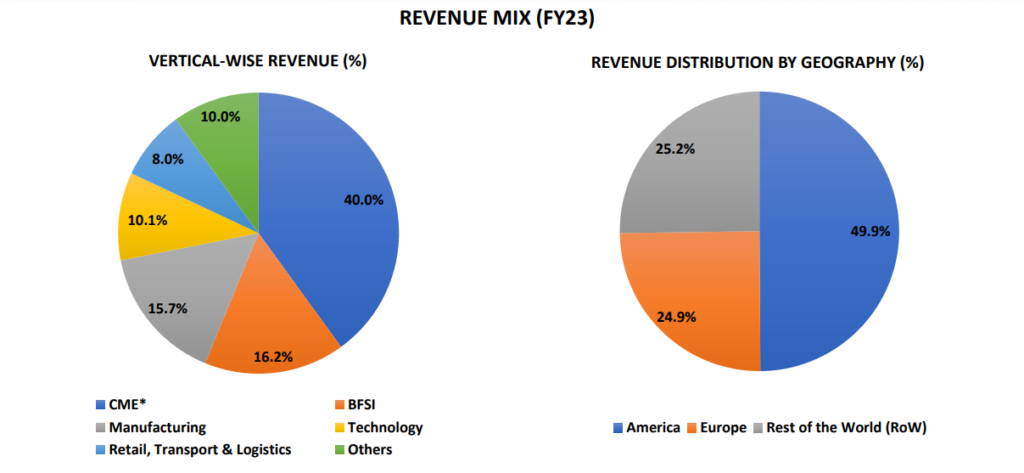
The company is operating in different verticals across the globe. Here is the company’s revenue mix as of FY23:
Sector Outlook- Information Technology (IT)
India’s IT industry is forecasted to experience robust growth, with an expected CAGR of 10%-12% over the next five years, resulting in revenues ranging from $300 billion to $350 billion. As per NASSCOM, the digital sector is anticipated to make a significant contribution, constituting 55%-60% of total technology services revenue by 2025, with an annual growth rate of 25%-30%.
With global companies increasing their technology spending to 5% of revenue by 2030, India continues to be the preferred destination for offshoring, offering cost advantages that are 3-4 times more attractive than those in the US. The future technology stack of the industry is being propelled by cloud technology, cybersecurity, AI, automation, data analytics, IoT, and robotics, with a noteworthy shift of 51% of IT spending towards the public cloud by FY26.
In summary, India’s IT industry is poised for sustained growth, driven by global digital transformation initiatives and a focus on emerging technologies.
Apart from IT sector, check which other sectors can be beneficial in 2024. Read: Top 5 Sectors for Lok Sabha Election 2024
Financial Highlights
Analyzing financial statements such as income statements, balance sheets, and cash flow statements helps investors assess the company’s ability to generate returns, manage debt, and sustain growth, enabling informed and prudent investment choices.
Income statement of Tech Mahindra Stock
The income statement, commonly known as the profit and loss statement, gives you an understanding of its financial performance, such as its sales growth, profitability, etc.
At StockEdge, we have organized the income statement in a way that will help you analyze it with ease rather than going through the conventional way of downloading the documents from the stock exchanges, which could be time-consuming and tiresome to many.
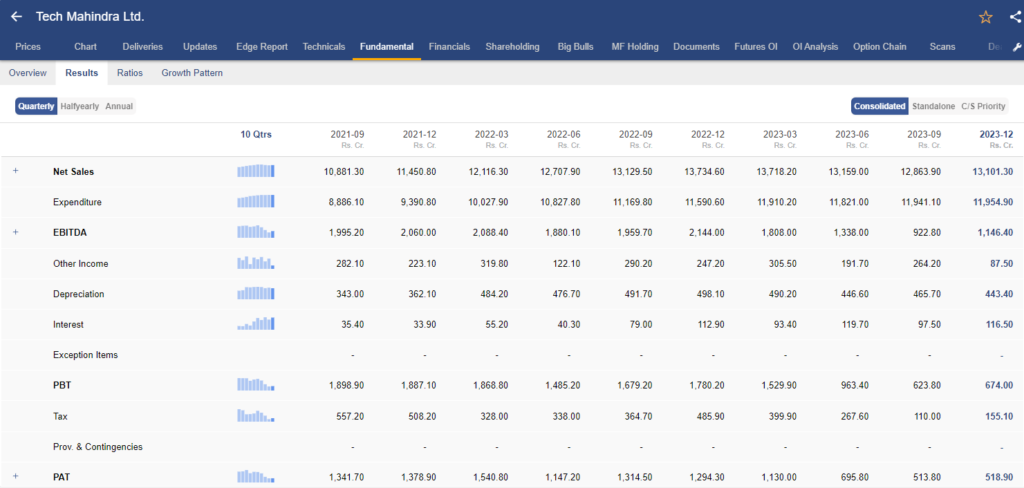
In the above image, you can see the income statement of Tech Mahindra Ltd. Every detail is in front of your eyes, starting from the top-line sales figures to the bottom-line Net profit of the company.
Sales Growth
In FY23, revenue stood at ₹53,290 crore, marking a year-on-year increase of 19.4%. This growth was widespread across verticals and geographic regions, with the Technology sector notably driving the expansion. However, the company sales dipped by 5.4% on a YoY basis, but on QoQ, it increased by 1.9% in Q3 FY24.
EBITDA Growth
EBITDA decreased by 41% YoY and 43% sequentially in H1 FY24, totalling ₹ 2,261 cr. The reorganisation of certain business units and rationalisation of non-core customer accounts and territories resulted in one-time charges that negatively impacted profitability. However, in Q3 FY24, the EBIT margin saw an increase of 70 bps on a QoQ basis. Despite the impairment of the rationalisation that took place in Q2 FY24, the margin was up due to certain one-time revenue benefits.
PAT Growth
In the first half of FY24, PAT declined by 51% YoY on account of lower revenue growth and higher expenses. Currently, employee and subcontractor costs as a percentage of revenue in Q3 FY24 stood at 56.6% and 11.5%, respectively. The same on a respective basis during Q2 FY24 was 56.8% and 12.4%. However, PAT increased by 3.6% QoQ but declined by 38.6% YoY in Q3 FY24.
Balance Sheet of Tech Mahindra Ltd.
Another important financial statement of a company is its balance sheet which provides a clear understanding of the company’s financial situation, overall financial health and stability.
The balance sheet follows the accounting equation Assets = Liabilities + Equity. Here’s a snapshot of the balance sheet of Tech Mahindra Ltd.
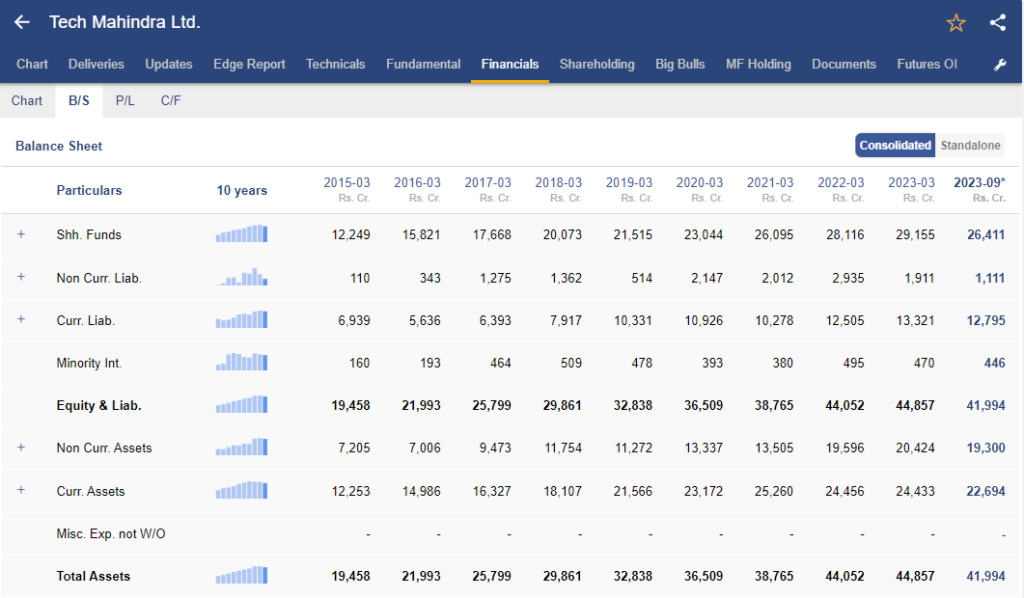
As on FY 23, the long term borrowing stand at only ₹129 cr, whereas the company has fixed asset worth ₹15051 cr
Cash Flow statement of Tech Mahindra Ltd.
A cash flow statement provides a summary of how a company generates and uses cash over a specific period of time. It has three different sections:
- Operating cash flow statement
- Financing cash flow statement
- Investing cash flow statement
Out of these the most important one being the cash flow from operations as it provides you with an understanding of how the company generated cash from its core business operations. A positive cash flow from operation signifies that the company has generated higher cash revenue than its expenditure.
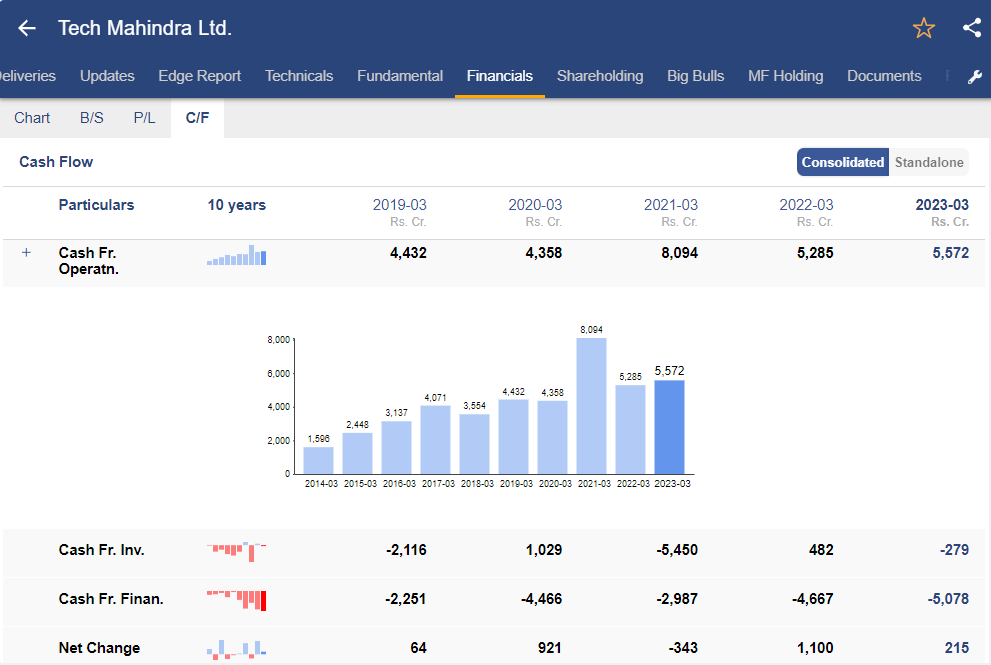
In FY 2023, the company’s CFO amounted to ₹5,572 crore. There was an increase in trade receivables of ₹1,783.6 crore, along with a net change in other financial assets and other assets totalling ₹373.9 crores.
The cash flow from investments (CFI) was negative at ₹278.5 crore due to a net purchase of PPE and Intangible Assets amounting to ₹970 crore, and payment for the acquisition of Business and Non-controlling Interest, net of cash worth ₹1,067 crore.
The net outflow from financing activities (CFF) stood at ₹5,078 crore, primarily due to dividend payments totalling ₹4,263 crore and repayment of lease liabilities worth ₹257 crore during the year.
Tech Mahindra is a part of Nifty 50 index
Ratio Analysis of Tech Mahindra Stock
Ratio analysis of a company involves evaluating a company’s financial performance by examining certain ratios which are derived from its financial statements. It makes easy comparing the financial performance to its industry benchmarks or competitors.
Ratio has different classifications like profitability ratios, solvency ratios, return ratios and more as you can see in the image below, you can analyze all such ratios directly from StockEdge.
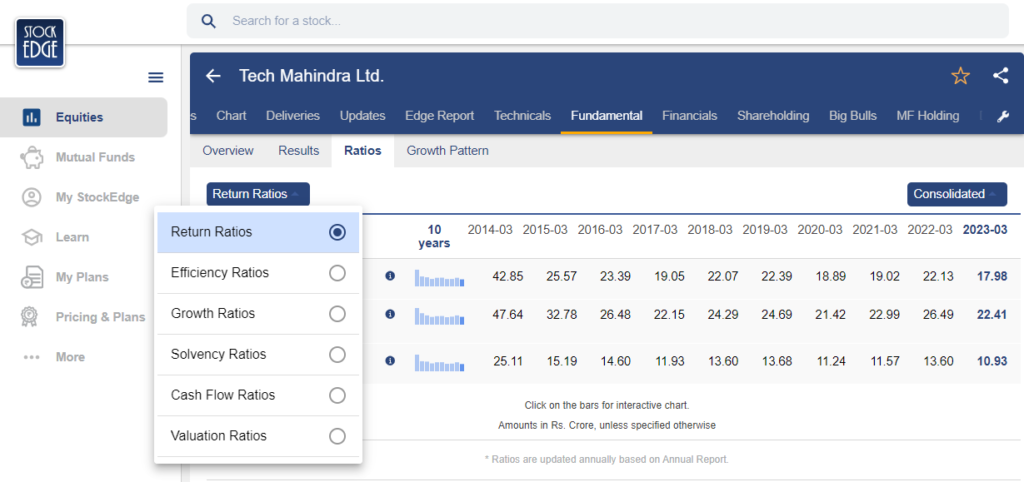
Here are the return ratios of the Tech Mahindra stock, starting with the two most important ratios which are ROE and ROCE.
What is ROE and ROCE?
ROE is a profitability ratio that measures the company’s ability to generate net income as a percentage of shareholders’ equity, whereas ROCE assesses the efficiency of a company in utilizing its total capital, including both equity and debt.
Return On Equity (ROE)
The company’s net profit decreased somewhat in FY23, which had an effect on the ROE. The ROE declined from 22.13 in FY22 to 17.98 in FY23.
Return on Capital Employed (ROCE)
ROCE had been in the range of 21%-25% from FY17-FY21. However, in FY22, it stood at 26.48% and declined to 22.41% in FY23
Debt to Equity Ratio (D/E Ratio)
The debt-to-equity ratio of Tech Mahindra stock is 0.06 as of FY23, which is generally considered to be healthy for an IT company.
Price to Earnings Ratio (P/E Ratio)
Tech Mahindra is currently trading at a TTM PE multiple of 33.2x v/s TTM industry PE of 29.2x.
Management Quality & Shareholding Pattern
The pandemic-driven acceleration in digital transformation is expected to persist, presenting new opportunities for enterprises to create value and assist clients. Leveraging their unique blend of connectivity and experience, along with strategic investments in Cloud and Engineering, the management pursues their NXT.NOW strategy.
Also, the management expects coming quarters to be slightly volatile but is hopeful of bringing in positive change soon.
The promoter’s holding remained at 35% with slight increase or decrease from quarter to quarter. In Q3 FY24, FIIs have reduced their holding whereas DIIs have increased their stake in Tech Mahindra stock.
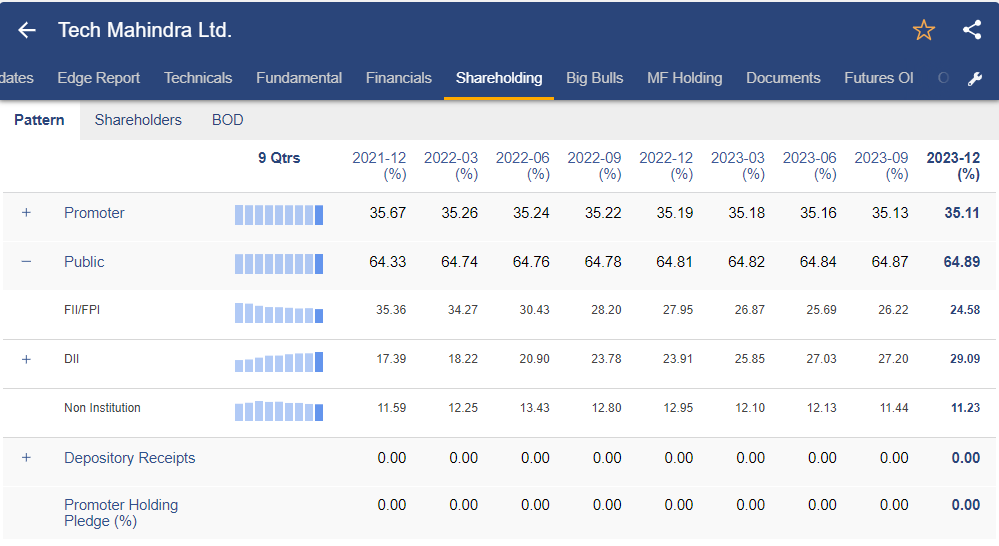
The shareholding pattern gets updated every quarter which you can check from the StockEdge app itself.
Future Outlook of Tech Mahindra stock
The company is undergoing a restructuring process, consolidating into six business units across different regions and verticals, effective January 1, 2024. They plan to unveil a strategy in April 2024 focusing on margin expansion, revenue growth, and organizational enhancements. Efforts are being made to improve performance after a challenging quarter, with strategies aimed at reducing subcontractor costs, enhancing offshore revenue, investing in technology and talent, and boosting overall utilization.
While Q3 FY24 may see some one-time effects related to non-core area rationalization, Q4 FY24 is expected to show improvement as the focus shifts to core strategic areas. Client revenue has been declining due to various factors, including rationalization and the bankruptcy of a major client, but is anticipated to improve with the implementation of new strategies. However, revenue pressures may persist in the second half of FY24.
Case Study on Tech Mahindra stock
We have a case study report prepared by our team of analysts. This fundamental report on Tech Mahindra stock provides you with a detailed analysis of the company as well as how it stands among its competitors.
Conclusion
Tech Mahindra presents a compelling investment opportunity due to its strategic restructuring efforts, which are aimed at improving operational efficiency and enhancing revenue streams. The company’s focus on margin expansion, revenue growth, and organizational improvements underscores its commitment to long-term success. With a strong emphasis on leveraging technology and talent, Tech Mahindra is well-positioned to capitalize on the growing demand for digital transformation services worldwide.


