Table of Contents
StockEdge launches its most awaited version 9.0.
We incorporate a few new features into each release that help StockEdge users better understand the financial markets.
And in this most recent version, StockEdge is happy to introduce Chart Patterns, a one-of-a-kind pro feature, along with 4 powerful and effective scans.
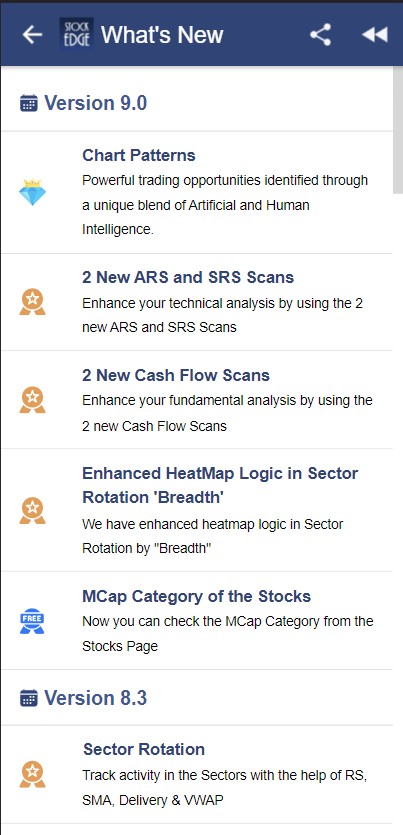
In this release, we introduce the following features to our users:
- Chart Patterns
- 2 New ARS and SRS Scans
- 2 New Cash Flow Scans
- Enhanced HeatMap Logic in Sector Rotation Breadth
- Market Cap Category of the Stocks
Continue reading for a more detailed study of the above-mentioned features:
Chart Patterns
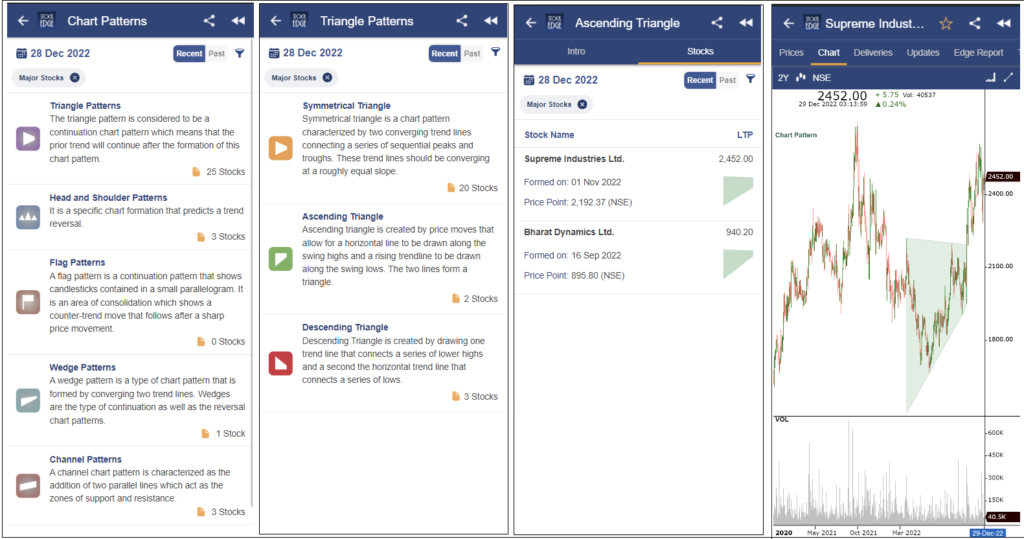
Are you familiar with the terms chart patterns, such as Triangle Patterns, Head and Shoulder Patterns, Wedge Patterns, Channel Patterns, Flag Patterns, and so on? Does this term frighten you or make you afraid of missing out on life’s opportunities?
No more freaking out and getting lost while trading because you can’t identify such chart patterns. By launching a new pro feature of Chart Patterns – a unique application of Artificial and Human Intelligence – StockEdge comes as a saviour for all those traders who are unable to identify chart patterns in stock charts to identify up and down trend patterns with just a click. Now no more investing time in finding stocks forming different patterns.
StockEdge has developed this unique feature to identify some key chart patterns in stock edge charts for you, where you will receive a list of stocks where respective chart patterns have recently formed, allowing you to capitalise on trade opportunities as soon as a chart pattern is formed.
There are 5 categories of chart patterns being provided as of now with 14 unique chart pattern types covering bullish, bearish and neutral momentum. There are different coloured icons for the varied sentiments:
Green Colour – Bullish Momentum
Red Colour – Bearish Momentum
Orange Colour – Neutral Momentum
There are 2 buttons bars –
Recent – Get a list of stocks that have recently formed the respective chart patterns and is yet to complete the anticipated momentum.
Past – Get a list of stocks that have previously formed the respective chart pattern and have likely shown the expected price movement.
Please refer to the following blog for a more detailed understanding of Chart Patterns.
2 New ARS and SRS Scans
Adaptive Relative strength is a momentum indicator that measures the strength of the price movement of a stock vis-a-vis the benchmark index (Nifty/Sensex). The benchmark date considered here has been predefined by StockEdge based on the last major market trend change date. If a Stock has performed better than the benchmark then ARS is positive, ARS 0 signifies the exact same movement of the stock and negative ARS signifies the Stock has underperformed the benchmark index.
Static Relative strength is a momentum indicator that measures the strength of the price movement of a stock vis-a-vis the benchmark index (Nifty/Sensex) in a period of 123 trading days. If a Stock has performed better than the benchmark then SRS is positive, SRS 0 signifies the exact same movement of the stock and negative SRS signifies the Stock has underperformed the benchmark index.
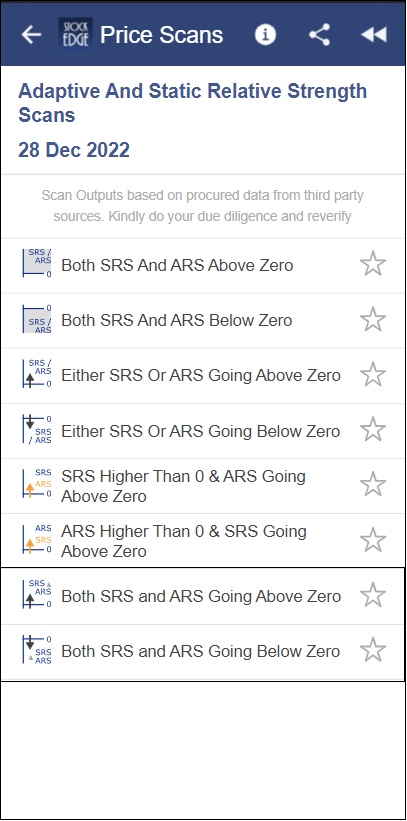
The 2 New additions to the ARS and SRS scans category are:
Both SRS and ARS Going Above Zero
As we can understand from the interpretation of SRS and ARS, as soon as the SRS and ARS values cross zero from below, it indicates the entry of stocks into the bullish zone for a potential upward momentum, i.e outperforming the benchmark index.
Both SRS and ARS Going Below Zero
As we can understand from the interpretation of SRS and ARS, as soon as the SRS and ARS values cross zero from above, it indicates the entry of stocks into the bearish zone for a potential downward momentum, i.e underperforming the benchmark index.
2 New Cash Flow Scans
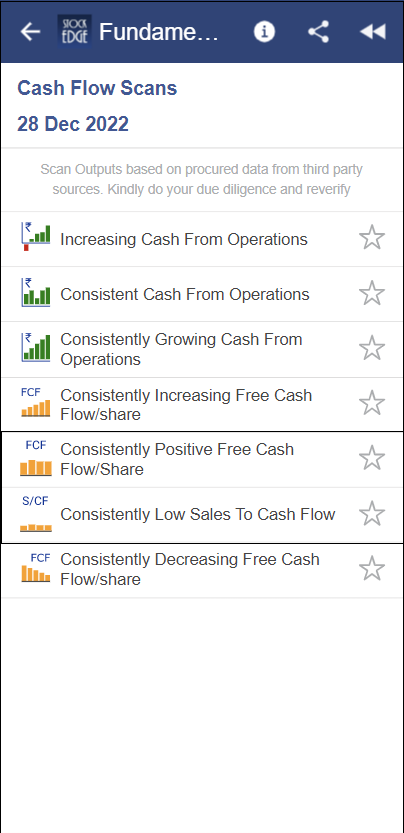
Cash Flow is a vital fundamental indicator filtering stocks with effective operations generating positive cash flows. There are 2 new additions to the Cash Flow Scans Category:
Consistently Positive Free Cash Flow per Share
Free Cash Flow is the cash left over after a company pays for its operating expenses and capital expenditures. This scan provides the list of companies that have been generating positive free cash flow for the past 4 years. Consistently Positive FCF is good for a company as it shows that the company is making more money than it needs to operate and reinvest in order to expand. It has a great deal of room to grow and is fully capable of sustaining itself.
Consistently Low Sales to Cash Flow
The sales to Cash Flow ratio reveals the ability of a company to generate operating cash flow with respect to its sales. The low Sales to Cash Flow ratio is a positive indicator as it indicates that the company is able to generate a higher amount of operating cash flow as a proportion of its sales. This scan provides the list of filtered stocks that have been registering low sales to cash flow for the last 4 years consistently.
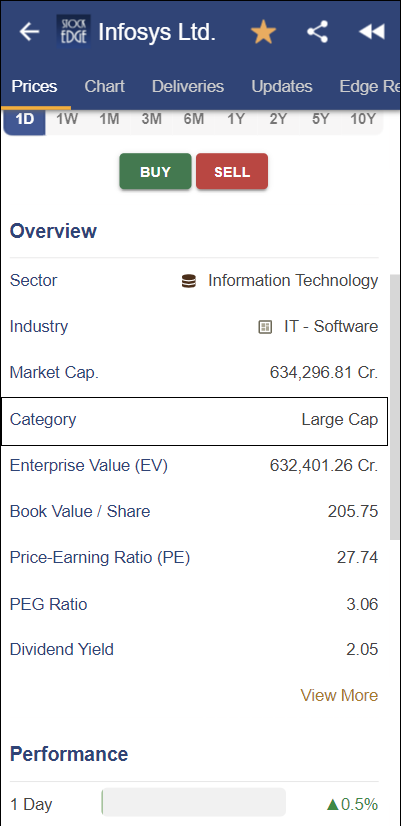
Market Cap Category in Stocks
Market capitalization measures a company’s open market value as well as the market’s perception of its future prospects, as it reflects what investors are willing to pay for its stock. Thereby, regulatory bodies have defined and categorised all stocks into three market cap categories on the basis of their market cap size. The respective market cap categories are :
- Large Cap
- Mid Cap
- Small Cap
StockEdge provides the market cap category of stocks in their respective Price and Fundamental section to better evaluate and base your investment journey.
This is it for now from Team StockEdge. We hope these features enhance your investment journey and make StockEdge more valuable.
If you enjoy using StockEdge, don’t hold back from sharing the platform with your near and dear ones.
Check out StockEdge’s Plans to get the most out of it. Also, watch this space for our midweek and weekend editions of ‘Stock Insights‘.







very useful information sir
very informative