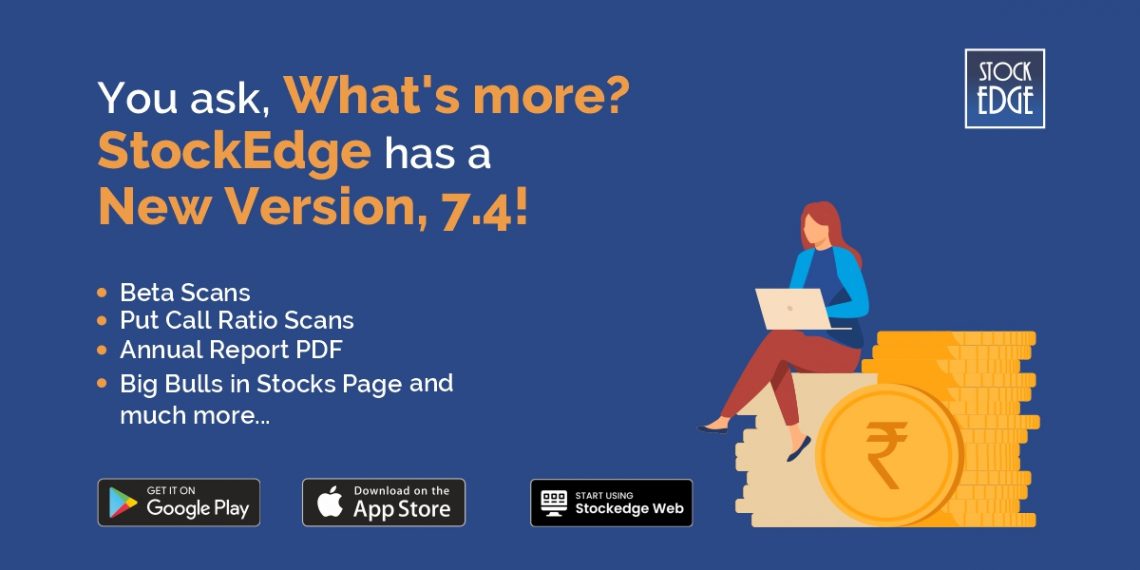
StockEdge is happy to release StockEdge Version 7.4. The version update adds truckloads of new features valuable to the users.
The new features introduced are:
· Beta Indicator & Scans
· Put Call Ratio (PCR) Scans
· Annual Reports of Stocks under Documents
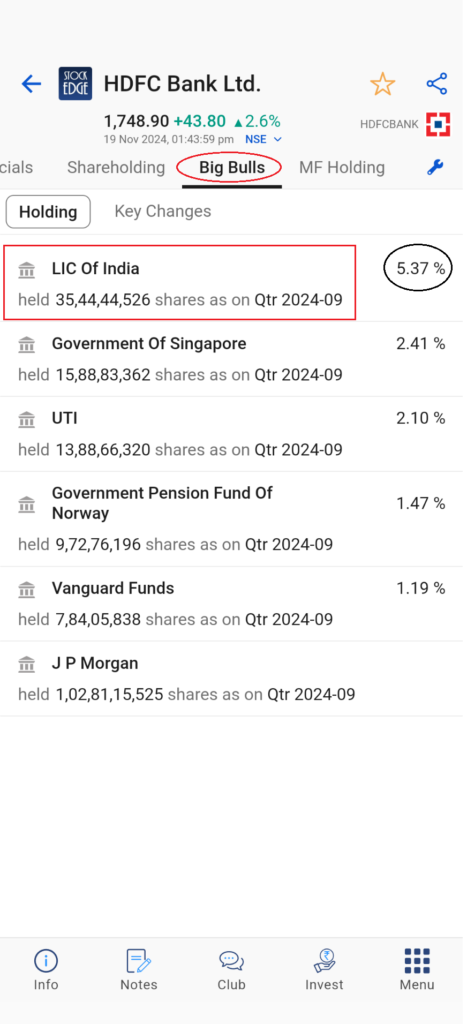
· Big Bulls Section in Stock Page
· Download 7 Day historical data of My Combination Scans to CSV
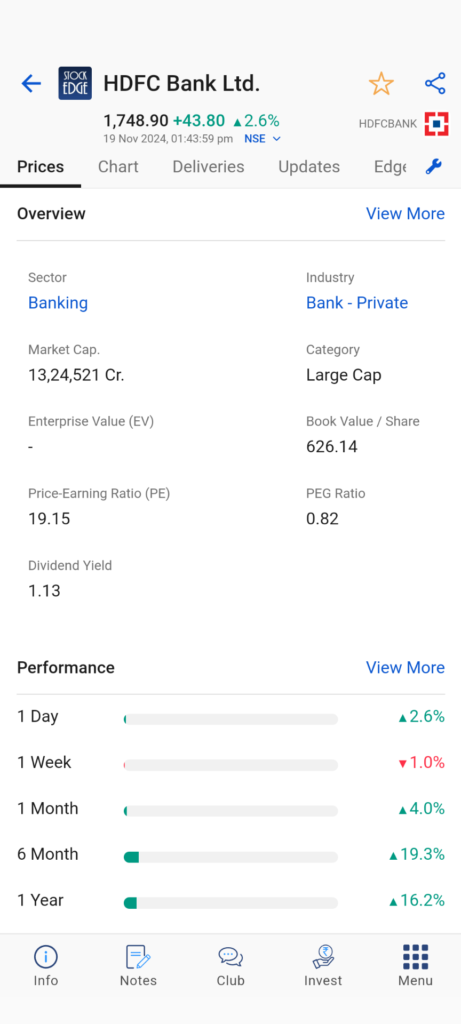
· Redesigned Stock Price page
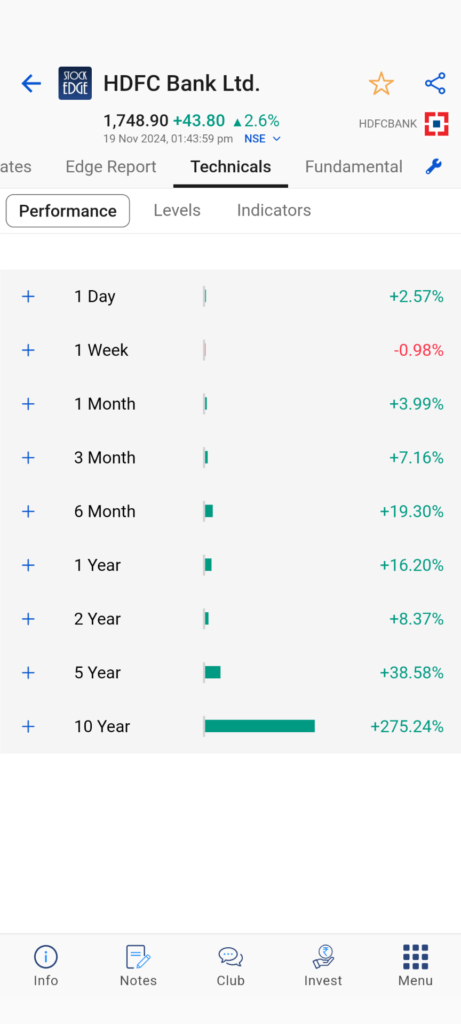
· 10 Year time period added in the Performance section
To understand the new features of StockEdge better, continue reading below.
BETA INDICATOR & SCANS:
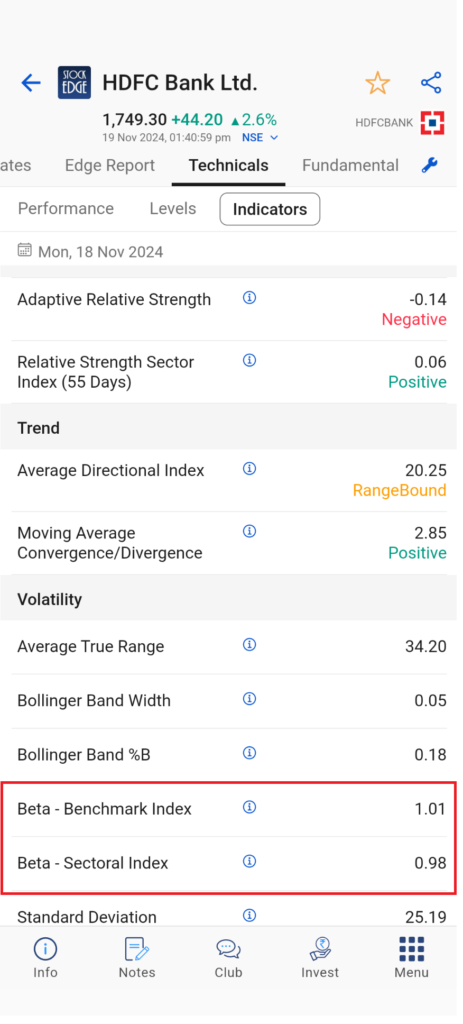
The stock’s Beta measures the stock’s volatility compared to the market or the benchmark index. It measure’s the price sensitivity of a stock in relation to a related benchmark index. The Beta of an individual stock gives market participants an indication of how risky the stock is. Beta values indicate whether a stock will move in the same direction as the market and how risky or volatile it is in relation to the market. On StockEdge, the Beta value of a stock will be available in the Indicator tab of the Technicals section of every stock.
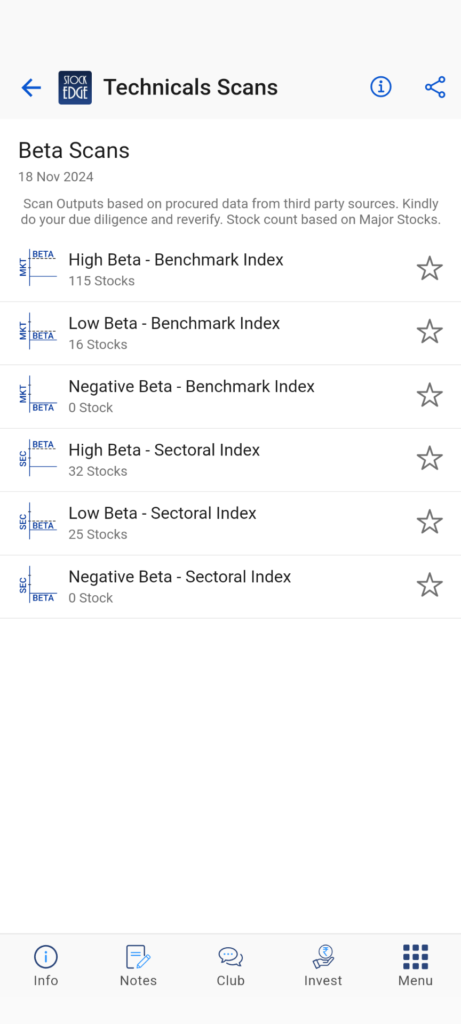
Six new Technical Scans related to Beta have also been introduced in this Version Update. They are:
- High Beta – Benchmark Index
- Low Beta – Benchmark Index
- Negative Beta – Benchmark Index
- High Beta – Sectoral Index
- Low Beta – Sectoral Index
- Negative Beta – Sectoral Index
Beta is an indicator popularly used to measure the risk of a security. It is also used as an input in the Capital Asset Pricing Model (CAPM).
PUT-CALL RATIO SCANS (PCR):
PCR is a Derivative Indicator that helps to ascertain the sentiment of the Options Market effectively. PCR is calculated by dividing the Open Interest of a Put Contract on a particular day by Open Interest of a Call Contract on the very same day. PCR serves as a contrarian indicator and is mostly concerned with Options build-up. Such an indicator helps determine the extent of bullish or bearish influence in the Market.
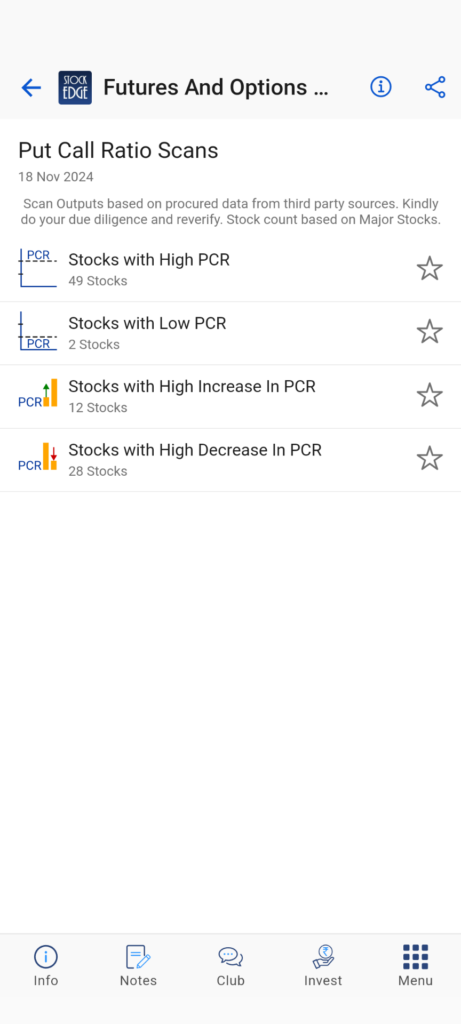
The 4 new PCR Scans that have been introduced are:
1. Stocks with High PCR
2. Stocks with Low PCR
3. Stocks with High Increase In PCR
4. Stocks with High Decrease In PCR
PCR is an important tool used by traders to gauge the overall sentiment of the market. PCR helps traders decide the price movement of an underlying security and guides them to place directional bets on the stocks.
ANNUAL REPORTS OF STOCKS UNDER DOCUMENTS:
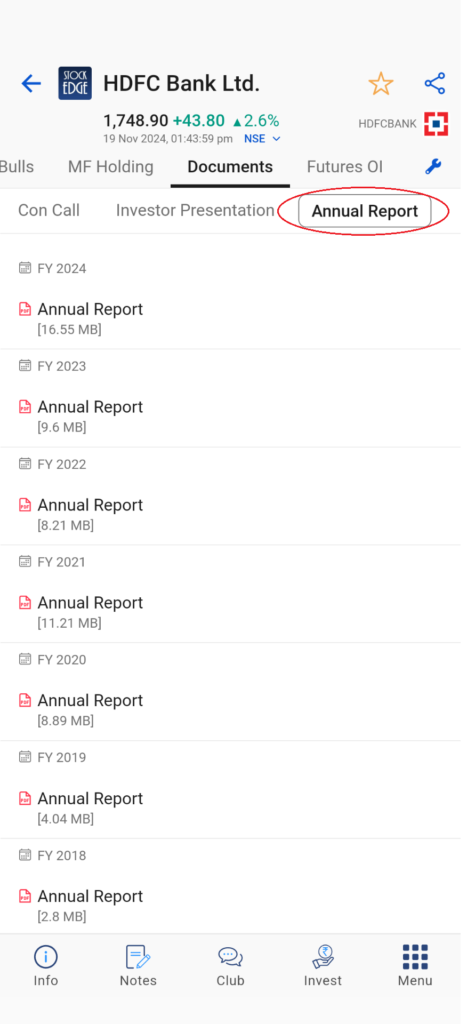
The Annual Reports of stocks will be available in the Documents Section of every stock page. Annual Reports provide important information about the operations and financial conditions of the company. They are widely referred to by investors and traders. Users will now be able to access the Annual Reports of a company very easily with the implementation of this feature.
BIG BULL SECTION IN THE STOCK PAGE:
Users will now be able to see the investors, a.k.a., the Big Bulls of every stock. Market confidence of a stock increases when a Big Bull makes an investment in the company. Users will easily be able to identify the Big Bulls of a company now.
DOWNLOAD 7 DAY HISTORICAL DATA OF MY COMBO SCANS TO CSV:
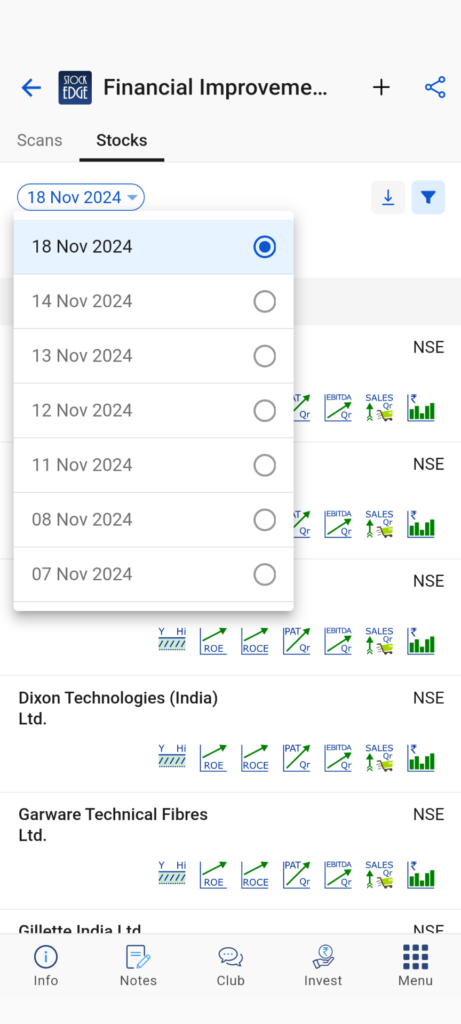
7 day Historical Data displayed on My Combo Scans can be downloaded in CSV format at the end of day daily to enhance equity research:
REDESIGNED STOCK PRICE PAGE
The Stock Price Page has been redesigned to display the important fundamentals and stock performance over different time periods along with the current stock price. A brief description about the company, Sector & Industry of the Company, Market Cap, Enterprise Value etc. will be available on the stock price page. This feature gives users the important information of a company in a concise manner.
10 YEAR TIME PERIOD ADDED IN THE PERFORMANCE SECTION:
Users will now be able to see the 10 Year performance of a stock in the Stock Price Page and in the Performance Tab under the Technicals Page. This will give users an idea about how the company has performed over 10 years.
This is it for now from Team StockEdge. We hope these features enhance your investment journey and make StockEdge more valuable to you. If you enjoy using StockEdge, don’t hold back from sharing the platform with your near and dear ones.
Check out StockEdge’s Premium Plans to get the most out of it.
Also, keep watching this space for our midweek and weekend editions of ‘Trending Stocks‘ and ‘Stock Insights‘.


