
Table of Contents
Key Takeaways of StockEdge Version 14.6
- Stock AI answers separately for a new entry and an existing holding, across short, medium and long term horizons, so the output matches the decision you are actually making.
- PE Cloud plots a stock TTM PE against the 25th and 75th percentile of its own three-year range, which turns a raw PE number into a positional question.
- The revamped Stocks tab in Sector and Industry lets you switch a whole sector between 1D and 5Y, revealing dispersion that a single sector headline hides.
- The new Fundamentals tab puts a Fundamental Score next to every constituent, so quality and recent price behaviour can be read as two separate axes.
- Universal Search now spans stocks, indices, ETFs, IPOs, mutual funds and scans, which makes overlapping exposure to one brand visible in a single query.
On 27 August 2026, over the trailing one month, HDFC Bank was down 2.6% and Kotak Mahindra Bank was up 9.2%. Both sit inside the same sector on every screener in India.
That is an 11.8 percentage point spread inside one sector, over one month. Anyone whose research stopped at banking looks strong or banking looks weak would have got the direction right and the position wrong.
Version 14.6 is built around that gap. It ships five things – Stock AI, PE Cloud inside Fundamental Scores, a rebuilt Stocks tab in Sector and Industry, a new Fundamentals tab at sector level, and a wider Universal Search. Individually they look like separate additions. Used in sequence they compress a sector view down to a stock decision without leaving the app.
1. Stock AI: The Same Stock, Two Different Questions
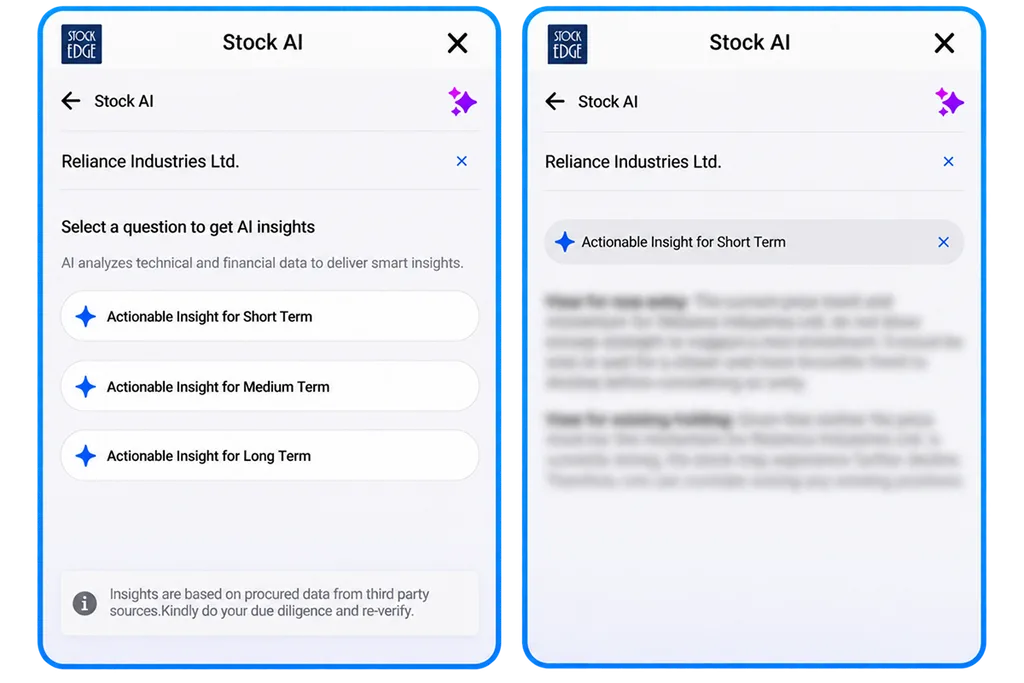
Open any stock, tap Stock AI, and you get three options rather than one verdict: an actionable insight for the short term, the medium term, or the long term. The app describes what sits underneath it plainly. It analyses technical and financial data to produce the insight.
The horizon selector matters more than it looks. A momentum reading over two weeks and a momentum reading over two years are not the same question, and a tool that collapses them into a single output is answering a question nobody asked. Splitting the horizon forces you to declare your timeframe before you read the answer, which is the correct order.
The second design choice is the more useful one. The output separates a view for a new entry from a view for an existing holding. Read that again, because most analysis tools in this category do not do it.
A stock you own and a stock you are considering are different decisions with different risk. A prospective buyer is deciding whether the entry is worth the drawdown risk from here. A current holder has already taken that risk and is deciding whether to keep taking it. Those two people can look at identical data and correctly reach opposite conclusions. Any tool that hands both of them one answer is wrong for at least one of them.
StockEdge attaches its own caveat to the feature. The insights draw on procured data from third party sources, and users are asked to do their own due diligence and re-verify. Treat that as instruction rather than boilerplate. The right way to use Stock AI is as a hypothesis generator. It tells you what to go and check. The checking happens on the data tabs, which is where the rest of 14.6 comes in.
2. PE Cloud: Valuation with a Reference Point
A PE ratio on its own tells you almost nothing. A PE of 11 is expensive for a business with falling earnings and cheap for one compounding at 25%. The number only becomes information once you know what that particular stock normally trades at.
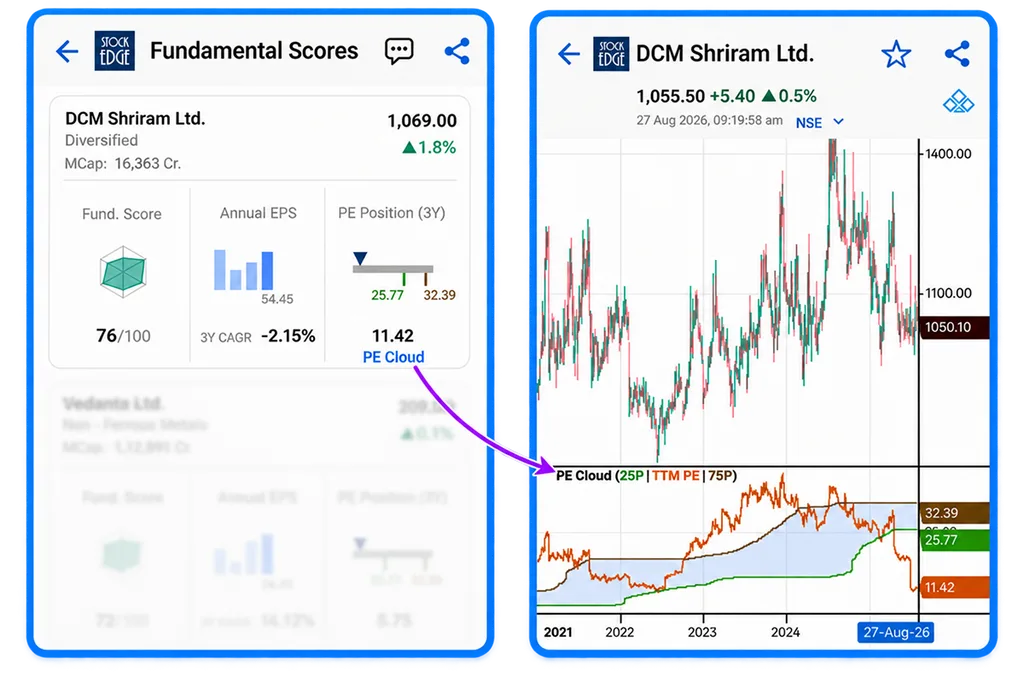
PE Cloud supplies the reference point. Inside Fundamental Scores, the PE Position (3Y) reading now opens into a chart that plots the trailing twelve month PE against the 25th and 75th percentile of the stock own three-year PE range. Price sits on the panel above, the PE line and its band sit below, on the same time axis.
Take the example on screen, used here purely to demonstrate how to read the chart and not as any view on the company. DCM Shriram Ltd. shows a Fundamental Score of 76 out of 100, a market capitalisation of Rs. 16,363 crore, annual EPS of 54.45, a three-year EPS CAGR of negative 2.15%, and a PE position of 11.42 against a three-year band running from 25.77 to 32.39.
The lazy read: it is trading far below its own three-year band, therefore it is cheap.
The read that is worth your time starts with a question about arithmetic. A PE falls for exactly two reasons. Price goes down, or earnings go up. On the chart, price moved from roughly 1,400 down to around 1,050. That is a real decline, but a fall of that size cannot on its own carry a PE from the high twenties to 11.42. Most of the movement is sitting in the denominator, which means trailing earnings rose sharply. Set that beside the three-year annual EPS CAGR of negative 2.15% and you have the actual research question: what changed in the trailing earnings line, and is it repeatable next year?
That is the whole value of a percentile band. It does not tell you a stock is cheap. It tells you the stock is priced unusually relative to its own history, and hands you the job of finding out why.
One limitation worth knowing before you rely on it. Percentile bands assume a reasonably stable earnings base. For cyclical businesses the lowest PE of the cycle typically appears at peak earnings, right before the earnings base contracts. In those cases a PE sitting below the 25th percentile is not a discount. It is a warning that the E in the ratio is about to move. Check the earnings trend before you interpret the position.
3. Revamped Stocks Tab: Where the Sector Call Falls Apart
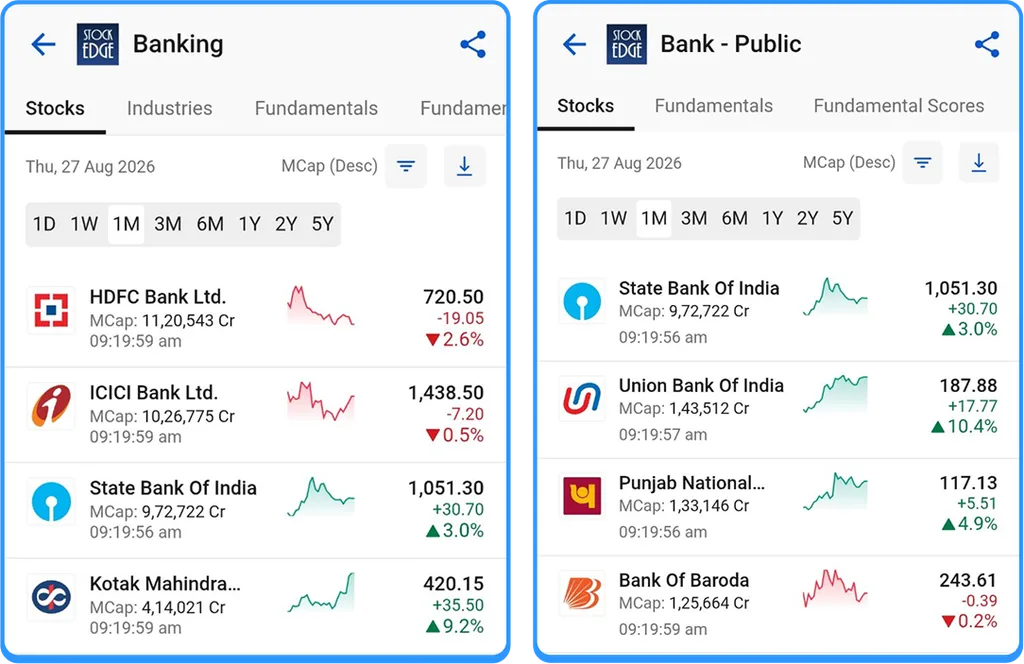
The Stocks tab inside Sector and Industry now carries timeframe toggles from 1D through 5Y, market cap sorting, an inline sparkline per stock, filters and a CSV export. Pick a timeframe and the entire constituent list re-ranks around it.
Here is the Banking sector on the one month view, dated 27 August 2026, sorted by market cap:
- HDFC Bank Ltd., market cap Rs. 11,20,543 crore, down 2.6%
- ICICI Bank Ltd., market cap Rs. 10,26,775 crore, down 0.5%
- State Bank of India, market cap Rs. 9,72,722 crore, up 3.0%
- Kotak Mahindra Bank, market cap Rs. 4,14,021 crore, up 9.2%
Now drop one level into the Bank – Public sub-industry over the same month:
- State Bank of India, market cap Rs. 9,72,722 crore, up 3.0%
- Union Bank of India, market cap Rs. 1,43,512 crore, up 10.4%
- Punjab National Bank, market cap Rs. 1,33,146 crore, up 4.9%
- Bank of Baroda, market cap Rs. 1,25,664 crore, down 0.2%
Two numbers to sit with. The Banking spread is 11.8 percentage points across four names in a month. Narrowing to public sector banks, which is about as tight a peer group as Indian equities offers, the spread is still 10.6 points. These businesses share a regulator, a rate cycle, a credit cycle and a deposit environment, and they still moved that differently over four weeks.
The practical use of the timeframe toggle is comparison, not any single reading. Run the same sector list on 1M, then 6M, then 1Y, and watch which names change rank. A stock leading the one month list but lagging the one year list is either early in a turn or bouncing inside a downtrend, and those need different handling. A stock leading both is in an established trend. That comparison used to mean opening several charts. It now takes about ten seconds.
The CSV export is the underrated piece. Pull the same sector weekly and you build your own dispersion record, which is how you start to see rotation before it shows up in a headline.
4. Fundamentals Tab: Quality & Momentum are Two Different Axes
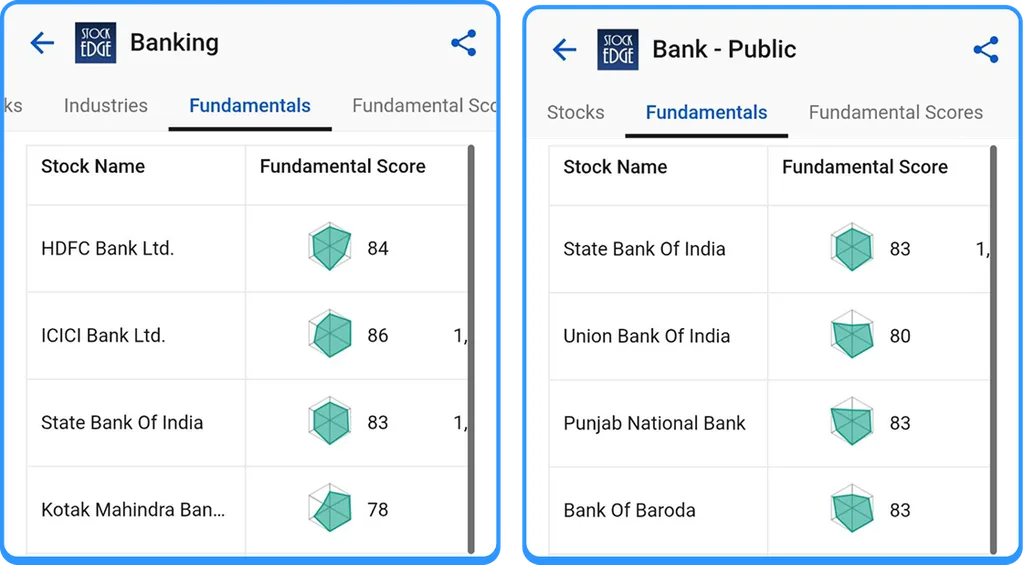
The new Fundamentals tab puts a Fundamental Score against every constituent of the sector or industry you are looking at. From the same two lists:
- Banking: ICICI Bank 86, HDFC Bank 84, State Bank of India 83, Kotak Mahindra Bank 78
- Bank – Public: State Bank of India 83, Punjab National Bank 83, Bank of Baroda 83, Union Bank of India 80
Line those scores up against the one month price moves from the previous section and the ordering inverts almost completely.
In the Banking list, Kotak Mahindra Bank carried the lowest score of the four at 78 and posted the best one month move at up 9.2%. ICICI Bank carried the highest score at 86 and was slightly negative at down 0.5%. Among public sector banks, Union Bank of India had the lowest score at 80 and the strongest move at up 10.4%, while Bank of Baroda matched State Bank of India and Punjab National Bank at 83 and was the only name in the group that fell.
That inversion is not a flaw in either number. It is the point. A Fundamental Score is an assessment of business quality and earnings durability, and it moves slowly because balance sheets move slowly. A one month price change tells you where money went recently, and it moves fast because sentiment moves fast. Over four weeks these two measures routinely disagree, and reading them as one signal is how investors talk themselves into bad positions in both directions.
Read together they give you a classification instead of a signal:
- High score with strong momentum: the market is currently agreeing with the fundamentals. The question is whether the agreement is already fully priced.
- High score with weak momentum: quality that is out of favour. Worth investigating, because this is where mean reversion candidates live and also where a deteriorating story shows up in price before it shows up in reported numbers.
- Low score with strong momentum: something is being re-rated, or something is being speculated on. You need a specific reason, and if you cannot find one, that is your answer.
- Low score with weak momentum: usually nothing that requires your attention.
One risk note. A single month of price movement carries a lot of noise. Before you classify anything, confirm the momentum reading on the 3M and 6M views, which the Stocks tab now makes trivial to check.
5. Universal Search: Seeing Your Real Exposure to a Name
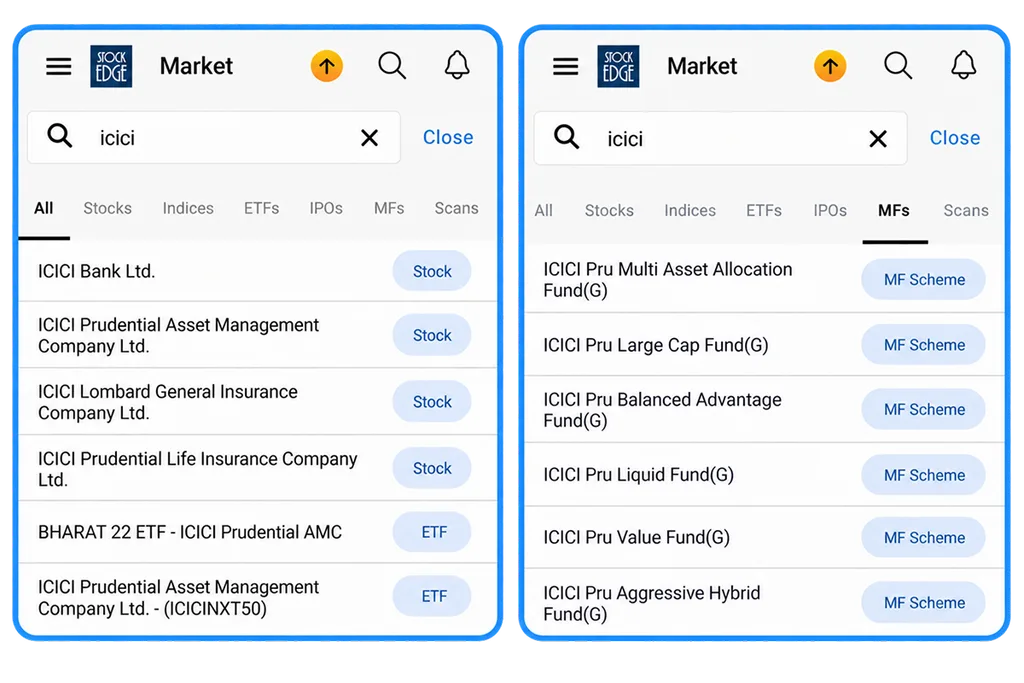
Search now returns results across All, Stocks, Indices, ETFs, IPOs, MFs and Scans. It reads as a convenience upgrade. It is quietly an exposure tool.
Search “icici” and the stocks alone include ICICI Bank Ltd., ICICI Prudential Asset Management Company Ltd., ICICI Lombard General Insurance Company Ltd. and ICICI Prudential Life Insurance Company Ltd. The ETF results include BHARAT 22 ETF from ICICI Prudential AMC and ICICINXT50. Switch to the MFs tab and you get ICICI Pru Multi Asset Allocation Fund, Large Cap Fund, Balanced Advantage Fund, Liquid Fund, Value Fund and Aggressive Hybrid Fund.
One brand, and behind it an operating bank, a listed asset manager, a general insurer, a life insurer, an ETF issuer and a full fund house. These are separate businesses with separate earnings drivers. Owning a large cap fund managed by one of them is not exposure to any of the others, and a lot of retail portfolios carry overlaps and gaps that nobody has ever actually looked at because the instruments live on different screens.
Putting every instrument type behind one query is how you find that out in a few seconds. The Scans tab in the same search bar is a smaller win in the same direction, letting you jump straight to a scan without navigating to it.
A Five Minute Routine That Uses All Five
The features are more useful in sequence than individually. One workable order:
- Open Sector and Industry, go to the Stocks tab, and run your sector on 1M, then 6M, then 1Y. Note which names hold their rank across all three.
- Drop into the relevant sub-industry and repeat. This is where dispersion inside a sector becomes visible.
- Switch to the Fundamentals tab and record the Fundamental Score for each name you flagged.
- Classify each one into the quality and momentum grid above. Most names will drop out here.
- Open PE Cloud on whatever survives and check where the current PE sits inside its own three-year band. Ask whether the position came from price or from earnings.
- Run Stock AI at your actual holding horizon, and separately for a new entry or an existing position, to see whether it surfaces anything you missed.
Then verify what matters against the filings and exchange data before you act on any of it. Every step above narrows a list. None of them replaces reading the company.
Where This Sits Among Indian Analytics Platforms
Composite scoring is no longer rare in the Indian market. Trendlyne runs a DVM system that rates every stock from 0 to 100 on durability, valuation and momentum, and in 2026 it added screener creation from plain language prompts. Tickertape offers an Investment Scorecard for quick quality assessment alongside its Market Mood Index sentiment gauge. Anyone comparing platforms will find a score on most of them.
What changes with 14.6 is the sequence rather than the existence of a score. The Fundamental Score now sits in the same tab structure as the sub-industry price table, and the valuation percentile band opens directly from the score card. The path from “which sector is moving” to “why this specific stock, at this price, versus its own history” runs through fewer screens than it used to.
It is worth saying the obvious thing about all of these systems, including this one. Every composite score compresses many inputs into a single number, and compression loses information by definition. No score on any platform is a recommendation, and none of them removes the work of understanding a business. What a good score does is tell you which twenty names out of two thousand deserve an hour of your attention.
What To Do, What To Avoid
Do
- Read the Fundamental Score and the price move as two separate axes, and classify rather than conclude.
- When a PE sits below its 25th percentile, work out whether price fell or earnings rose before you call it cheap.
- Compare 1M against 6M and 1Y on the same sector list before describing anything as a trend.
- Treat Stock AI output as a starting hypothesis and verify it against filings and exchange data.
- Export the sector CSV regularly and build your own record of how dispersion changes.
Avoid
- Applying PE Cloud to a cyclical business without checking where the earnings cycle sits, since the lowest PE often arrives at peak earnings.
- Treating one month of price movement as a trend, particularly in small and mid caps where a single month is mostly noise.
- Assuming a high Fundamental Score justifies any entry price, or that a low score rules a stock out permanently.
- Reading a sector headline and skipping the constituent level, which is where an 11.8 point spread was hiding this month.
Final Thoughts
Most app updates add screens. This one adds context to numbers that were already there. A PE becomes a percentile position. A sector becomes a list with a measurable spread. A quality score becomes something you read against price rather than instead of it.
None of it decides anything for you, and it is not meant to. The reason the same PE of 11.42 can mean two opposite things is that the data cannot answer the question on its own. What 14.6 does is get you to the right question faster.
Version 14.6 is live now. Open the StockEdge app or the web platform, run the routine above on one sector you already follow, and see what the constituent level tells you that the sector headline did not.
Suggested Read: StockEdge Fundamental Scans
FAQs
1. What are the key features introduced in StockEdge Version 14.6?
StockEdge Version 14.6 introduces Stock AI, PE Cloud within Fundamental Scores, a revamped Stocks tab in Sector and Industry, a new Fundamentals tab, and an expanded Universal Search.
2. How does Stock AI work in StockEdge Version 14.6?
Stock AI provides insights based on short-, medium-, and long-term horizons and distinguishes between a new entry and an existing holding. It analyses technical and financial data to generate the insight.
3. What is PE Cloud in StockEdge Version 14.6?
PE Cloud shows a stock’s trailing twelve-month PE against the 25th and 75th percentiles of its own three-year PE range. This provides historical context for assessing the stock’s current valuation position.
Disclaimer
StockEdge (StockEdge Fintech Private Limited, formerly known as Kredent InfoEdge Private Limited) is a SEBI-registered Research Analyst entity (SEBI Registration No: INH300007493). The information in this article is for educational and informational purposes only and should not be considered an offer to buy or sell any securities or investment products.
The stocks, securities and investment instruments named here appear solely to illustrate how the features work and are not recommendations under SEBI (Research Analysts) Regulations, 2014. Readers should conduct their own due diligence and seek independent financial advice before making any investment decision.
Investments in securities markets are subject to market risks. Please read all related documents carefully before investing. Investing in equity shares, derivatives, mutual funds or other instruments carries inherent risk including potential loss of capital. StockEdge does not guarantee or assure returns on any investment. Past performance is not indicative of future performance.
Editorial note for the desk: all price, market capitalisation, Fundamental Score and PE figures above are read from app screenshots timestamped 27 August 2026 and are point in time. If publication slips beyond a few days, refresh the Banking and Bank – Public numbers and the DCM Shriram PE Cloud values before going live, since the one month percentage moves will have rolled forward.