Table of Contents
Introducing the Latest Release of StockEdge, which Has exciting New Features!
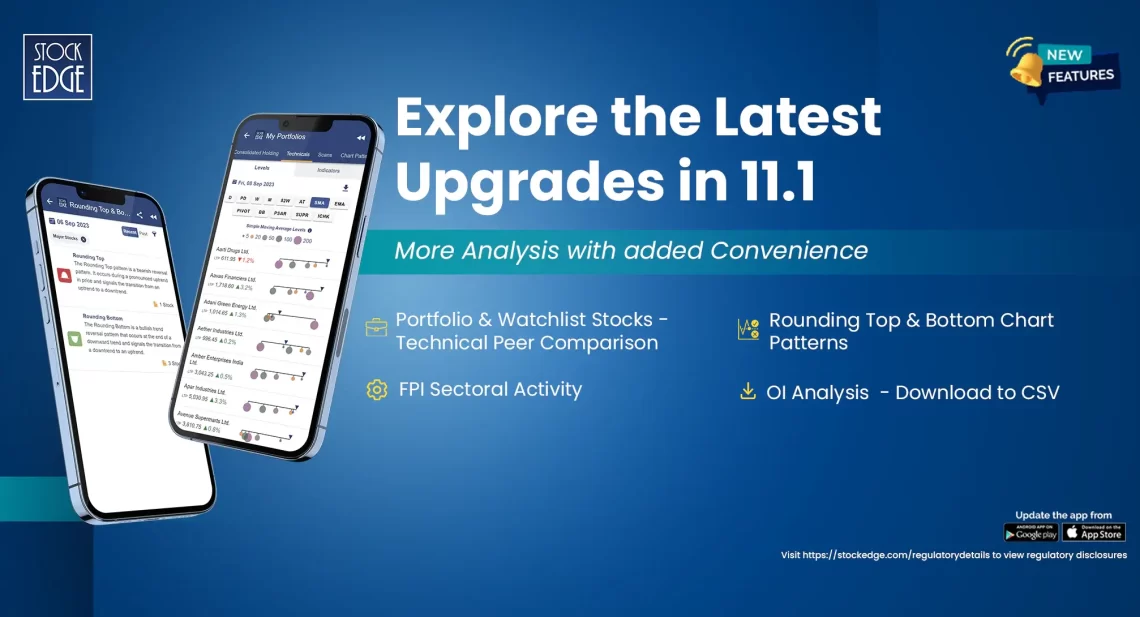
StockEdge is excited to release Version 11.1, which is full of new features and improvements to improve your stock market analysis and trading. Our purpose is to equip traders and investors with the knowledge and resources they need to make wise decisions, and this upgrade represents a substantial advancement in that direction.
For investors of all experience levels, StockEdge has been a dependable resource, offering insightful analysis, thorough market data, and simple tools for decision-making.
With the release of Version 11.1, we have made great strides in providing a service that is unparalleled in its use of advanced analytics, artificial intelligence, and a user-centric strategy.
We’ll explore the intriguing new features and enhancements that StockEdge Version 11.1 offers in this blog article. Let’s look at how this update will enable you to move more precisely, confidently, and profitably through the dynamic world of investment.
In this 11.1 release, we introduce the following most awaited features for our users:
- Portfolio Stocks – Technical Peer Comparison
- My Watchlist Stocks – Technical Peer Comparison
- Rounding Top and Bottom Chart Patterns
- FPI Sectoral Activity
- OI Analysis – Download to CSV
Continue reading for a more detailed study of the above-mentioned features:
Portfolio Stocks – Technical Peer Comparison
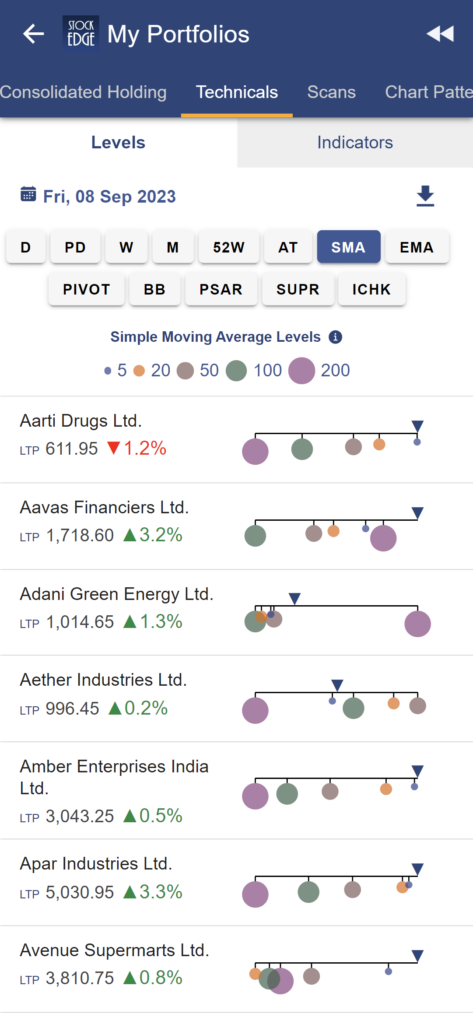
StockEdge is introducing its one-of-a-kind Technical Peer Comparison Feature in the Portfolio feature which allows users to compare the technical performance of their portfolio stocks and keep track of technical levels of the respective stocks. StockEdge allows all its users to track the technical levels on the basis of different period price levels, moving average levels, Pivot levels and other levels. Also, This feature will allow its users to keep track of varied technical indicators such as RSI, CCI, MFI, ROC and other indicators and make informed decisions on the basis of demand zones.
Watchlist Stocks – Technical Peer Comparison
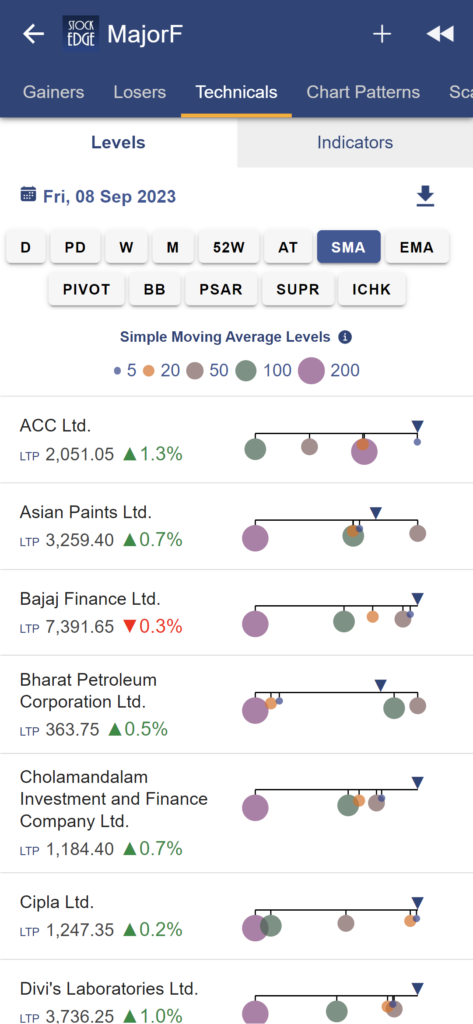
Comparing stocks in your watchlist from a technical perspective can help you identify potential trading opportunities or make informed investment decisions. Just like Portfolio Stocks, StockEdge also provides the chance to all its users to analyse their preferred watchlist stocks technically and make more informed bets and investing and trading decisions by keeping track of all varied technical levels and indicators.
Rounding Top and Rounding Bottom Chart Patterns
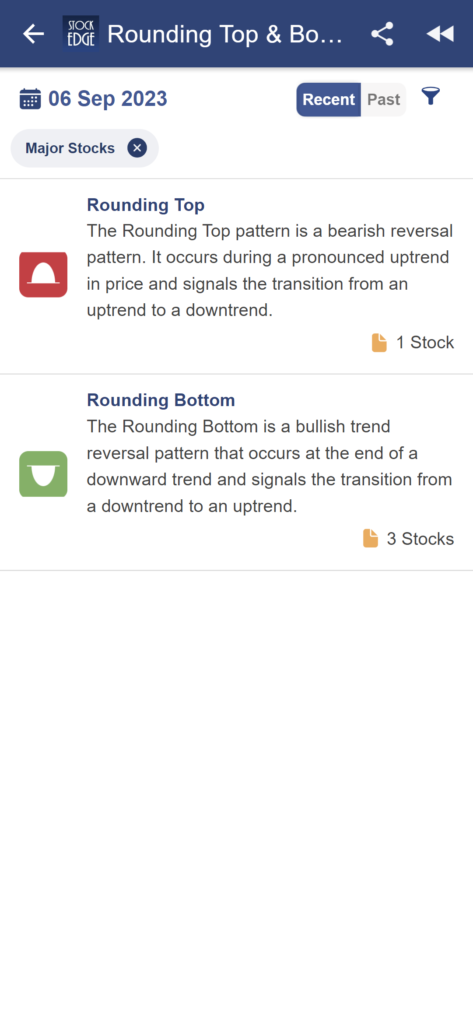
Rounding top and rounding bottom are classic chart patterns in technical analysis. A rounding top indicates a potential reversal from an uptrend to a downtrend, while a rounding bottom suggests a reversal from a downtrend to an uptrend. The software may identify and provide information on these patterns.
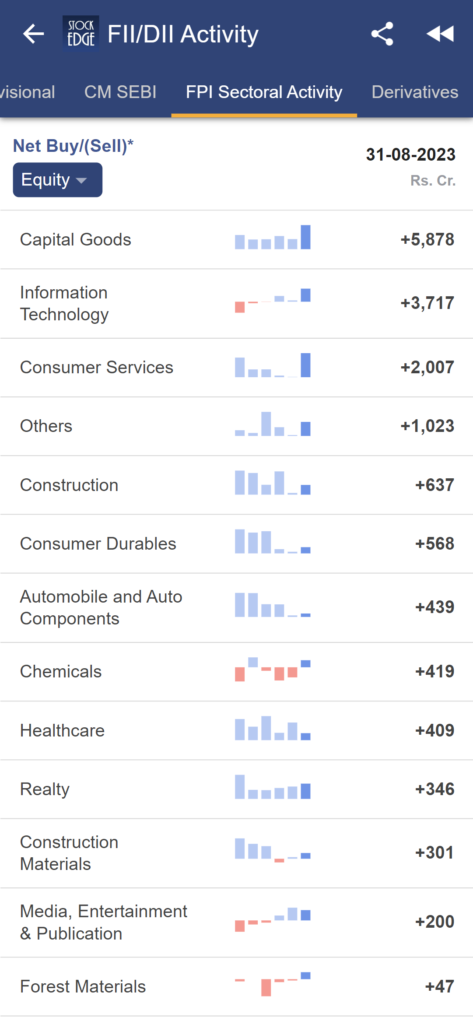
FPI Sectoral Activity
Foreign Portfolio Investors (FPIs) are institutional investors, including foreign mutual funds, pension funds, and other foreign institutions, that invest in the financial markets of a country. They allocate their investments across various sectors and asset classes based on their investment strategies, risk profiles, and market conditions. The sectoral activity of FPIs can vary over time and depend on a range of factors, including economic conditions, government policies, and global market trends.
FPI Sectoral Activity is displayed in the FII/DII Activity section and is directly fetched from the exchange website on a fortnightly (15-day basis) as and when reported by NSDL on the exchange.
It is a very important data point referring to tracking the activity of Foreign Portfolio Investors (FPIs) in various sectors of the stock market. This information can be useful for investors to gauge foreign investment trends and sentiments in specific industries.
(Sectors in StockEdge and in the FPI Sectoral Activity differ as the latter is provided by the exchange.)
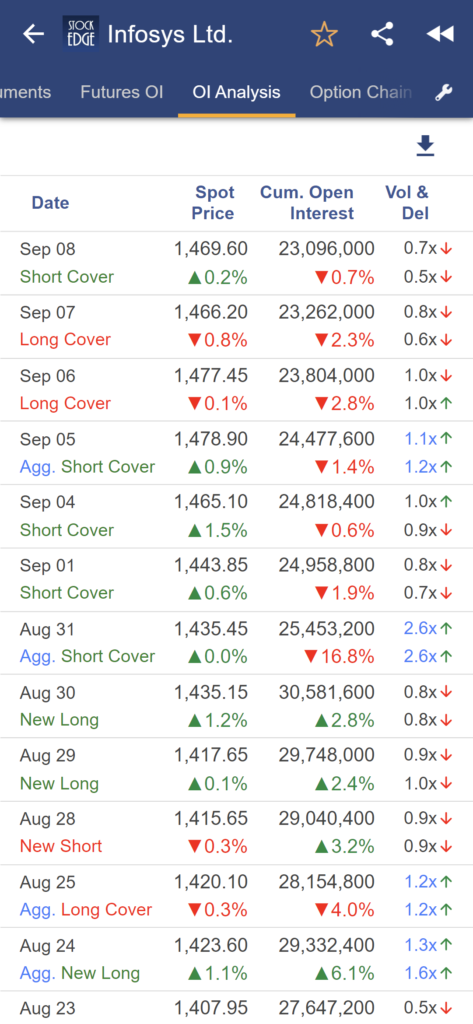
Download to CSV – OI Analysis:
This feature likely allows users to download Open Interest (OI) data in CSV format for further analysis. Open Interest is an important metric in derivatives trading, particularly in options, and can provide insights into market sentiment and potential price movements.
Users trading in the derivatives market can efficiently utilise and analyse this data on a daily basis by downloading the same and keeping track of changes in Price, Cumulative Open Interest and Volume and delivery Trends.
We’re excited to deliver these new features to you, and we believe they will significantly enhance your trading and investing journey. At StockEdge, we’re committed to continuous improvement and innovation, and this update is a testament to that commitment. Whether you are a seasoned trader or a beginner taking your first steps, StockEdge Version 11.1 is designed to enhance your investment journey and empower you to make better-informed decisions.ng StockEdge as your go-to platform for market analysis and decision-making. We value your feedback, and if you have any suggestions or queries, please don’t hesitate to reach out to our support team.
Watch this video where Mr. Vivek Bajaj explained the latest update of StockEdge
If you enjoy using StockEdge, don’t hold back from sharing the platform with your near and dear ones.
Check out StockEdge’s Premium Plans to get the most out of it. Also, watch this space for our midweek and weekend editions of ‘Stock Insights‘.
Happy Investing and Trading with StockEdge Version 11.0!
-The StockEdge Team


