Table of Contents
A majority of option trades find option chain analysis very difficult to interpret. However, analyzing the option chain unfolds many insights about the option contracts that you are trading. These are essential data to interpret before you start trading in options. However, making an interpretation from the option chain can be challenging for some, especially given the bundle of information it provides to an option trader. An option chain provides an abundance of information, which seems to be overwhelming for some option traders, finding it very complex to interpret. And that is a fair point. FYI, here is an option chain NSE provides.
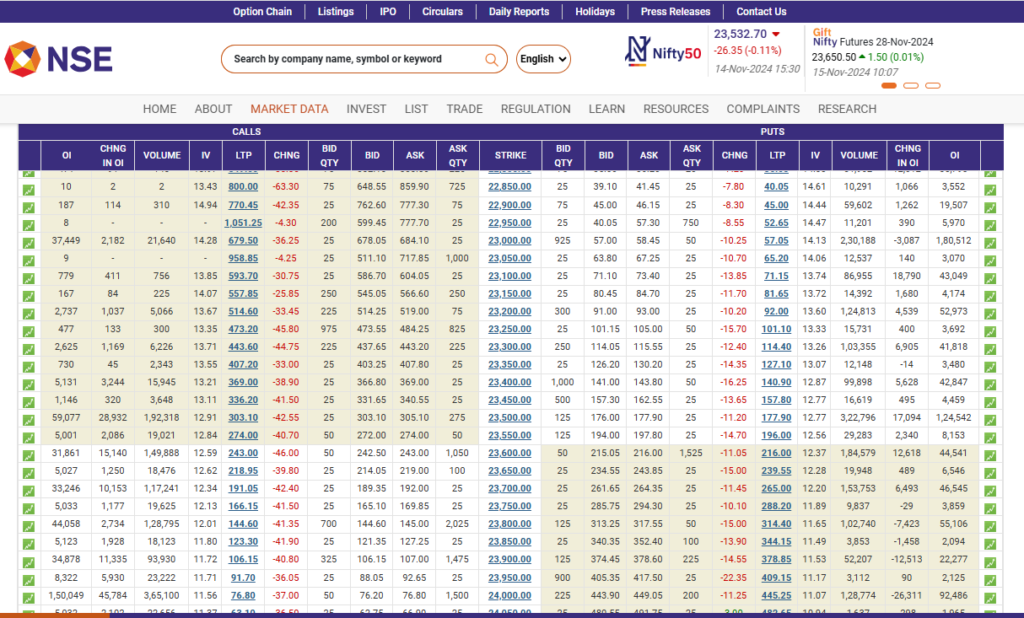
Yes, it does seem to be a complex table to interpret. The above table is the Nifty 50 option chain. Here, it has multiple columns, infinite numbers, figures and whatnot! But worry not; the main objective of today’s blog would be to simplify the option chain analysis for you. Let’s take a step-by-step approach to discover some of the major data points that the option chain has to offer.
What is an Option Chain?
An option chain is a matrix or a table of option contracts available for an underlying asset. You can view both call and put options for the underlying asset. It usually helps the option traders decipher the movement of the underlying asset as well as key levels where the underlying asset can take support or hit resistance. Isn’t that great?
Now, let’s dive into the different components of an Option Chain.
Components of Option Chain
1. Open Interest (OI)
If you are already an options trader, you must have come across this term many times. This is the most essential component in analyzing an option chain. Open interest, commonly termed OI, is basically the total number of outstanding option contracts that are not yet settled. Unlike trading volume, which measures the number of contracts traded, open interest focuses on the total number of active contracts, and each contract has both a buyer and a seller. However, we only need to count one side to find the total open interest. To learn more about open interest, here is a quick read: How to read open interest and price movements?
2. Change in OI
The increase and decrease of open interest in a particular option contract is known as a change in OI. To put it simply, an increase in OI means more open contracts are being added, and a decrease in OI means the open contracts are being closed. This information is valuable for option traders to gauge the direction of the underlying asset.
3. Volume
Volume refers to the number of option contracts traded between buyers and sellers. It denotes buying-selling activity in an option contract. A high volume indicates significant trading activity, which suggests option contracts are liquid, meaning option traders can enter or exit the contract with ease.
4. Strikes
In an option chain, strike prices are predetermined prices at which call or put option contracts are exercised.
5. Implied Volatility (IV)
Implied volatility (IV) represents the future volatility of the underlying asset of the option contract. It does not indicate the direction of the underlying asset but only indicates if there are any volatile price action movements in the near term or not. There are two major concepts of IVs that you must know!
- Unpredictability leads to an increase in implied volatility, referred to as IV expansion because the option prices are likely to increase.
- A relatively stable market leads to IV contraction because, here, there is a decrease in implied volatility and option prices.
So, during IV expansion, the option buyers have an edge, while during IV contractions, the option sellers have an edge.
6. Bid/Ask Qty
Options are traded in a particular lot size, meaning you can only buy or sell option contracts in a set quantity. For instance, If the lot size of Nifty 50 is 75. You can buy or sell Nifty options in multiples of 75. Bid Qty is the number of shares or units the buyer is willing to buy, whereas Ask Qty is the number of shares or units the seller is willing to sell.
7. Bid/Ask Price
A similar pattern is followed in the case of Bid/Ask price as well, where the specific price at which the buyer of an option is willing to buy is the bid price, whereas the specific price at which the seller likes to sell the option contract is known as Ask price. When the bid and ask prices are near to equal- a trade occurs.
Checking the bid/ask price of an option contract is essential while trading options as it provides a glimpse of the liquidity of the option contract. For instance, imagine a bid for Nifty 2350CE at 100 where the other person put an asking price of 100.50. The gap of 0.50 between bid and ask price is known as the bid/ask spread. The narrower the spread, the more liquidity there is, which means it is easier to enter or exit a trade. In contrast, if the bid/ask spread is high, it indicates a lack of liquidity in the option contract.
Finally, all the columns of an option chain have been explained now, and each component of the option chain has its own unique importance when trading options. However, not every component of the option chain is equally important at all times. So, at StockEdge, we have simplified the option chain for you. See how it looks!
Option Chain Simplified
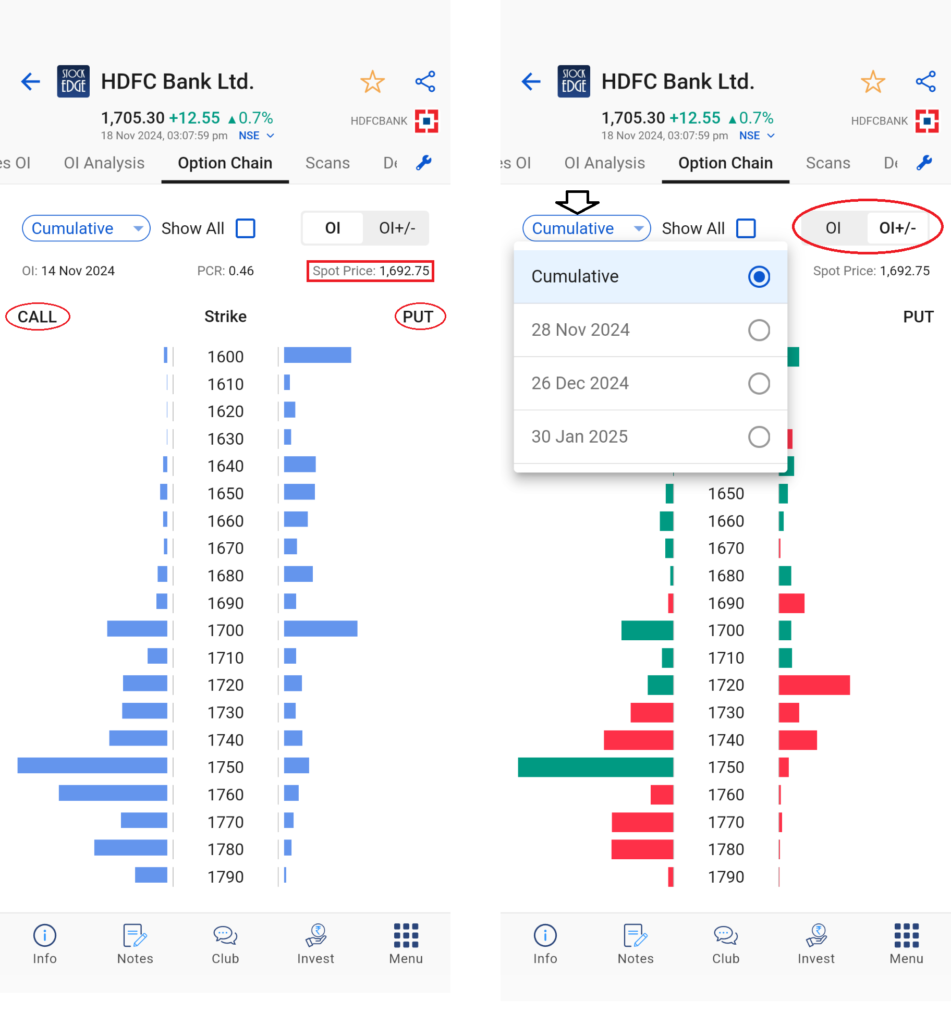
In the above screenshots, you view the same option chain in the StockEdge app, but it is refined for simplicity.
The components mentioned above are for both call and put options in an option chain. The left side is for call options, and the right side is for put options. Not just that, with StockEdge, you only get to view those option strikes that are liquid. Also, the total OI is visually represented in bar graphs for easy interpretation. Moreover, the change in OI can be viewed with just one click on OI +/-. The addition of OI is represented by green bars, whereas the unwinding of OI, meaning declined in OI, is represented as red bars for ease of use. However, it is important to note that the option chain data gets updated at the end of the day (EOD).
How to interpret the Option Chain?
To interpret the option chain, you must know the basic concept of the components of the option chain, which is already explained in this blog. However, having an understanding of the key components of the option chain is not enough. To unlock the crucial insights from the option chain requires high interpretation skills that come over time. So, let’s begin learning a new skill:
- The first and foremost important element in an option chain is to track the highest open interest in both the call and the put side, which generally indicates a resistance and support level for a stock or any underlying asset.
Now, why track the highest open interest and how does it indicate resistance or support?
In an option chain, the OI for various strikes is usually considered option writers because option sellers take high risks and always have the upper hand in options trading. Option selling requires high margins, and such high-risk and high-margin trades can be taken up by big market participants. So, in general, follow the highest call and put OI or even if there is significant high open interest in a strike. Why? Let’s find out.
- Highest Call Writers: The strike price with the most call option writing often acts as resistance, meaning the stock may struggle to rise above this level. This is because call writers generally have a bearish outlook at that price.
- Highest Put Writers: The strike price with the most put option writing often acts as support, meaning the stock may not fall much below this level. This is because put writers generally have a bullish outlook at that price.
- The next important element to track is the change in OI. Simply put, additions in OI in calls suggest resistance building up at the strike price, whereas unwinding or declining in OI suggests a weakening of resistance, and a probable breakout can be expected. On the other hand, the addition of OI in Puts suggests support building up at the strike price, whereas unwinding or declining OI suggests a weakening of the support level, and a probable breakdown may occur.
Here is a brief example that may showcase the importance of change in OI; below is the option chain for HDFC Bank Ltd. on 18th Nov and 19th Nov. (EOD)
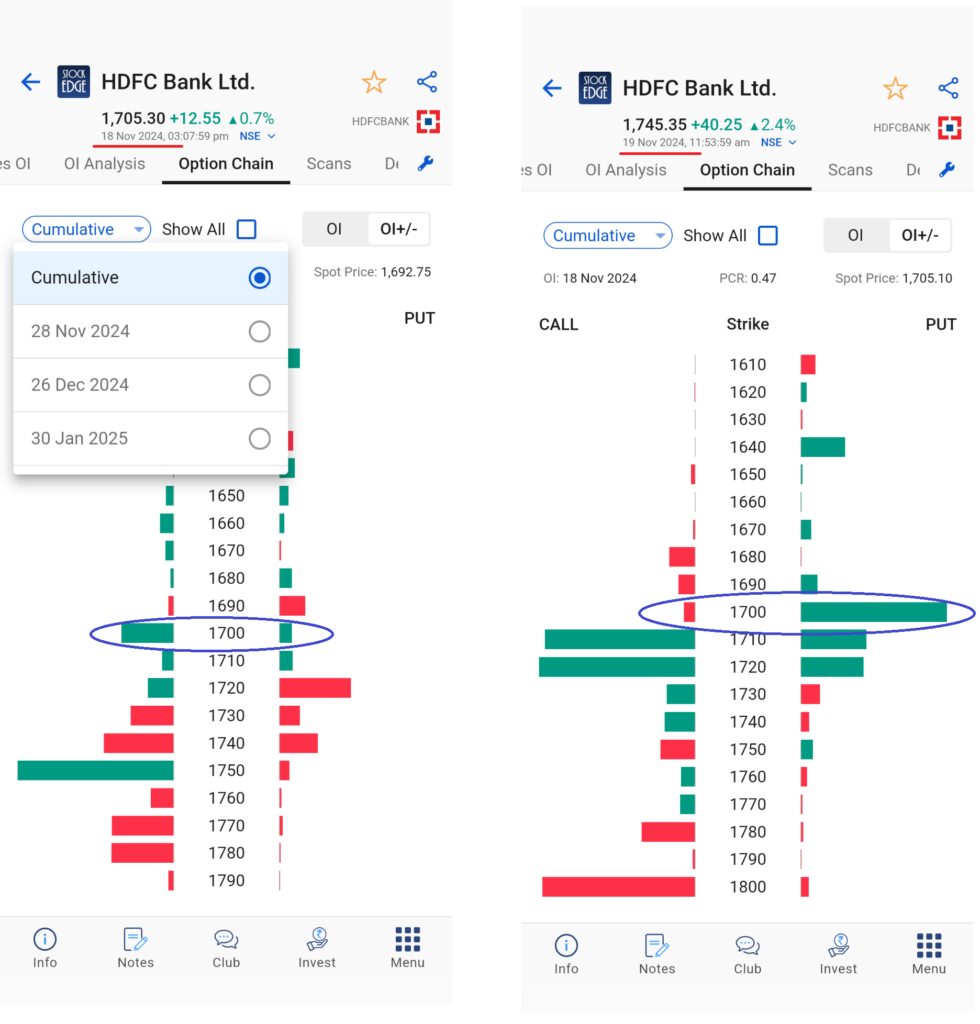
As you see, from 17th Nov to 18th Nov, there were significant PUT OI additions at 1700PE, whereas 1700CE witnessed call unwinding. This suggests the put writers are making fresh positions in 1700PE, whereas call writers are unwinding their positions. Therefore, when call writers close their positions, they are buying back the calls that they have sold earlier. In contrast, Put writers building up OI at 1700PE indicates a key level where they are expecting not much of a downside. Therefore, we saw an upward move in stock price the next day of almost 2.27%.
But yes, do remember to use OI data as your secondary filter to select stocks for option trading. Keep the focus on price action first and then track the OI data for added conviction on your options trades.
If you are a full time F&O trader, then you must check our derivatives analytics feature which could help you identify potential trading opportunities. Here is a complete guide for you: Derivative Analytics: Unlock the Power of Derivatives to analyze Stocks!
The Bottom Line
In conclusion, tracking option chain data is a vital aspect of successful options trading. It provides a detailed snapshot of potential price movements, and key levels of support and resistance. By analyzing metrics such as open interest, change in OI, and bid-ask spreads, you can gain valuable insights into liquidity, potential profit opportunities, and risk exposure. Hence, incorporating option chain analysis into your trading strategy not only enhances decision-making but also equips you with a competitive edge in navigating the dynamic world of options trading.
Happy trading!


