Key Takeaways
- Narrow Range Strategy: It is a breakout-based method that tracks price consolidation before a strong move in either direction.
- NR 4 and NR 7 Days: NR 4 means the smallest range in 4 days, while NR 7 marks the narrowest range in 7 days, indicating low volatility.
- Trading Signals: A breakout above NR 4/NR 7 highs suggests bullishness, while a breakdown below lows signals bearishness.
- Stop-Loss Setup: When buying, use the NR 4/NR 7 low as stop-loss; when selling, use the NR 4/NR 7 high as stop-loss.
- StockEdge Usage: Traders can easily scan NR 4 and NR 7 breakouts or breakdowns in the StockEdge App to identify trading opportunities.
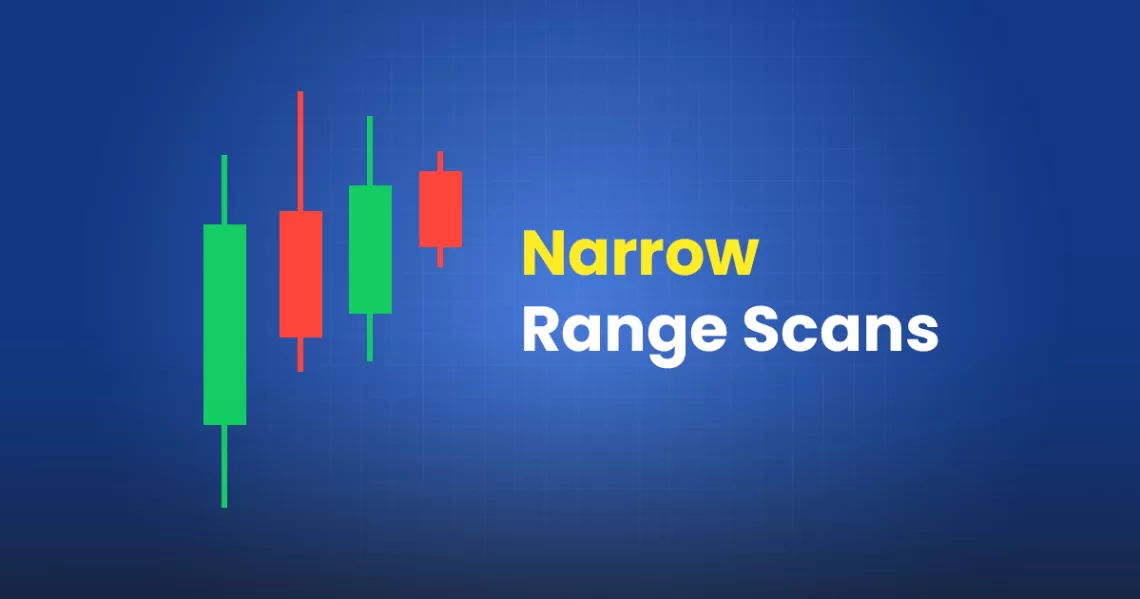
Narrow Range trading strategy is a breakout-based method that assumes that the price of security trends up or down after a brief consolidation in a narrow range. The default lookback period of this strategy is 7 days which means that if the price range of any particular days is lowest as compared to last 7 days, then that day is termed as NR 7 day. Similarly, if the price range of any particular days is lowest as compared to the last 4 days, then that day is termed as NR 4 day.
The day following NR 4/NR 7 day acts as a confirming factor on where the price will move further. Breakout of NR 7 candle with high volumes indicates bullishness, while the breakdown of NR 7 candle indicates bearishness. Observing this pattern gives day traders /swing traders a distinct edge to trade the next few days. It gives you a chance to be ahead of trade followers/indicator followers who will jump in the trend after you.
The philosophy behind the pattern is to track volatility contraction which is often followed by a volatility expansion. Narrow range days mark price contractions that often precedes price expansions.
Narrow Range 4 (NR 4) & Narrow Range 7 (NR 7)
Narrow Range 4(NR 4) and Narrow Range 7 (NR 7) is a trading strategy that helps to track bullish and bearish stocks when the narrowest range (shortest candle) occurs, it is a sign that volatility has contracted and the stock is now ready for a break out on either side (up or down). Range means the difference between days high and days low. For example, if today’s high- today’s low is smallest of last 6 days high-low (range) today is NR 7 day and if we take this for 4 days, it’s NR 4 day when today’s range is smallest in last 4 days(including today).
To trade with NR 4/NR 7 stocks, Mark high and low of NR 4/NR 7 days as resistance and support. If the stock breaks up or down the high or low of NR 4/NR 7 candles, Buy or sell accordingly. Stop loss will be the Low of NR 4/NR 7 candles when you buy and high of NR 4/NR 7 candle when you sell.
See also: Using My Combination Scan to Identify best in an Industry
Using Narrow Range in StockEdge App:
Above we have discussed the Narrow Range, now let us discuss how we can use this technical indicator to filter out stocks for trading:
In StockEdge there are six Narrow Range scans available for filtering out stocks for trading:
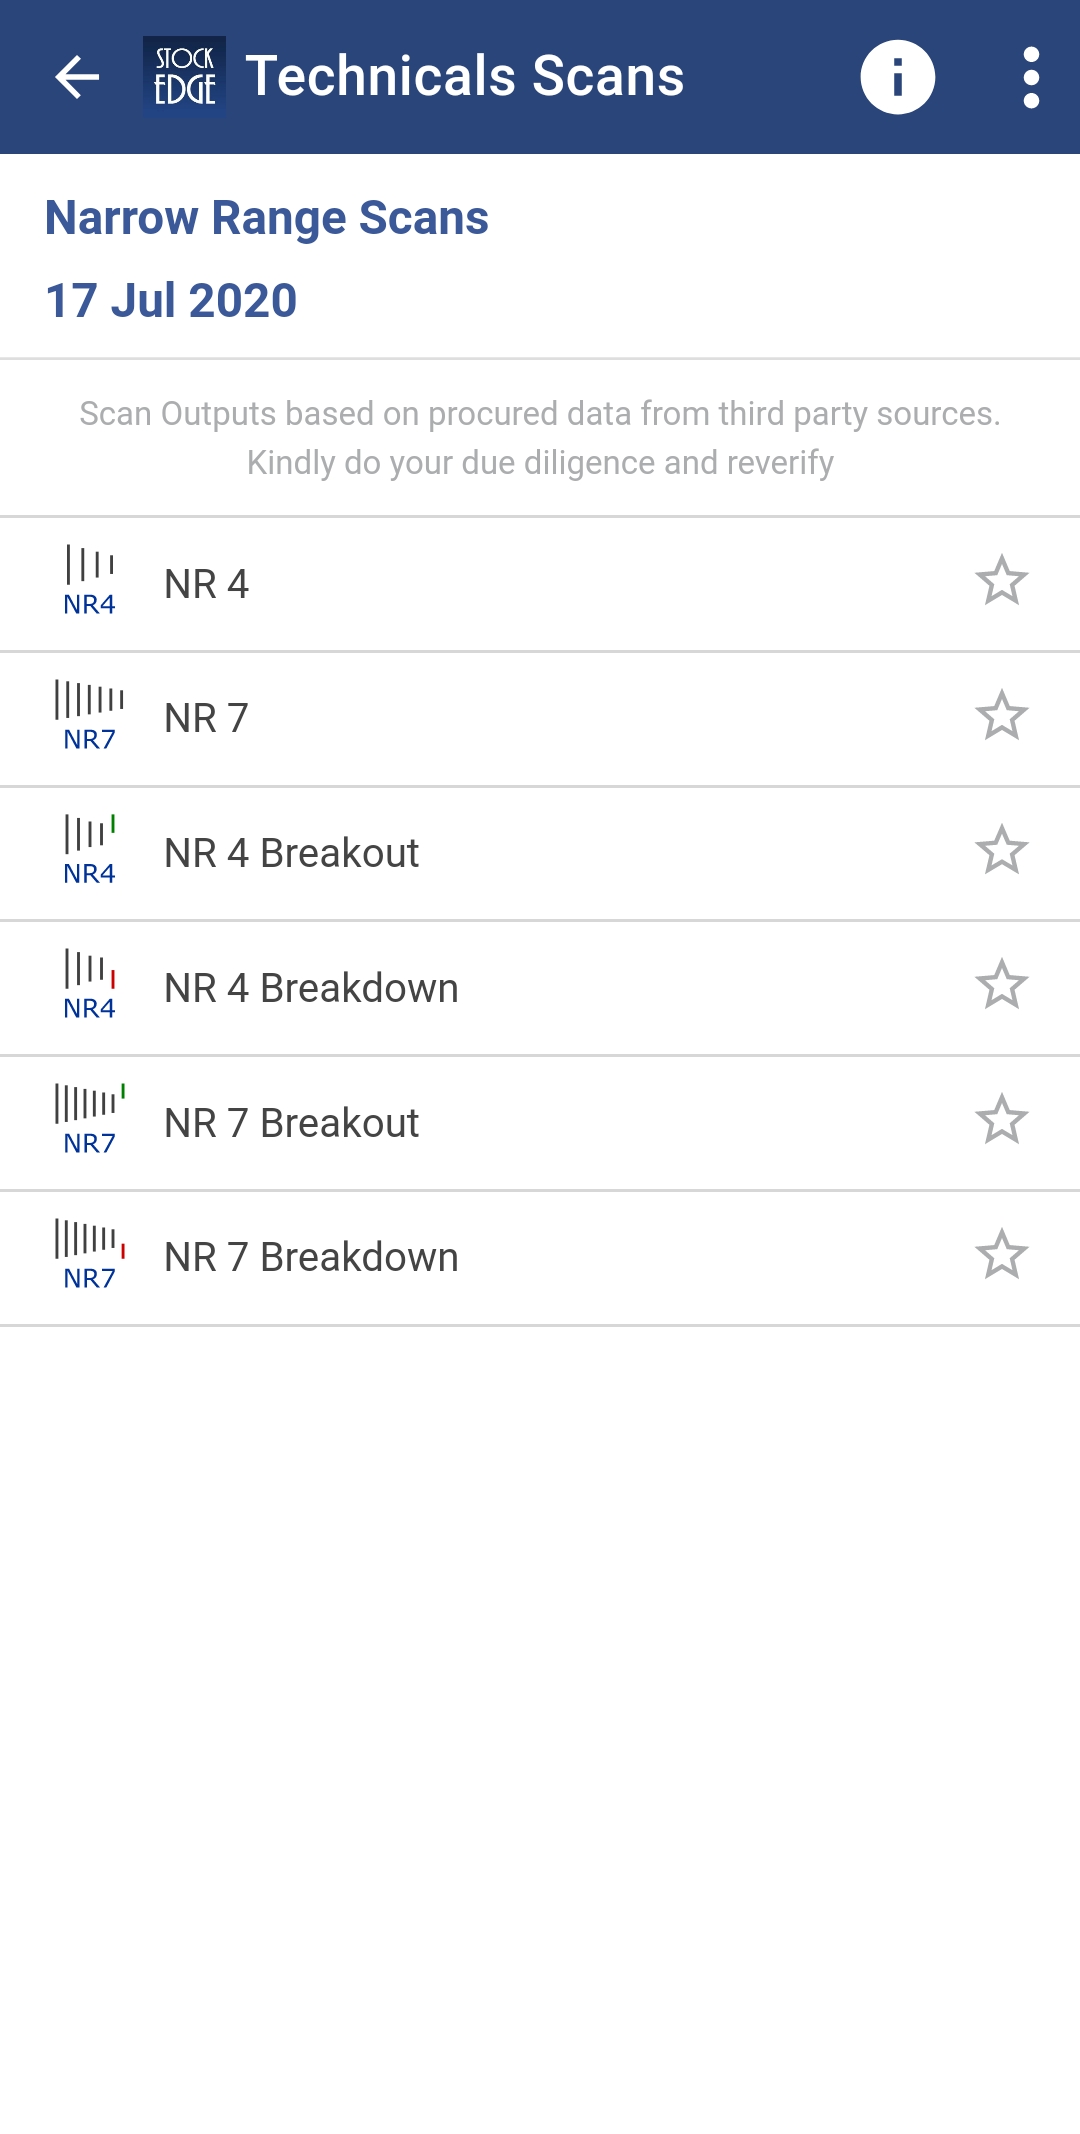
Let us discuss in details about some of these scans:
NR 4 Breakout :
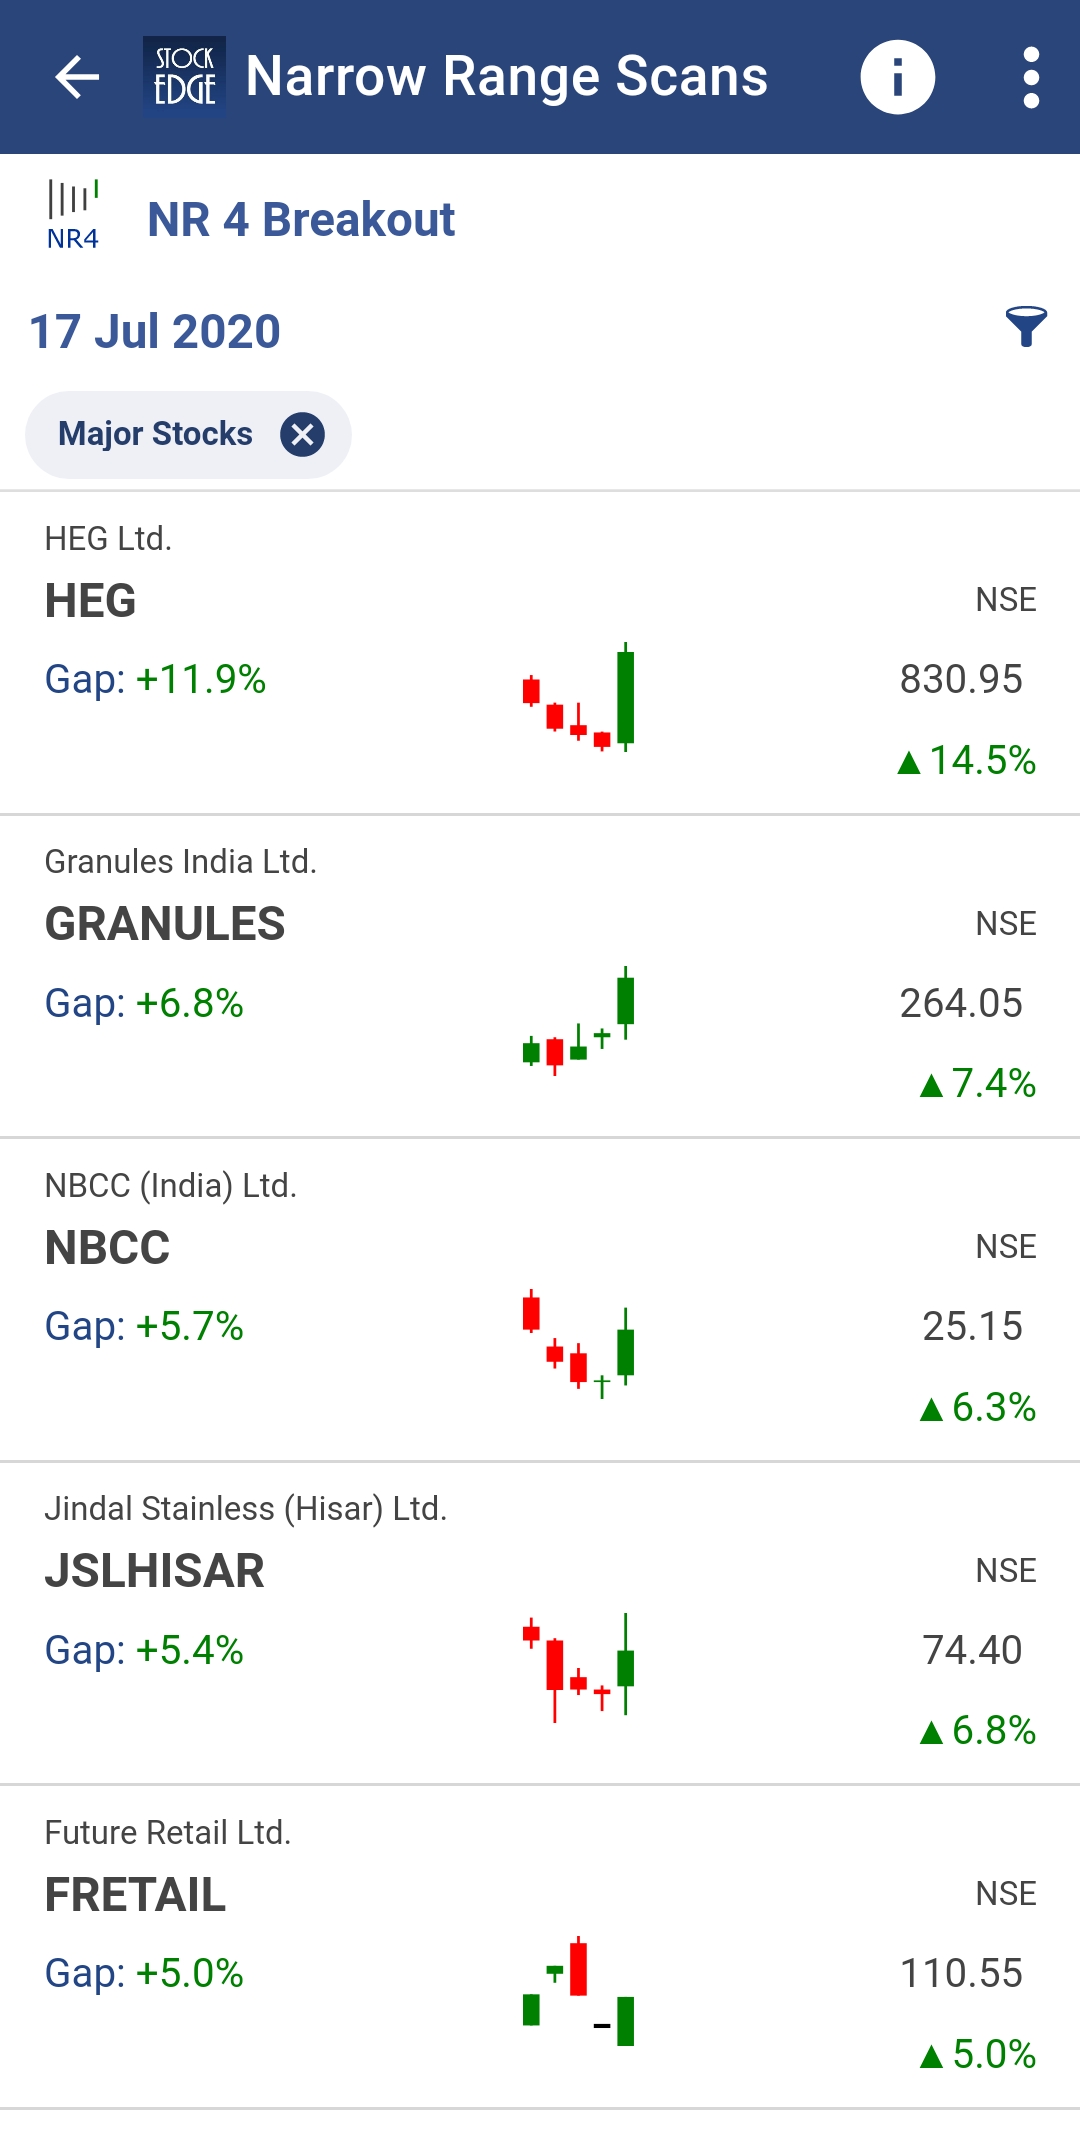
It is a bullish indicator that shows Stocks which has qualified for NR 4 scan on the previous day and has a gap up opening the following day i.e. closes above the high of NR 4 day candle on the current day. It is an excellent strategy to filter out stocks that are a good buy opportunity.
Following is a list of stocks which has fulfilled this criterion on 17th July:
NR 4 Breakdown :
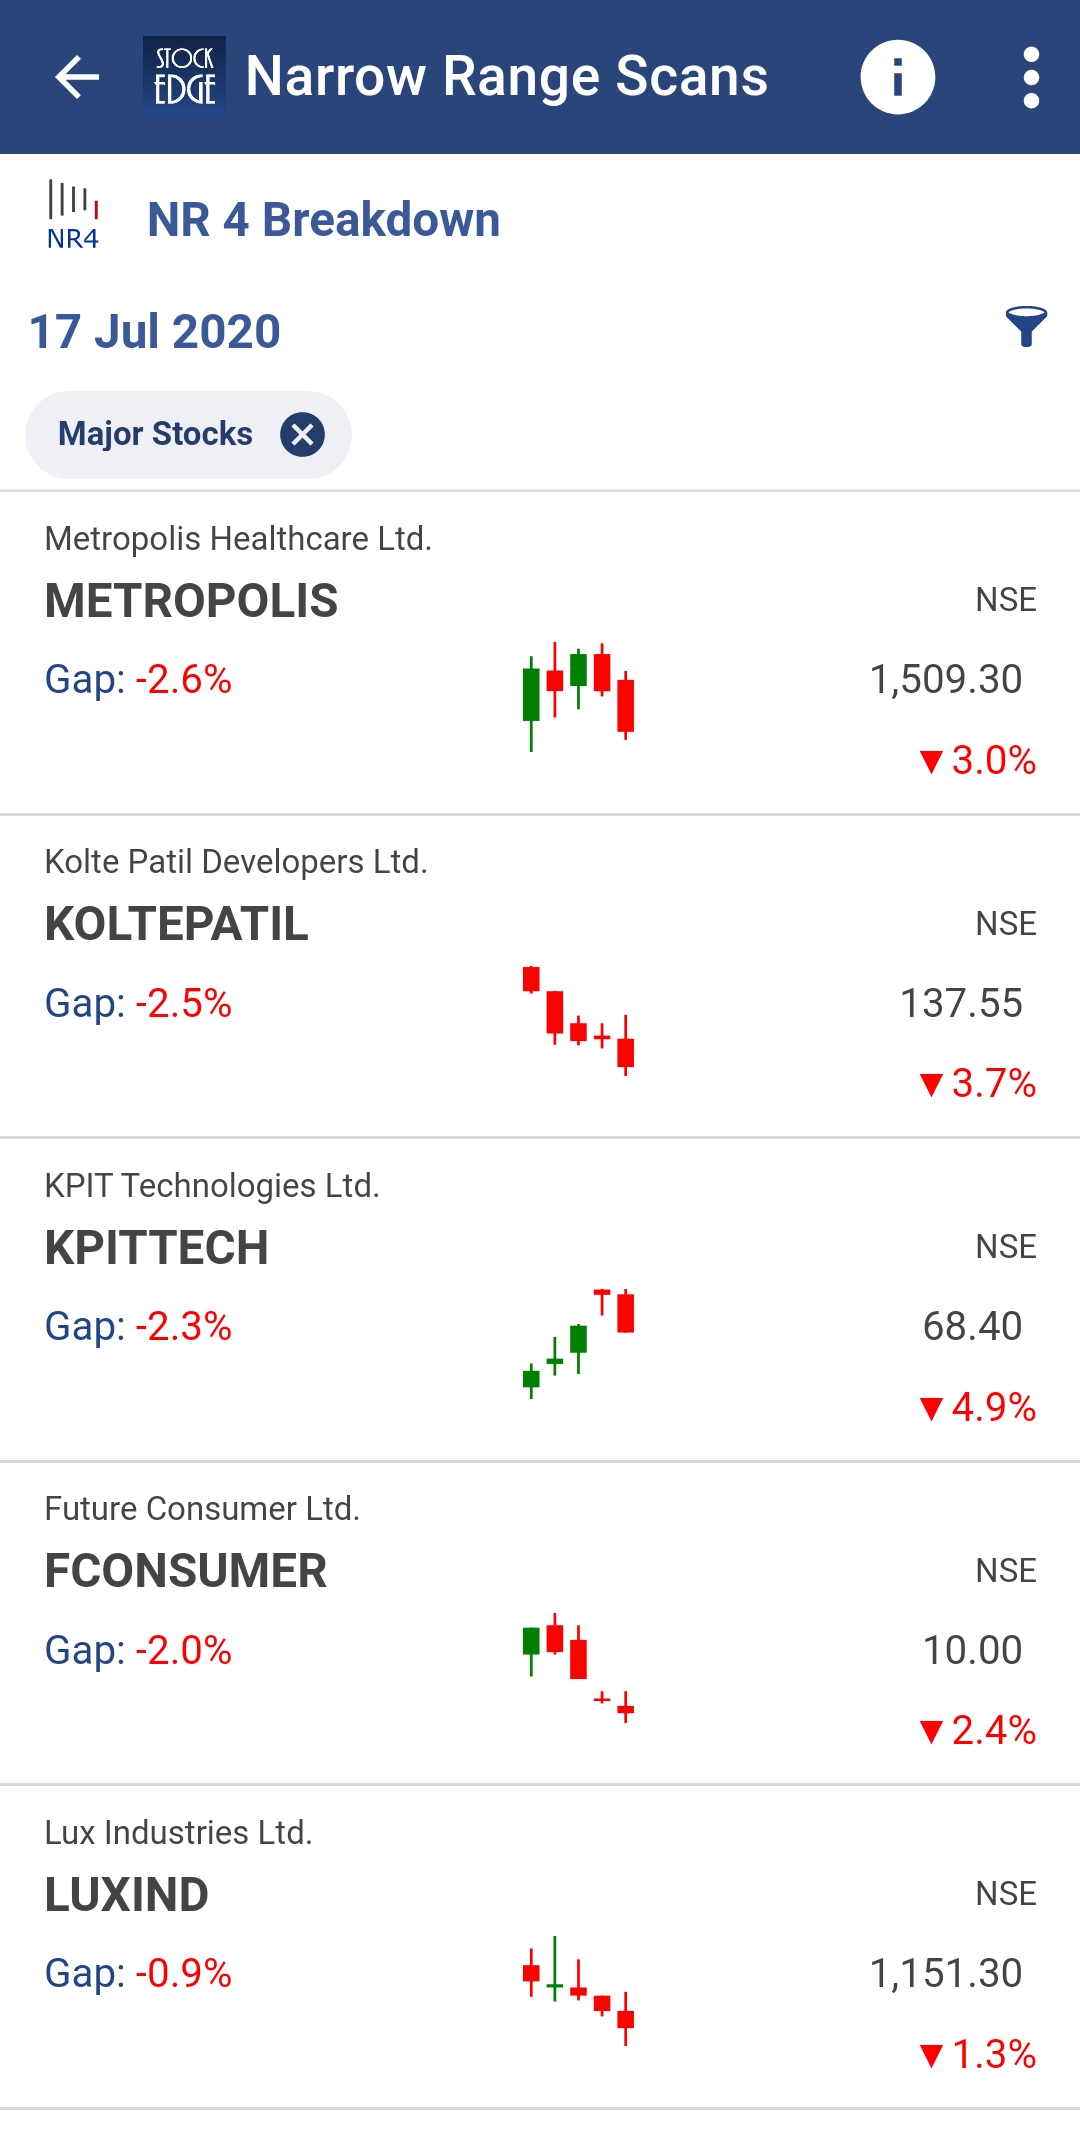
It is a bearish indicator that shows Stocks which has qualified for NR 4 scan on the previous day and has a gap down opening the following day i.e. closes below the low of NR 4 day candle on the current day. It is an excellent strategy to filter out stocks that are a good sell opportunity.
Following is a list of stocks which has fulfilled this criterion on 17th July:
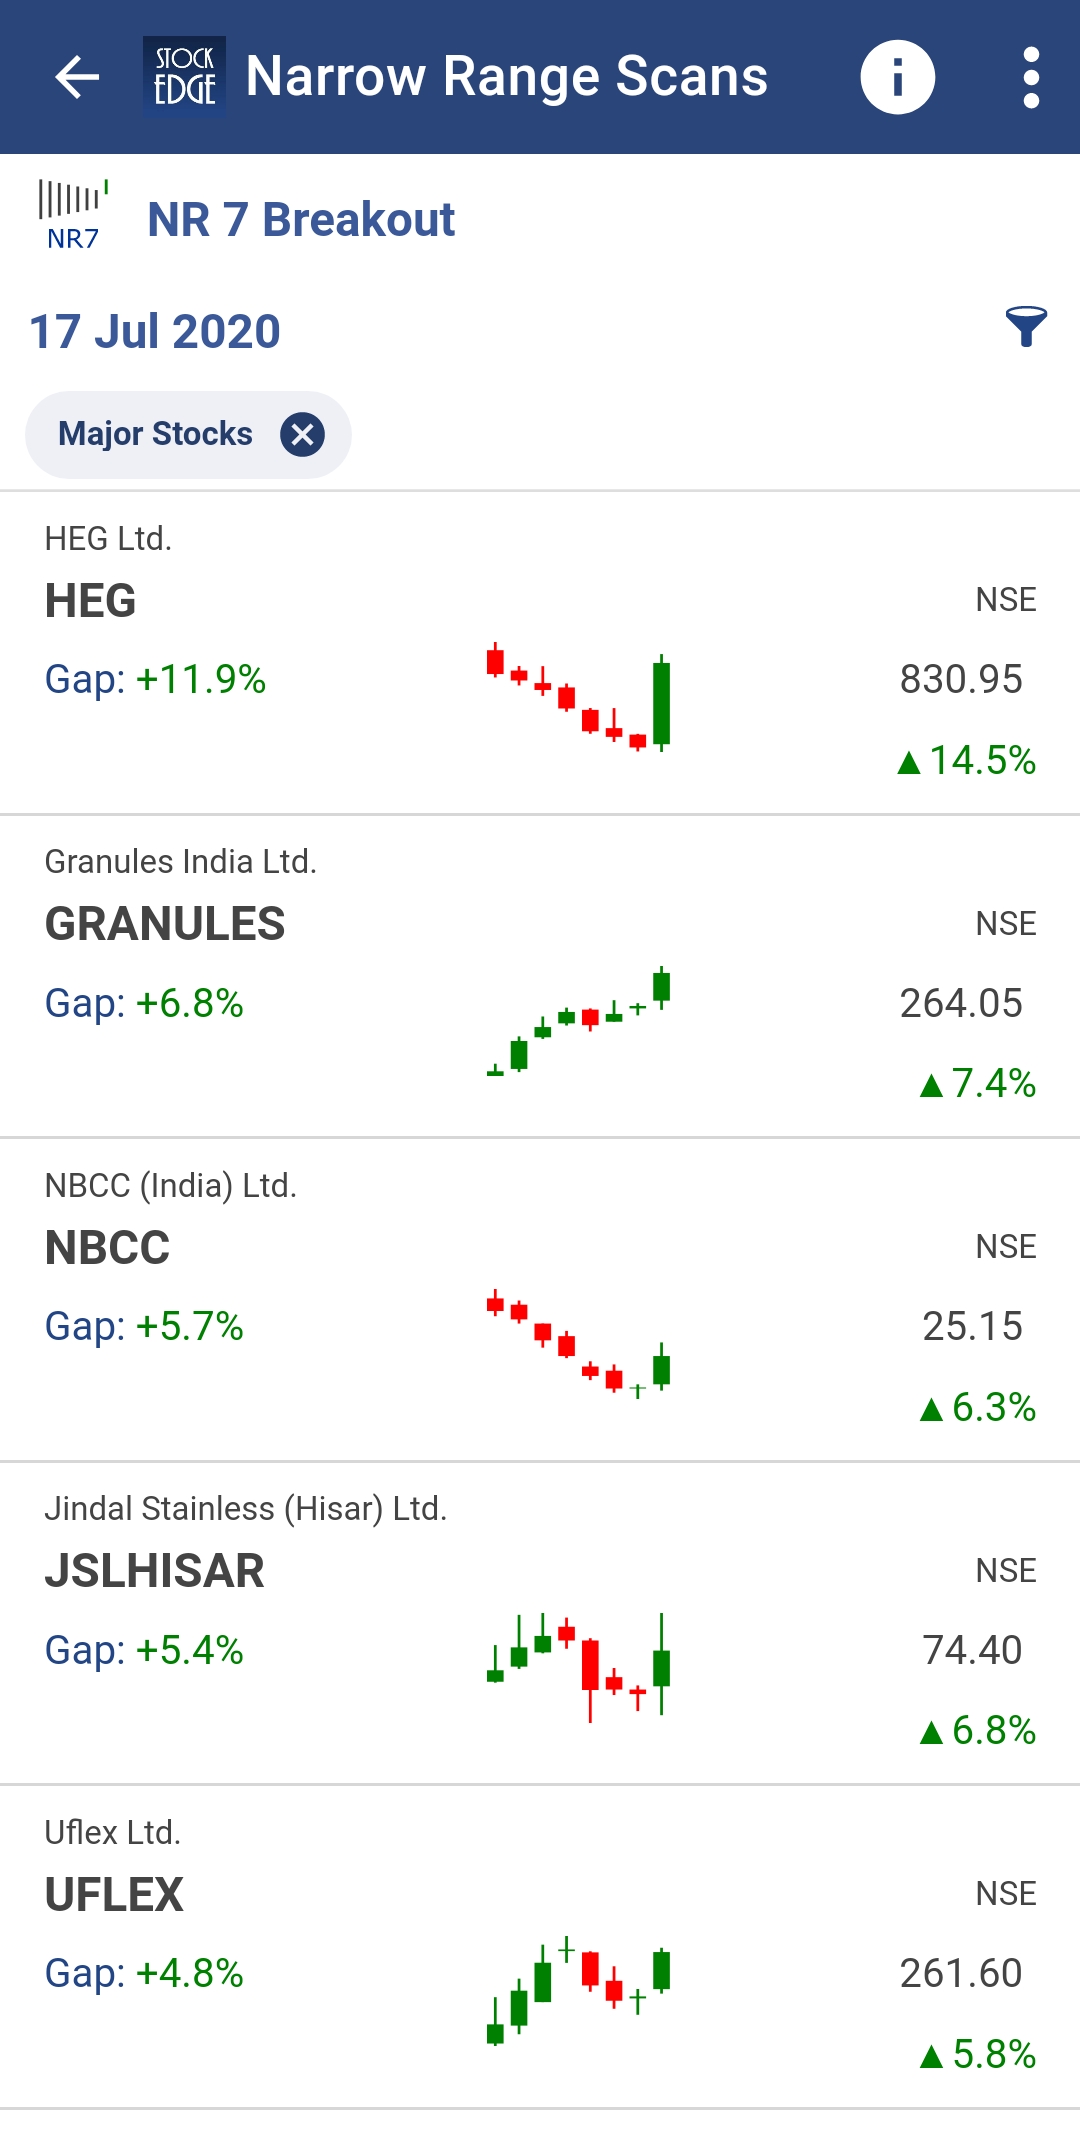
NR 7 Breakout :
It is a bullish indicator that shows Stocks which has qualified for NR 7 scan on the previous day and has a gap up opening the following day i.e. closes above the high of NR 7 day candle on the current day. It is an excellent strategy to filter out stocks that are a good buy opportunity.
Following is a list of stocks which has fulfilled this criterion on 17th July:
NR 7 Breakdown :
It is a bearish indicator that shows Stocks which has qualified for NR 7 scan on the previous day and has a gap down opening the following day i.e. closes below the low of NR 7 day candle on the current day. It is an excellent strategy to filter out stocks that are a good sell opportunity.
Following is a list of stocks which has fulfilled this criterion on 17th July:
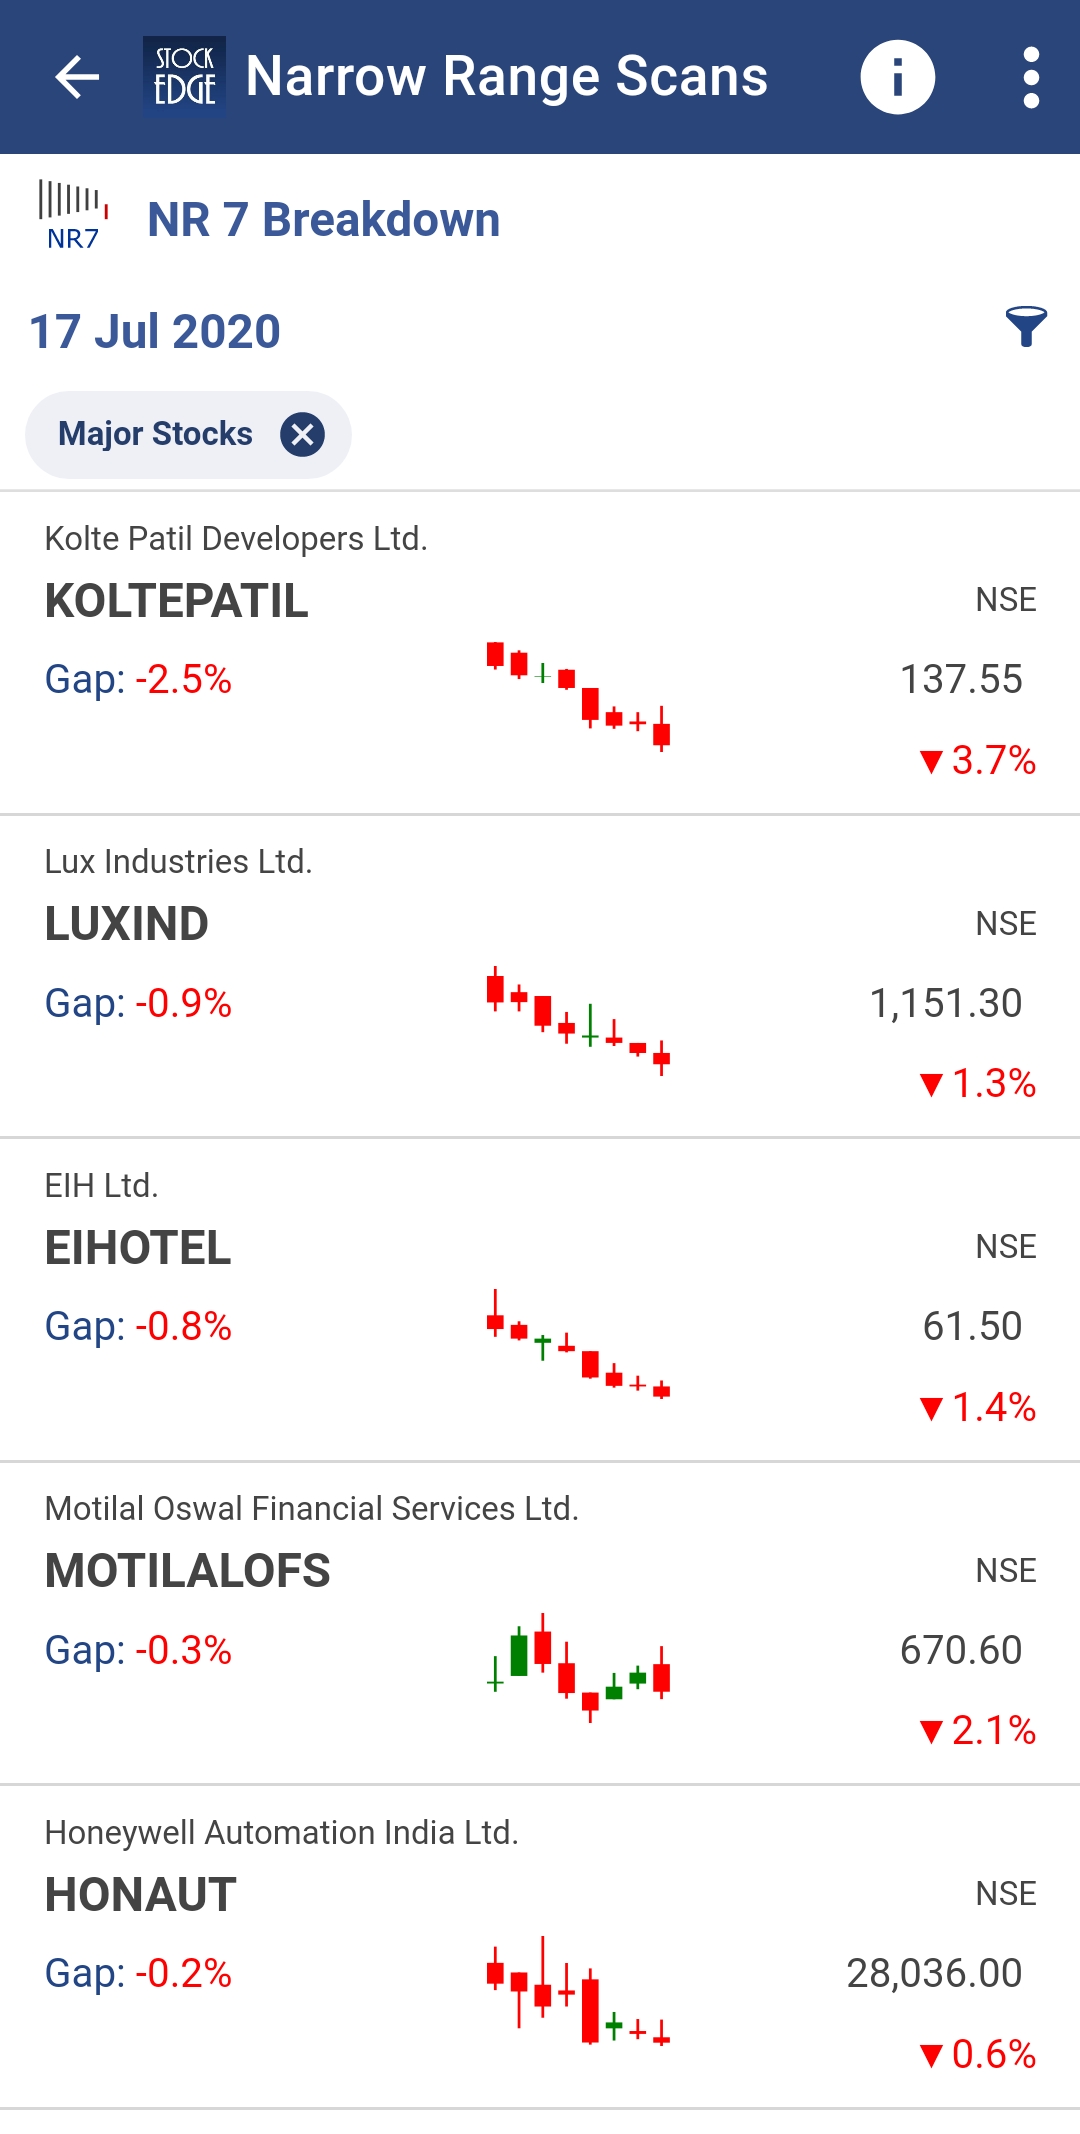
Above are examples of Narrow Range scans that tell you if the stock is bearish or bullish and also give us a list of the stock which fulfils the criteria of the particular day.
You can filter out the stocks and can trade accordingly using these scans.
Join the StockEdge Club to get more such Stock Insights.
You can check out the desktop version of StockEdge here!


