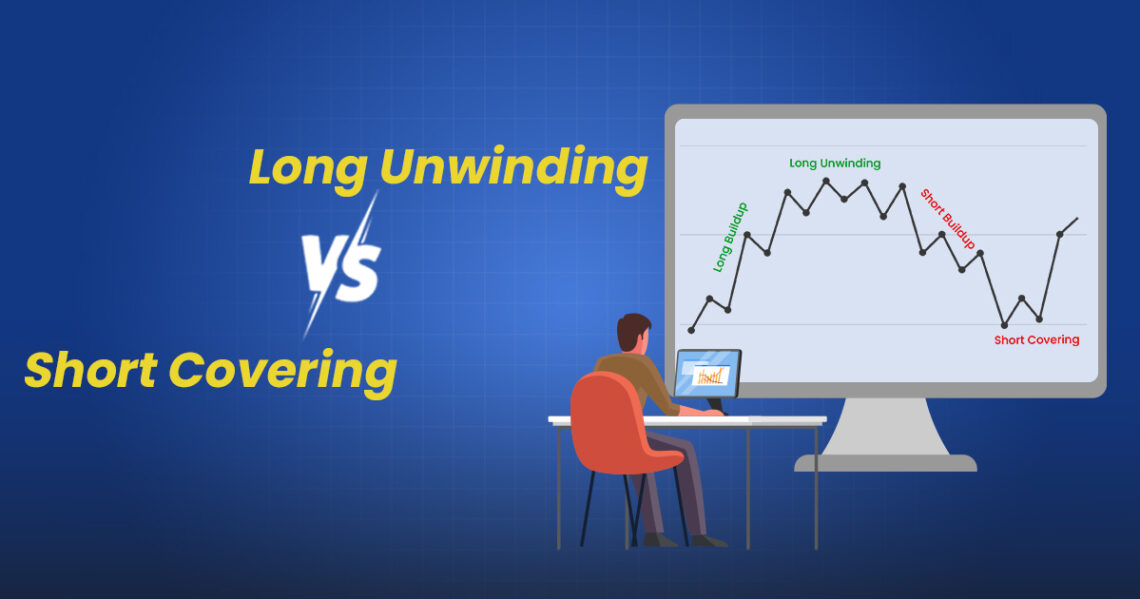
Key Takeaways
- Long Unwinding: This happens when traders sell off their long positions (stocks or F&O) to book profits or reduce risk, often causing downward pressure on prices and signaling a shift toward bearish sentiment.
- Short Covering: This occurs when short sellers buy back shares they had borrowed and sold earlier, to close their positions and limit losses leading to upward price movement and sometimes driving bullish momentum.
- Opposite Market Signals: Long unwinding reflects a bearish or cautious outlook, while short covering reflects a bullish or recovery sentiment. They both reduce open interest but move prices in opposite directions.
- How to Spot Them: A falling price with decreasing open interest and volume usually indicates long unwinding. A rising price with decreasing open interest often shows short covering and possibly a short squeeze.
- Why It Matters: Recognising these patterns helps traders interpret market moves more accurately, manage risk, and adjust trades especially in F&O trading where OI trends are visible.
Are you a F&O trader? If yes, then you must have heard some complex financial jargons like new long, new shorts, long unwinding & short covering. All such terminologies of the stock market are based upon open interest. In the equity derivatives segment of the stock market analyzing open interest is of great importance especially for a futures and options trader.
Out of the above four terminologies, new long and new shorts are simple and easy to understand, whereas long unwinding or short covering are not. It is a difficult concept because newbie traders often consider long unwinding as bullish and short covering as bearish because of the terms: long (bullish) and short(bearish) associated with it. That’s completely incorrect. Therefore, this blog will provide a complete breakdown of two major derivative terminologies: Long Unwinding & Short Covering.
Long unwinding or short covering and new long or new short. To understand each of them, it is important to understand the concept of open interest while trading futures and options. Don’t worry, if you are new in futures and options trading. This blog shall provide you with a brief overview of open interest as well.
So, before delving into the concept of long unwinding and short covering, let’s understand open interest.
What is Open Interest?
In the equity derivatives market, traders buy and sell futures or option contracts whose prices are derived from the underlying asset, which are stocks/index. Instead of buying and selling stocks which are assets, traders buy or sell futures and option contracts of that equity asset at a particular price which is exercised on a pre-decided future date called the expiry. The contracts which are bought or sold are generally referred to as open contracts.
To put things into perspective, suppose Mr. A buys a SBI futures contract and Mr. B sells a SBI futures contract which is equal to 1 open future contract. The total number of outstanding contracts that have not been settled or closed on a particular trading day is known as Open interest.
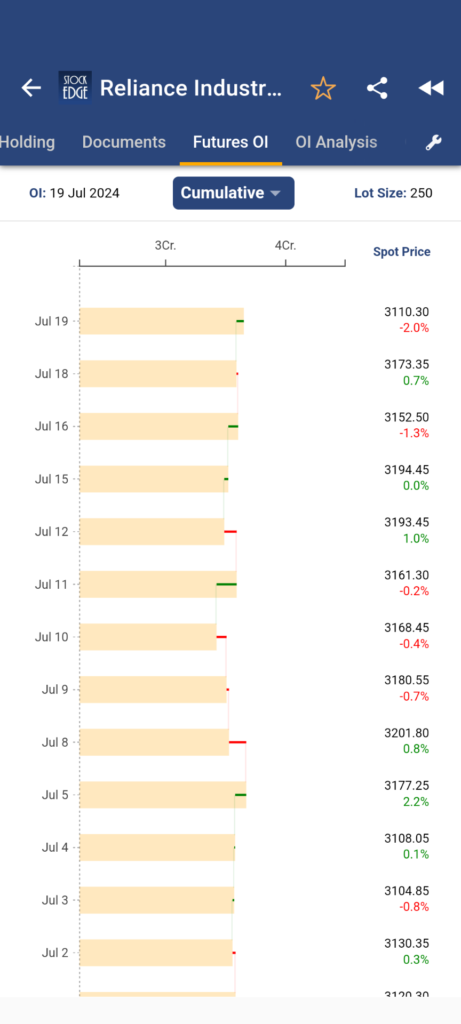
For futures, it represents the number of contracts held by traders who still need to offset their positions by selling or buying an equal number of contracts. You can analyze the future OI of any stock under the F&O segment with the help of StockEdge. Let’s find out with the example of Reliance Industries Ltd.
In the above image you can see how futures open interest of Reliance Industries Ltd. for cumulative three expiries: Current month, next month and far month expiry. You can see it has changed over time. The yellow bar shows the total futures open interest at a particular date and the change is represented by a green line or red line which indicates addition or reduction of OI respectively.
Here, the important thing is to analyze the change in open interest along with a change in the spot price of Reliance Industries Ltd.
For instance, a new long is created when there is a rise in price and a rise in open interest, which is generally a bullish sign, whereas a new short is just the opposite, where there is a price decline along with a rise in open interest. However, long unwinding and short covering are not that simple. Let’s explore the difference between them one after another.
What is Long Unwinding?
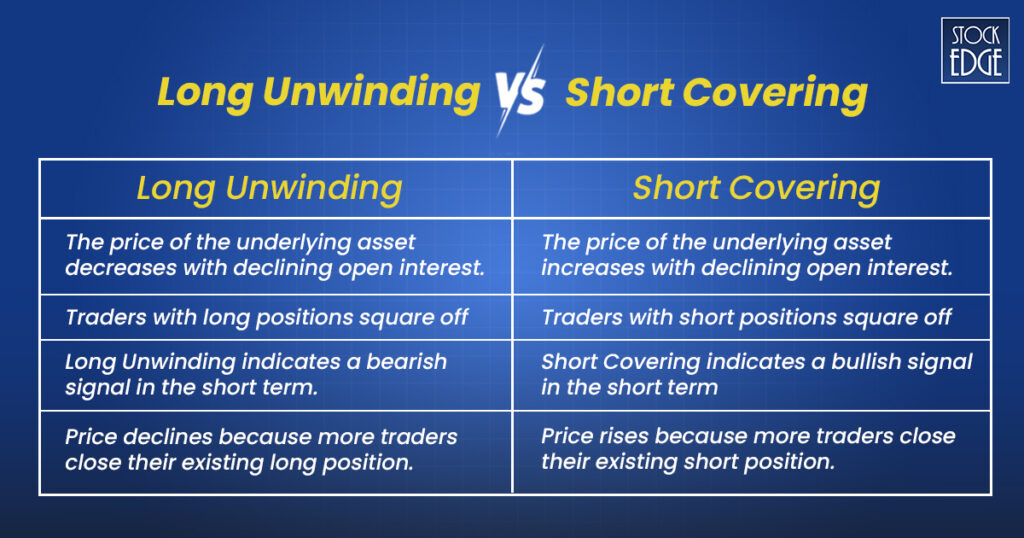
Long unwinding means a scenario where the stock price is declining along with a decreasing futures open interest.
Long unwinding, also known as long cover, occurs when traders holding long positions in stock futures decide to sell or close the existing positions. This could occur due to various reasons, such as locking in profits, reducing exposure, or responding to market conditions or volatile sentiments.
To have a more clear understanding of the concept of long unwinding, let’s take an analogy.
Imagine you are a farmer who has bought a large quantity of seeds (think of it as stock futures) because you anticipate a good harvest season and higher prices for the crops (think of it as the underlying stocks). You are essentially betting on the future rise in the value of these crops.
However, as time goes by, you start seeing signs that the weather might not be as favorable, or perhaps you find out that the market for your crops isn’t as strong as you initially thought. To avoid potential losses or to secure the gains you have made so far, you decide to sell some or all of your seeds before the planting season ends.
This action of selling your seeds (closing your long positions in stock futures) is similar to long unwinding. You are reducing your stake in anticipation that the prices might not rise as you initially expected, or you simply want to lock in the profits you have already gained.
When, Why and How Long Unwinding or Long Cover Impact?
Some of the key attributes of long unwinding in stock futures are as follows:
- Traders might engage in long unwinding to lock in profits, minimize losses, or reduce their exposure to market risk.
- When many traders start unwinding their long positions, it can lead to a decline in the price of the futures contract as supply exceeds demand.
- Long unwinding can be an indicator that traders are becoming cautious or bearish about the future prospects of rise in the underlying asset.
How to Identify Long Unwinding in Stocks?
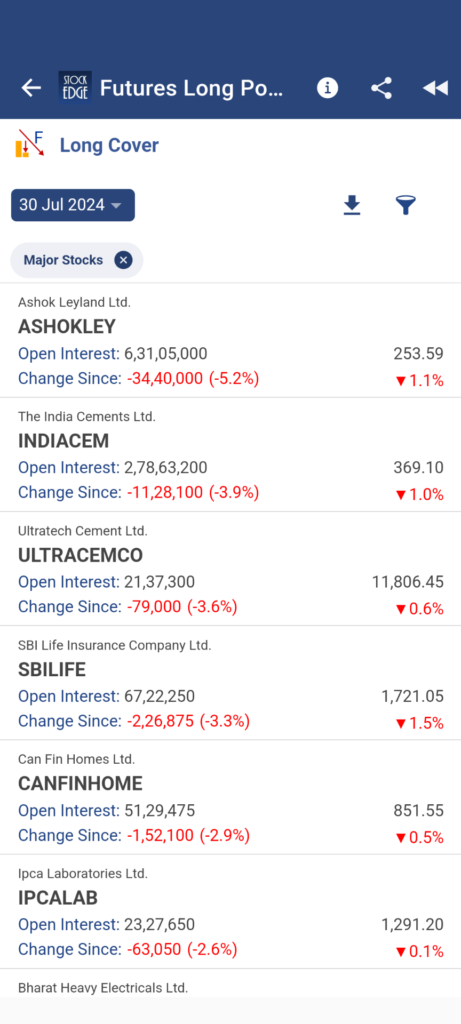
Using StockEdge, you can easily analyze long unwinding in stock futures. We have dedicated scans for futures and options, where you can view the list of stocks where long unwinding or long cover is observed on a daily basis.
As you can see in the above screenshot, the long cover scan in StockEdge provides the list of f&o stocks where long unwinding is witnessed. However, please note that long unwinding in stocks does not necessarily suggest a bearish signal. But indicates a long traders are booking profits. Moreover, you must analyze the price chart and then make an OI analysis for more conviction on your trade.
Now, let’s dive into the concept of short covering.
What is Short Covering?
Short covering means the traders who hold short positions in stock futures decide to square off their positions. This can happen to lock in profits, minimize losses, or because of a change in market conditions that makes maintaining the short position undesirable. It indicates a price rise in the short term due to traders covering the short position.
This action of buying back or covering your short positions in stock futures is known as short covering. You are reducing your risk by closing your short position before the price rises further.
For instance, let’s say you are holding a short position in SBI stock futures and you are in profit. So, decide to square off your short position meaning buying back the stock futures. Now, imagine a significant number of short positions holders are squaring off their position which triggers a short term bullish momentum in the stock. Therefore, short covering may usually trigger a bullish momentum in the stock in the near term.
When, Why and How Short Covering Impact?
Some of the key attributes of short covering in stock futures are as follows:
- Traders might engage in short covering to lock in profits if the price has fallen as expected, to minimize losses if the price is rising, or because of a change in market sentiment or news.
- When many traders start covering their short positions, it can lead to an increase in the price of the futures contract as demand increases.
- Short covering can be an indicator that traders are becoming cautious or bullish about the future prospects of the underlying asset.
How to Identify Short Covering in Stocks?
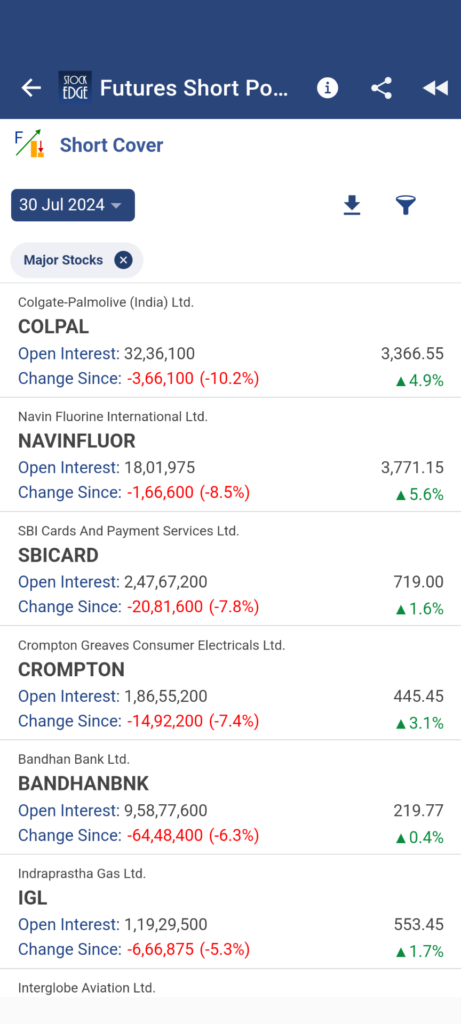
Yes, you have rightly guessed that using StockEdge scans you can easily identify short covering in stock futures. Get the list of stocks witnessed short covering in stock futures. Use the StockEdge scan: Short Cover
In the above screenshot, you can view the list of stocks which have faced short covering as of 30th July 2024. Do note that not every stock which exhibits short covering gives a bullish signal. Moreover, first you need to analyze the price chart and then look for Oi analysis for added conviction in your trade.
Now that you know what long unwinding and short covering are, it is time you know the fundamental difference between the two, which can help you make trading decisions while dealing in F&O trading.
Difference between Long Unwinding & Short Covering
Is Long Unwinding or Short Covering Good?
Good or bad depends on the position which you are holding in stock futures. Moreover, you should focus on the OI analysis of a stock over a period of time to know the trend of a stock and could provide useful insights about its ongoing trend by analyzing long unwinding, short covering, or even new longs and shorts.
A long unwinding in an up trending stock could indicate profit booking and suggest resistance in the short term. Using the OI analysis feature of StockEdge, you can analyze f&o stocks futures open interest position. Here is how?
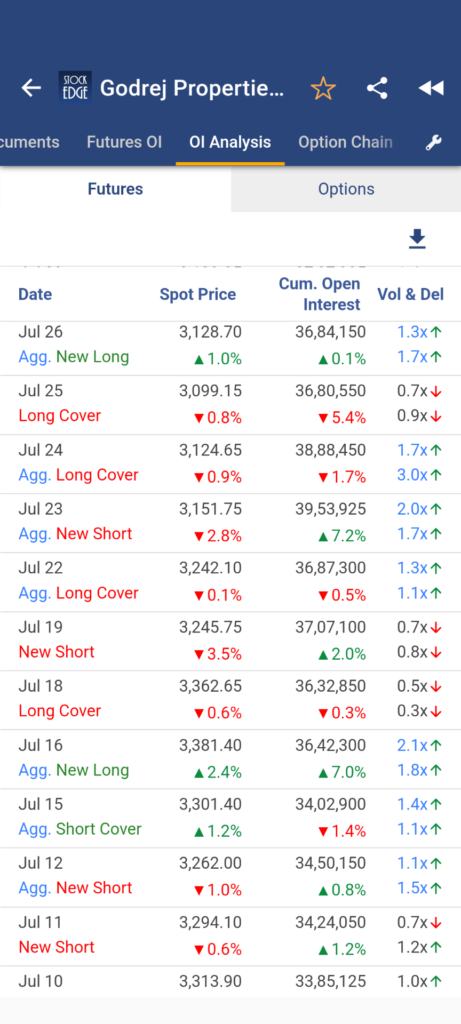
Take the example of Godrej Properties Ltd.
The OI analysis of Godrej Properties Ltd. showcases the change in spot price and cumulative open interest which indicates long unwinding, short covering or new long and new shorts. Now, if you look closely at historical data, 18th July witnessed long unwinding followed by new shorts and long covering till 25th July.
So, how did the price react?
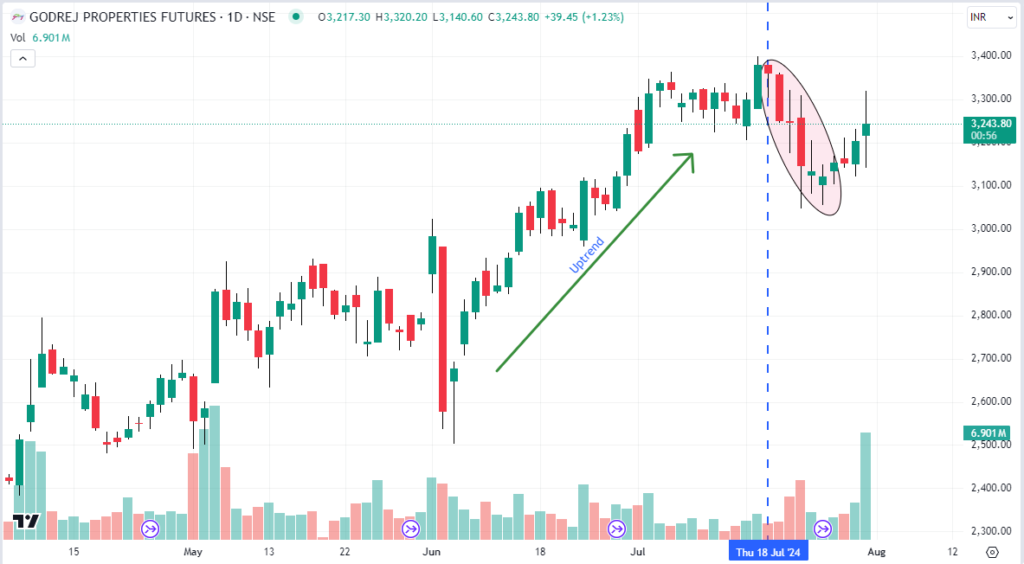
Take a look at the daily price chart, the stock was in an ongoing up trend and post 18th July long cover there has been a pull back. That’s how you can analyze stock futures using OI analysis.
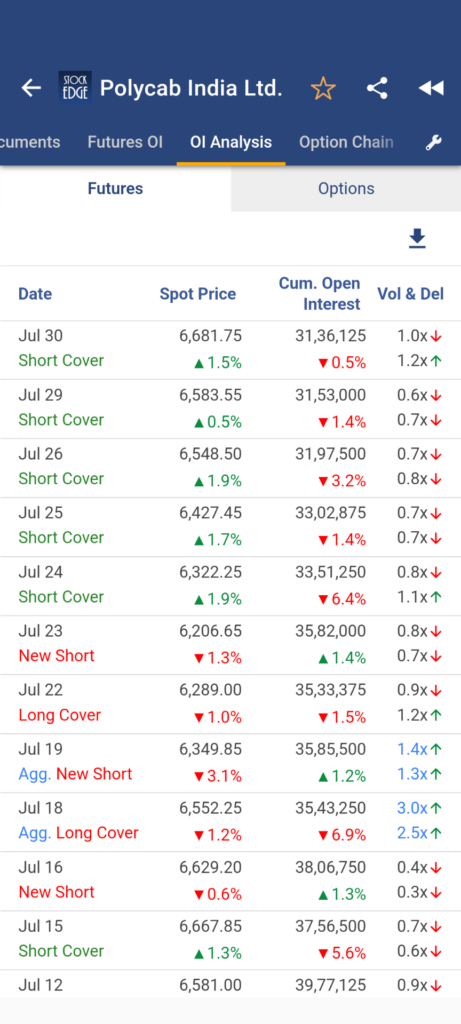
Similarly, let’s take an example of short covering by taking an example of Poly Cab Ltd.
The Oi analysis of the stock suggests there has been a short covering in recent trading sessions which means there is rise in the stock price along with decrease in open interest.
So, how did the price react?
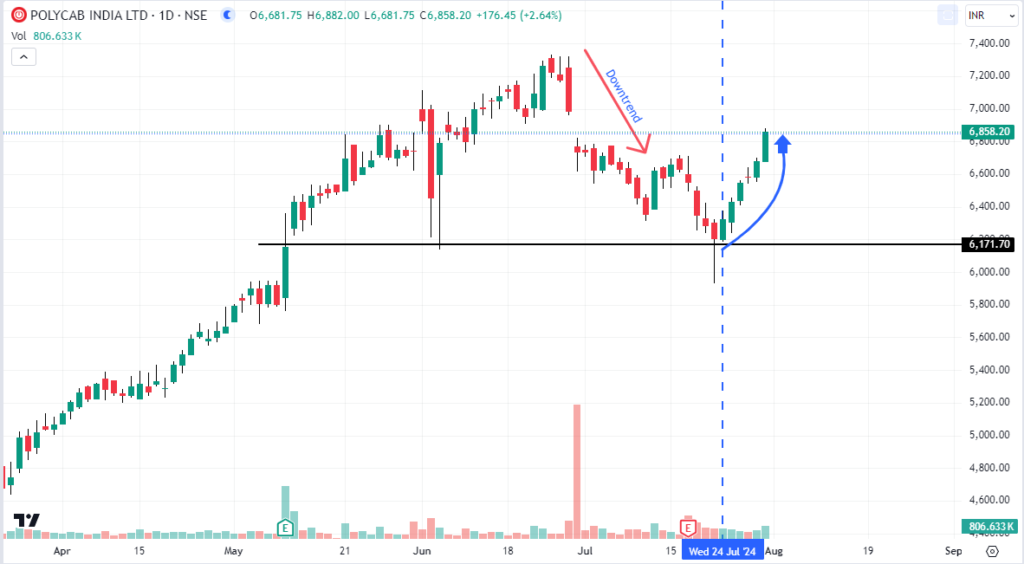
The intermediate trend of the stock was declining and as per OI analysis short covering started on 24th July and since then the stock made a bounce back from its support level as per daily chart.
Here the important part to note here is that the stock hits a support level and bounces back and during the bounces back based on Oi analysis you can see short covering in the stock, which gives an added conviction of a reversal in the stock. Therefore, first and foremost analyze the price action movements and then do an OI analysis to get a better understanding of probable price action moves in a stock.
In StockEdge, we have a dedicated feature of Derivative analytics, where you can easily analyze the OI trend of stocks listed in the derivative segment. It is a very great tool to analyze f&o stocks. To learn more about features you can refer to the blog: Derivative Analytics: Unlock the Power of Derivatives to analyze Stocks!
The Bottom Line
In conclusion, understanding the dynamics of long unwinding and short covering can provide crucial insights for stocks and trading strategies. Long unwinding suggests a shift towards caution or bearish sentiment, potential price declines, while short covering indicates a move towards optimism or bullish sentiment, potentially heralding price increases. By recognizing these patterns, you can identify lucrative trading opportunities, adjust positions accordingly, and enhance your risk management. This nuanced understanding of market behaviours not only aids in making informed decisions but also empowers you as a trader to navigate the complexities of the stock market with greater confidence and precision.
Happy trading!
Frequently Asked Questions (FAQs)
1. When does short covering typically occur?
Short covering happens due to multiple reasons – profit booking by short sellers, margin pressure, or a shift in market sentiment (bullish reversal).
2. Is long unwinding always a bearish signal?
Not always. While it can suggest profit-taking or a shift to a cautious outlook, it may also happen in consolidation phases, so one must consider context.
3. How can traders use StockEdge to spot long unwinding or short covering?
Using StockEdge scans (like “Long Cover” or “Short Cover”), you can view stocks where unwinding or covering is happening then analyze price + OI trends for confirmation.


