Table of Contents
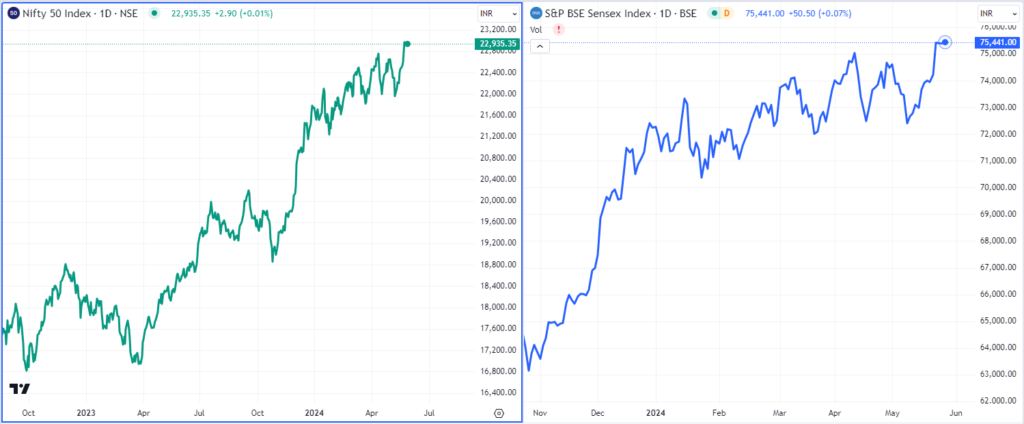
The Indian stock market, ahead of Lok Sabha elections, made an all-time high. In recent times, the benchmark indices like the BSE Sensex and Nifty 50 made new highs of 76000 and 23000 levels respectively.

During such a boom where markets are at life-high levels, the majority of stocks are at their all time high or at their 52-week high levels. So, should you consider investing in all time high stocks? There is always a dilemma among market participants about whether buying all time high stocks is a good decision because there is a probability that the price may fall in the near future or the stock might have already made its run, and investing at such high levels seems expensive to many investors. Now, that’s a myth to some extent. Why?
This blog will guide you in decoding the myth behind investing in all time high stocks. But for someone who has doubts about what exactly all time high stocks are, Here is a brief introduction:
What are All Time High stocks?
All-time high stocks are shares of companies that have reached their highest trading price ever recorded on the stock market. Think of it like a sports record: just as an athlete sets a new personal best, an all-time high stock hits its peak price, surpassing all previous records. Investors often see these peaks as a sign of a company’s strong performance and potential for future growth, although it also raises questions about whether the stock might be overvalued. Essentially, an all-time high is a milestone that signals the company is performing exceptionally well in the eyes of the market.
Similarly, there are all-time low stocks as well; let’s understand which of those stocks are.
What are All Time Low stocks?
All-time low stocks are shares of companies that have reached their lowest trading price ever recorded on the stock market. This is akin to an athlete hitting their worst performance record, indicating the company is facing significant challenges or losing investor confidence. Such lows can signal distress or poor performance, but they might also present buying opportunities if investors believe the company can recover.
How to identify which are All Time High stocks and All Time Low stocks?
The best way to identify all time high stocks or all time low stocks is by using StockEdge. Yes, simply fire-up the StockEdge app in your smartphone or visit web.stockedge.com.
Go to the explorer tab and you will find Trending Stocks as shown in the image below:

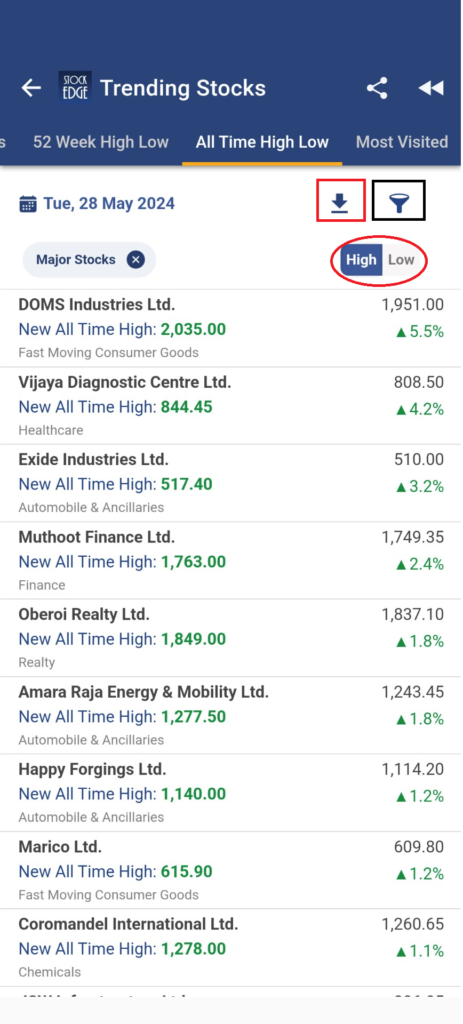
Once you click the trending stocks icon, you find multiple tabs like Price movers, Volume shockers, 52 Week High Low, All Time High Low and Most Visited. By clicking the All Time High Low tab, it will show you the list of stocks which are hitting it’s all time high or its lifetime lows. By default, it will present you with the list of major stocks which are currently hitting its all time highs in the stock market.

As of 28th May 2024, stocks like Exide Industries Ltd. Muthoot Finance Ltd. Oberoi Realty Ltd. Marico Ltd. and other lists of stocks have made new all time highs in the market.
Moreover, you can even download the list of stocks in your excel for further analysis. Other than that, you also have an option to filter to view the desired basket of stocks which are making new life highs in the stock market. By default it shows major stocks in the stock market which consist of Nifty 500 and S&P 500 stocks. But you can easily filter out only F&O stocks, or Nifty 50 or Nifty 200 stocks as per your preference.
Now that you have understood what all time high stocks and all time low stocks are and how to identify such stocks using StockEdge app. You may be interested to find out which is better? Should you buy all time high stocks or all time low stocks?
Which is better? Buy All Time High stocks Or Buy All Time low stocks
Let’s understand this with the help of two different scenarios:
Scenario 1: Buy All Time High Stocks
Suppose, you invested in a stock which is at its All time high levels, but there is always a downside to it that the stock may have already rallied and current at expensive valuation and soon price may reverse. However the probability is far less because of the simple reason that if the stock price is at its life high levels, then there must be some good reason behind it such as good company financial or strong reputation in the market that the all-time high stocks have far much potential for growth in the long term.
Scenario 2: Buy All Time Low Stocks
Similarly, when you buy stocks that are at an all time low, the basic thinking is that the stock is currently at a low valuation and at such low valuation there could be a rise in demand for buying the stock which could eventually lead to reversal of the stock price. However, logically, when the stock is making all time lows, the main reason behind this could be the stock’s poor financial performance or the company’s high leverage and inability to cover up its interest obligations. These could be some of the reasons behind a stock hitting its lifetime lows.
Therefore, it can be concluded that buying all time high stocks which are backed by good financial performance is far better than buying all time low stocks with poor financial performance.
However, not all the stocks that are trading at their life highs can be a good investment opportunity. So, how to identify which all time stocks to invest in?
Strategy for All Time High Stocks
Be it in the stock market or in life, a well-planned and properly implemented strategy is essential for success. Investing in all time high stocks can be highly rewarding only if you enter at the right time to ride the ongoing momentum of a stock backed by strong financial performance.
Hence, a techno-funda approach would be a more logical strategy for investing in All Time High stocks.
Technical Parameters:
There are only two technical parameters based on which a stock’s momentum can be analyzed, which are as follows:
- RS (Relative Strength) : RS of a stock determines whether it is outperforming the Indian benchmark index Nifty 50. A positive RS indicates stocks are outperforming the benchmark which suggest strong momentum and vice-versa in case of negative RS. You can use the Relative Strength (RS) scans to identify stocks which are outperforming the benchmark index.
- RSI (Relative Strength Index) : The Relative Strength Index (RSI) is a momentum oscillator. It measures the speed and change of price movements compared to its own historical price in a particular period. It ranges from 0 to 100 that identify overbought or oversold conditions in a stock. However, if RSI is greater than 50, it generally indicates the stock has strong momentum at current level. You can use the Relative Strength Index (RSI) scans to identify stocks with strong momentum.
From a fundamental perspective, there are 3 parameters to analyze all time high stocks. They are as follows:
Fundamental Parameters:
- Total Revenue: A company’s top line growth which is a rise in total revenue of a company is essential for future growth in the company. So, even though stocks are making all time high but there is no growth in the company’s total revenue then these stocks should be avoided. You must identify those stocks where the total revenue of the company is steadily rising YoY.
- Diluted EPS: Basic EPS (Earnings Per Share) is net income divided by the total number of outstanding shares. However, unlike basic EPS, diluted EPS provides a more comprehensive view by including potential shares that could be created from convertible securities, such as stock options, warrants, and convertible bonds.
Analyzing diluted EPS is more important because it offers a realistic assessment of a company’s earnings per share, reflecting the potential dilution that could impact current shareholders’ value if all convertible securities were converted into common stock. So, if a company’s diluted EPS is also increasing YoY which means that company is increasing its shareholders value over time. - PE Ratio: Price-to-Earnings (PE) ratio is a valuation metric that compares a company’s current stock price to its earnings per share (EPS). It is calculated by dividing the stock’s CMP by EPS. It helps investors determine if a stock is overvalued or undervalued by comparing it to the company’s earnings. A high PE ratio often indicates that investors expect high growth in the future and are willing to pay a premium for it. Conversely, a low PE ratio may signal that the stock is undervalued or that the company is facing challenges, indicating skepticism about its growth potential.
However, Investors should be cautious about investing in especially all time high stocks with very high PE ratios because these stocks may be overvalued. A very high PE ratios can signal speculative bubbles, where prices are driven more by investor sentiment than by fundamental value. Thus, while some high PE stocks may continue to perform well, they carry a higher risk, making it important for investors to carefully evaluate whether the high valuation is justified by the company’s actual performance and potential.
Steps to invest in All Time High Stocks
- Step 1: First you need to download the list of stocks from the StockEdge app that are currently making all time highs in the stock market.
- Step 2 : Create a watchlist for all the all time high stocks in your charting software (preferably Tradingview)
- Step 3 : Then start analyzing each stock based on the above parameters in the monthly chart and weekly chart. A longer time frame will give you an overview of its long term trend, whereas the short term time frame charts will help you to get entry and exit points.
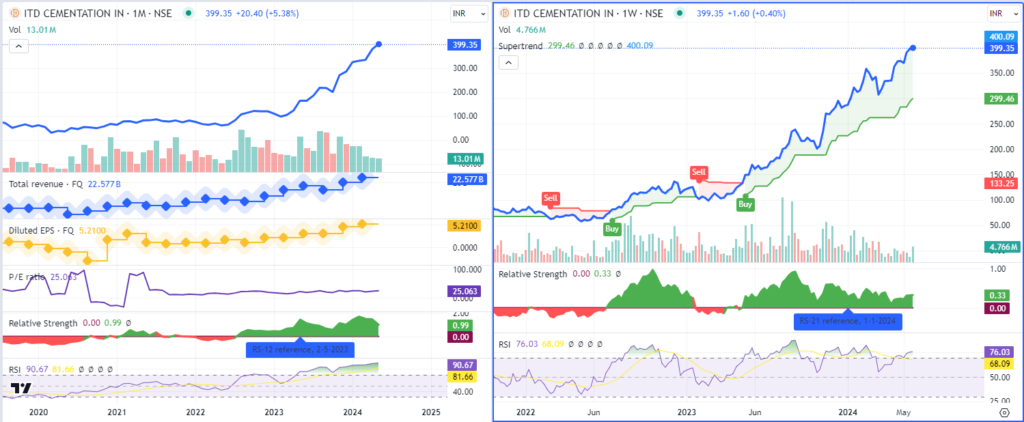
For instance, look at the chart of ITD Cementation India Ltd.

The above chart shows the monthly chart where you can see the total revenue and diluted EPS are in constant rise, whereas the PE ratio more less remained stable. This indicates that the valuation is moderate.
Moreover, the 12 period RS is positive in both monthly chart and weekly chart indicates stock has been outperforming the benchmark index, where 12 period RSI is also above 50 suggest bullish momentum in the stock. The stock has given a buy signal based on supertrend and post that the stock has rallied beautifully!
You can also watch this video, which gives a detailed explanation of how you can identify stocks for your investment portfolio.
The Bottom Line
Riding the momentum in stocks is the key to investing in all time high stocks. However, investing at higher levels can be highly rewarding and risky at the same time. Hence, a strategic entry and exit in such all time high stocks is essential to generate alpha for your portfolio. Investing in all time high stocks is essentially momentum investing. Momentum investing has the potential to generate alpha returns for your portfolio in relatively short periods of time. Even though you are a follower of value investing, allocating a small portion of your portfolio into strong momentum stocks could inflate your overall return in your portfolio.
Confused with value investing and momentum investing. Here is an explanation you can read: Unveiling the Battle Between Value Investing and Momentum Investing and finding out which investment style suits you best.
Happy Investing!


