Key Takeaways
- StockEdge Stock Screener: One of the most powerful tools to filter 6,000+ listed Indian stocks, built for both traders and investors.
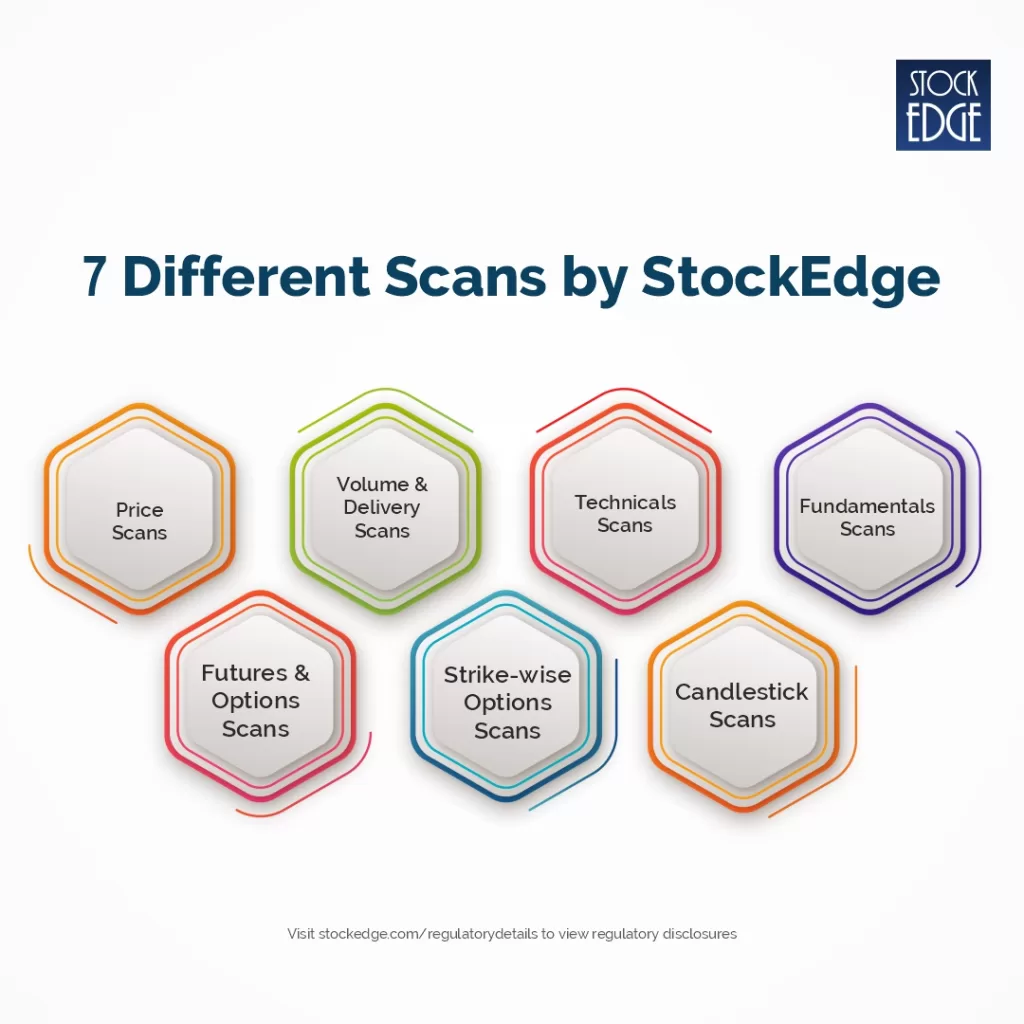
- Types of Screeners: Includes Price, Volume & Delivery, Technical, Fundamental, F&O, Candlestick, and Combination scans.
- How It Works: Scans use pre-set criteria like breakouts, RSI, EPS growth, or open interest to generate daily updated stock lists.
- Benefits for Traders & Investors: Traders can catch momentum and reversals, while investors focus on strong fundamentals without wasting time.
- Customisation & Flexibility: Users can build their own combo scans, tailoring strategies to fit their personal trading or investing style.
Have you ever wondered how many stocks are listed in the Indian stock market? You will be astonished to hear that there are 6000+ listed companies combining both the National Stock Exchange (NSE) and the Bombay Stock Exchange (BSE)
Now, if you are an investor or a trader, how will you identify stocks for your portfolio? Will you read the financial statements or analyze the price charts for 6000+ stocks? That would be a nightmare for a beginner and would simply make no sense even if you are a pro in the stock market.
At StockEdge, we’ve built one of the best stock screeners for Indian stocks, designed to empower retail investors. This powerful stock scans helps you run different stock screener based on price, volume, technicals, fundamentals, derivatives, and even candlestick patterns.
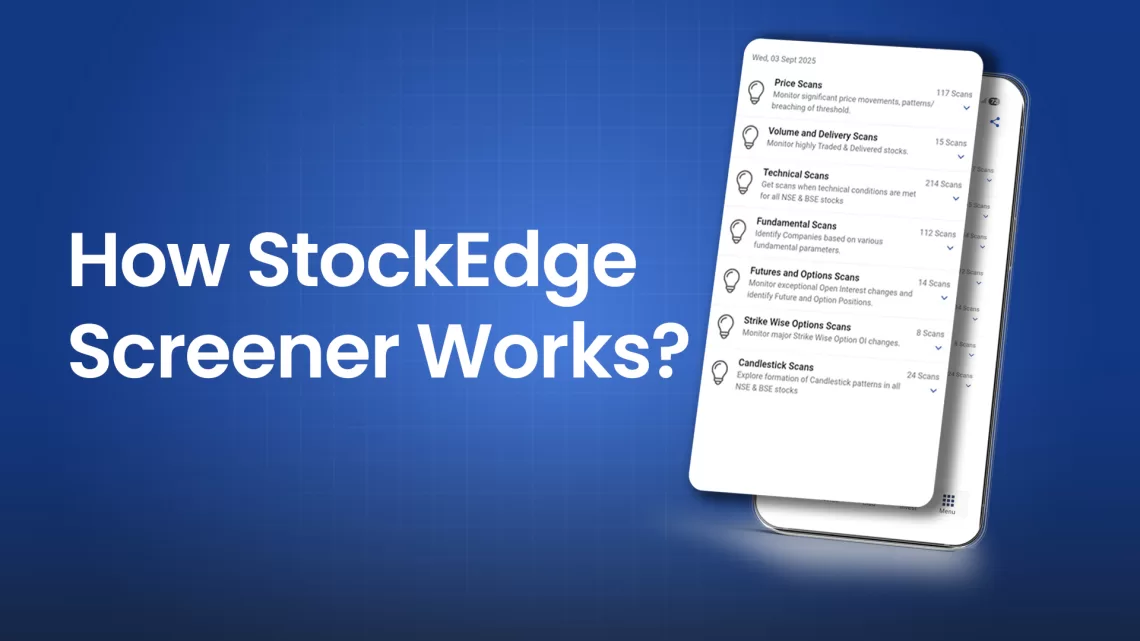
With these scanners for stocks, you can quickly find opportunities in the market instead of spending hours searching. Whether you’re looking for short-term trades or long-term investments, StockEdge gives you the right screener for Indian stocks. Here are the list of StockEdge Scans
You will find the scanning tools under the Premium analytics section of StockEdge named “Scans.” Just click on Scans to get the list of different categories of scans, as shown in the screenshots below:
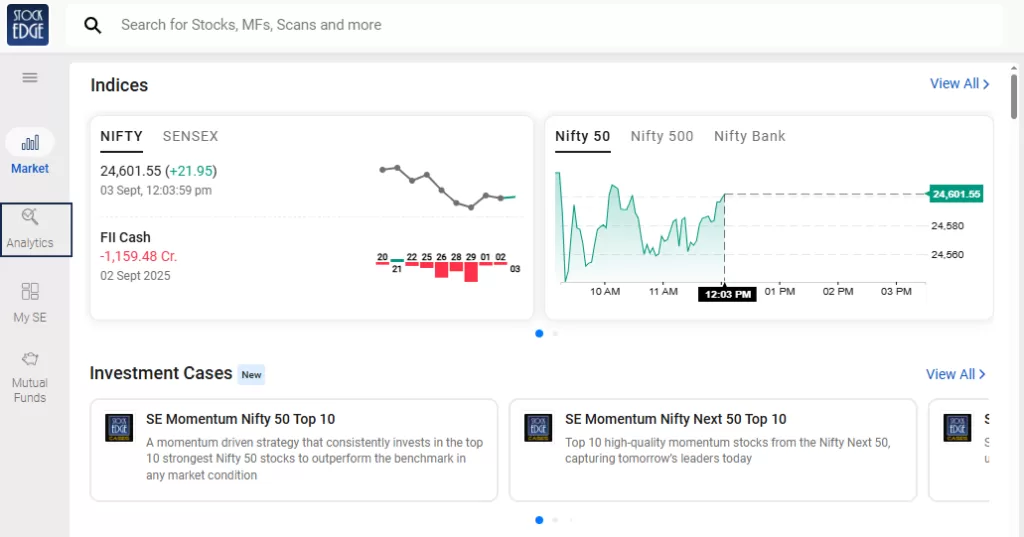
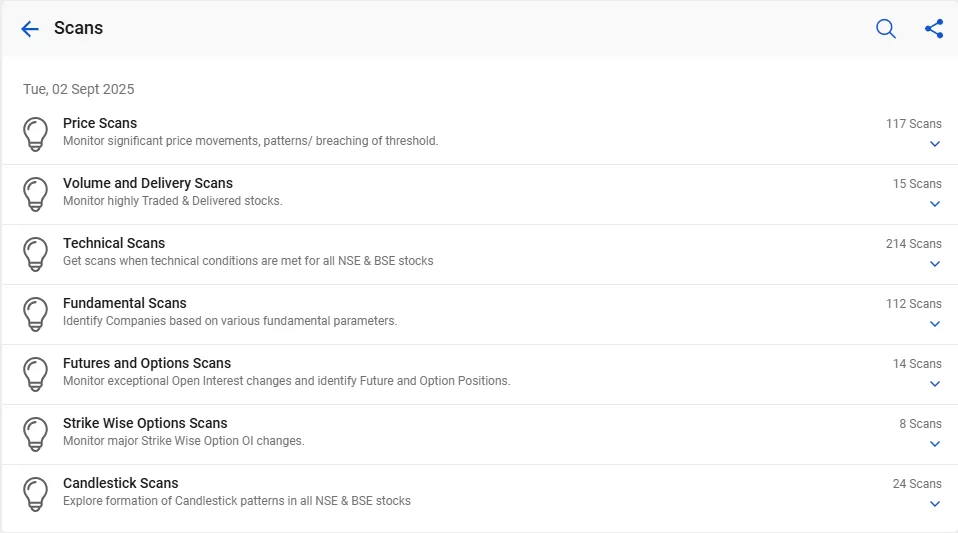
Now, if you are an investor, stock trader or equity derivatives trader, you can use Scans from our various categories which suit your personal trading or investing style. With StockEdge Scans, identify the right stocks at the right time so that you don’t miss any opportunity in the stock market using this stock screener.
In this blog, we will explore all the categories of scans and highlight some of the best scans in each category to illustrate with real-life examples. So, without any further ado, let’s begin with the first category of scan, which is the “Price Scans.”
Price Scans
You may be familiar with a common phrase, “Bhav Bhagwan hai”, meaning Price is supreme in the market, and every other thing follows the price. Hence, screening the stocks based on price movement could be the best way to identify stocks, especially if you are a trader.
Under Price scans, you will find an extensive list of scans, such as breakout scans, price behavioral scans, scans based on the relative strength of a stock, etc. (as shown in the image below)
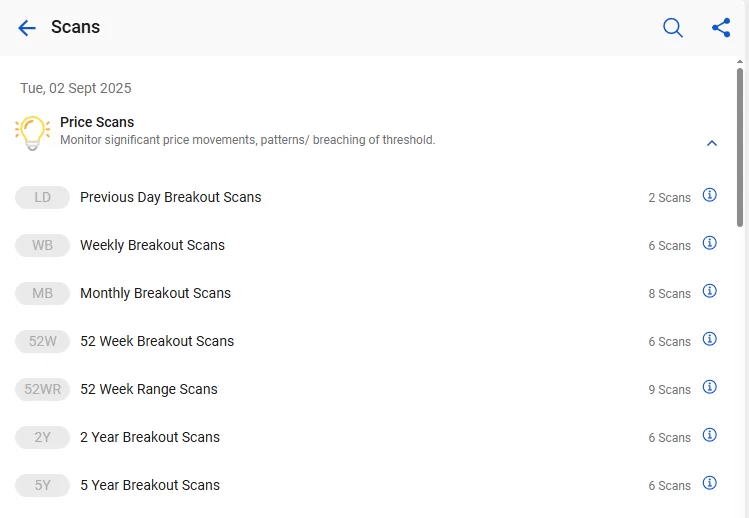
This is a price-based stock screener. Suppose you are a short-term trader, you may find breakout scans to be very helpful. Generally, when a stock breaks above the previous day’s high or the previous week’s or month’s high, it is considered to be a strong stock, right? Now, with the help of this screener for stock selection, you can easily identify strong stocks for your trade.
Weekly Breakout Scans
Let’s take an example of weekly breakout scans, under which you will find multiple stock screeners (as shown in the image below)
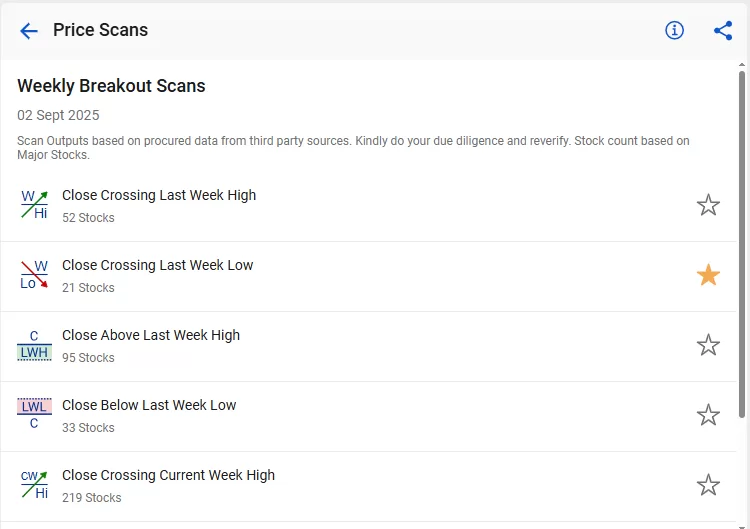
Here, you can scan for both bullish and bearish stocks, such as:
Close Crossing last week’s high – Under this stock screener, you will get the stock that gives a daily closing above the previous week’s high, it is a bullish signal. Stocks that have fulfilled this criteria will appear under this scan. Click on it to see the list of stocks.
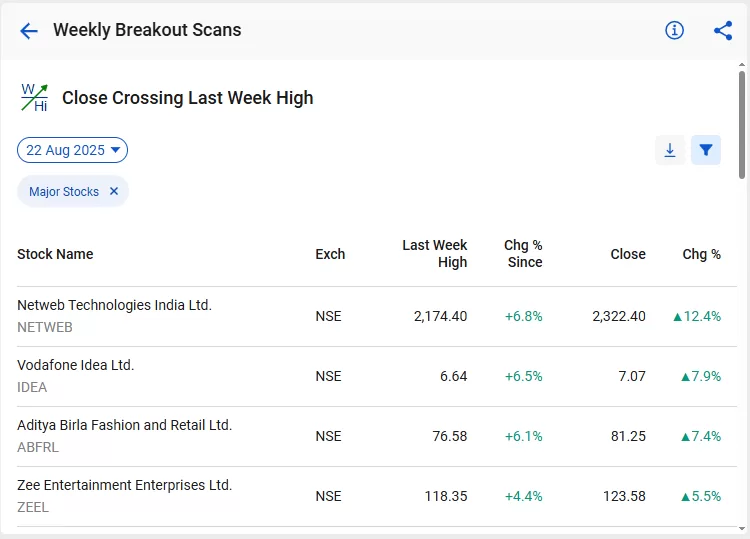
As you can see in the above image, here is the list of major stocks that have fulfilled the criteria; you can also download the list in a CSV file for further analysis. By default, it shows major stocks (Composite basket of Nifty 500 and S&P 500 Stocks), but you can easily filter stocks if you wish to see stocks only from Nifty 50 or only F&O Stocks. The list is updated at the end of the day. However, if you wish to see back-dated data, you can easily check the past 7 days’ scan results.
Going forward with the example, the stock of Netweb Technologies India Ltd. appeared on the scan on 22th August. Let’s get to the price chart now!
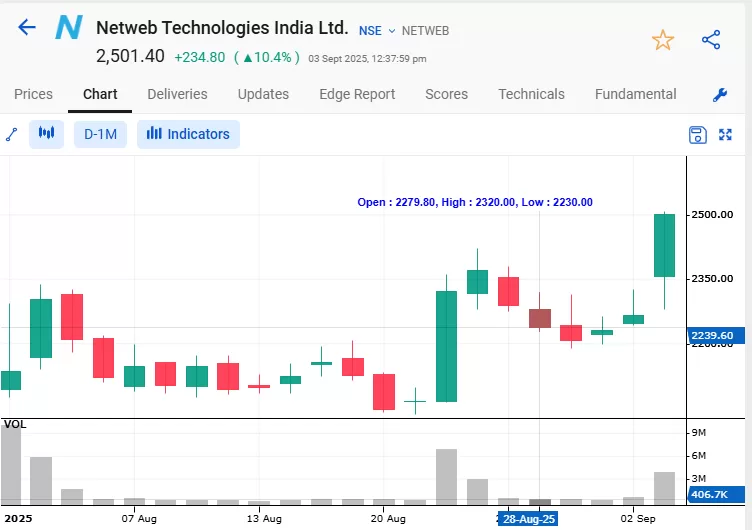
The above image is the daily chart, which shows that the stock price has increased by almost 8.8%.
The next price scan is “Close Crossing Last week’s Low”, which is a bearish signal as the stock price has given a daily closing below the previous week’s low.
In a similar way, you can explore other weekly breakout scans or in other time frames like daily, weekly, monthly and yearly.
Price Behavior Scans
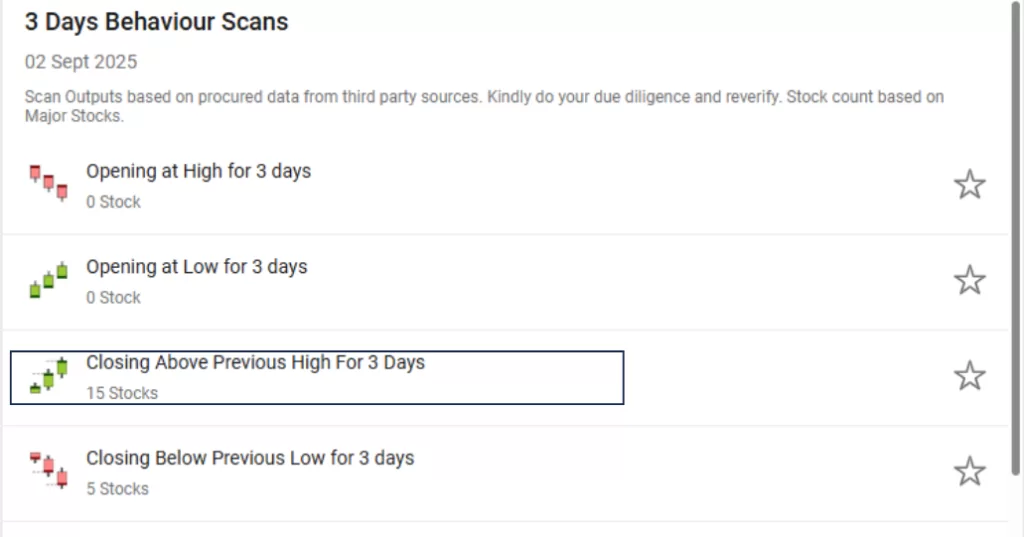
We move to the next set of price scans based on the 1-day, 2-day and 3-day price behavior of a stock. Let’s check out 3 days’ price behavior scans to find out how to identify strong stocks.
Exploring 3 days’ price behavior scans, you can find both bullish and bearish trades as per the selected scan. Let’s select higher highs for 3 days.
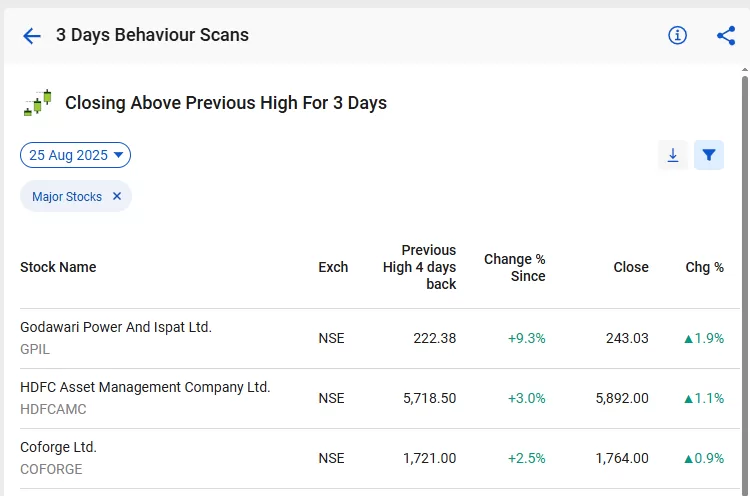
Let’s take a look at the chart of Godawari Power and Ispat Ltd. and how the stock price has changed after it appeared on the list on 25th August.
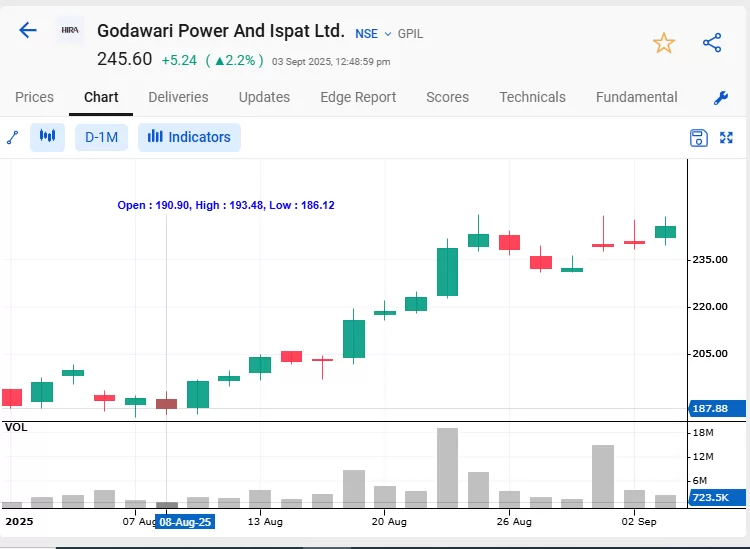
As you can see in the above chart, the stock has sharply moved 9.3% after making higher highs for the past 3 days (marked in red arrows).
Relative Strength Scans
We move to the next set of price scans based on the relative strength of a stock, commonly known as RS.
If you are not aware of what’s relative strength or RS? This is basically a comparative analysis of a stock compared to its benchmark (it can be the Nifty 50 index or sectoral index).
However, ideally, our scans are developed keeping in mind the benchmark index of the Indian stock market, which is Nifty 50. Therefore, if the stock has positive RS, it is considered bullish, meaning the stock is outperforming the benchmark, whereas if the stock has negative RS, it is considered bearish, meaning the stock is underperforming the benchmark.
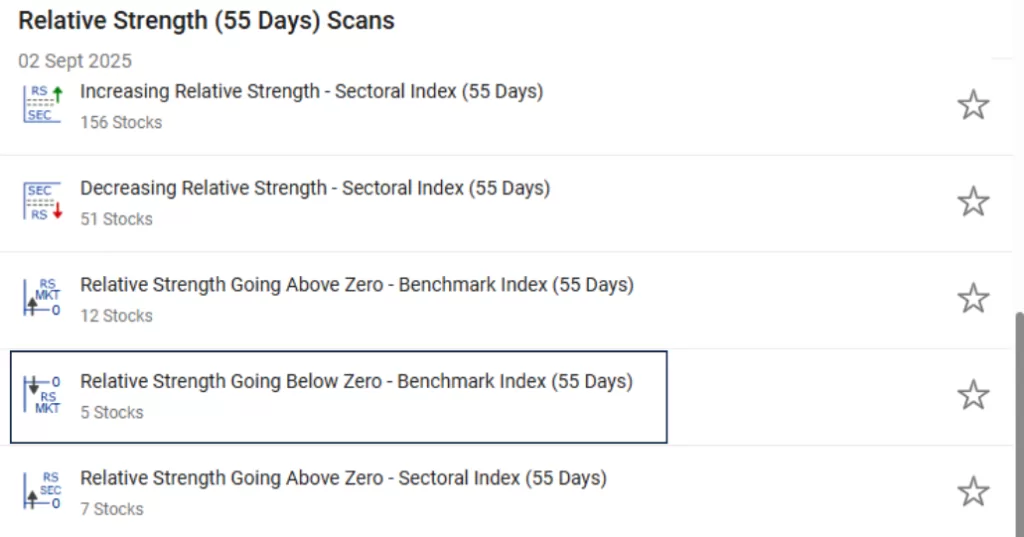
Let’s explore RS (55) scans. This basically identifies stocks that have outperformed the benchmark or the sector in the past 55 days. There are various scans listed under it (as shown in the screenshot below), and find out the list of stocks that have just started to outperform the benchmark index with RS (55) going above 0.
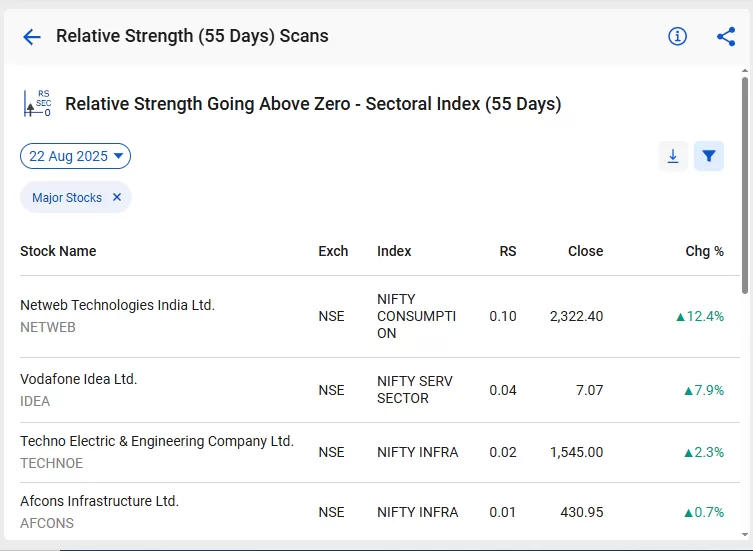
On 22nd August, Netweb Technologies India Ltd. appeared in the screener (RS 55 turned positive). Let’s see the price chart of PAYTM and how it has performed since then.
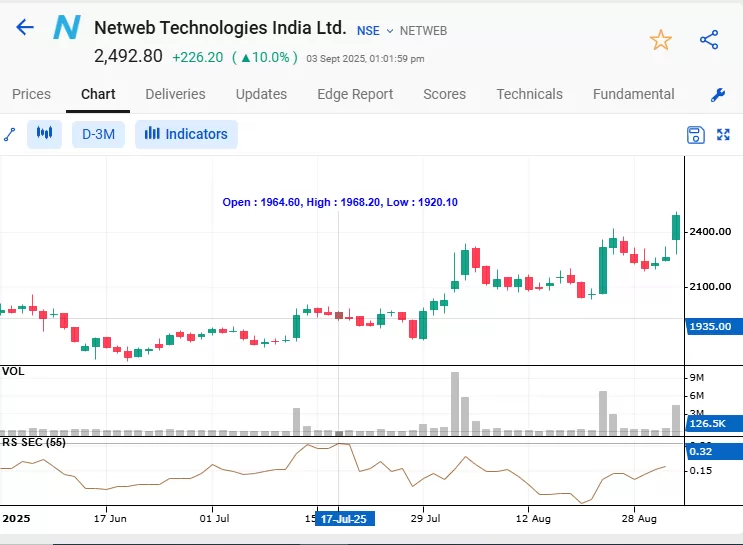
As you can see in the above image, the stock has surged 10-12% after its RS 55 moved above 0.
Hope you have understood the importance of Price in the stock market and how useful are the different types of price scans while trading. However, please note that all these scans are updated at the end of the day (EOD), and based on that, you will be able to make an informed decision on the next trading day.
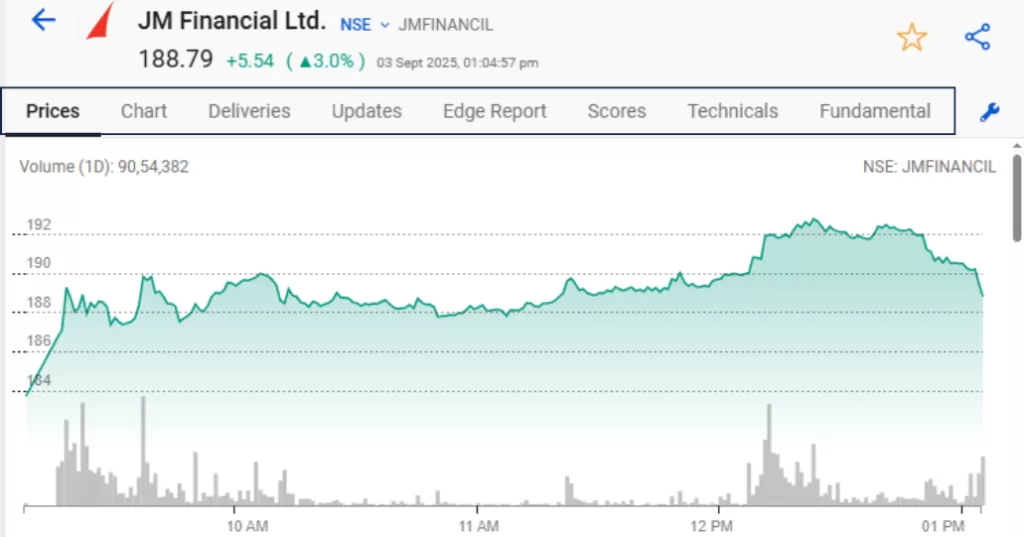
Also, while screening the stocks, if you wish to analyze further, simply click on the stock name; you will able to see its chart, its financials, shareholding patterns and more by scrolling the tab (as highlighted in the screenshot)
Volume & Delivery Scans
Volume refers to the number of shares of a particular stock that are traded during a specific period, typically a trading day. It is a measure of the level of activity and liquidity in the market for that stock.
On the other hand, Stock delivery involves transferring the ownership of shares from the seller to the buyer. For example, if you bought 100 shares of ITC Ltd. and you did not sell 100 shares on the same day, that means you are carrying your long position in the stock overnight. It means you have taken delivery of the shares, and it will be reflected in your demat holding under your portfolio.
Both volume and delivery are considered the scond most important thing after price while analyzing the charts. Any price move combined with high volume or higher-than-average delivery adds more credibility to its price trend.
Under this category of scan, basically, you can identify stocks that have witnessed high traded quantity, high delivery quantity, higher delivery percentage or a combination of both (High Trade and Delivery Quantity or Percentage)
- High Trade Quantity or High Delivery is considered when it is greater than 1.5x the average quantity or the average delivery quantity, as the case may be for the last 5 days. This signifies higher interest in that stock by the market participants.
- Delivery percentage is the delivered quantity of a stock expressed as a percentage of a traded quantity. It is considered to be high when it is greater than or equivalent to 75%.
You can run these scans on three different time frames: daily, weekly or monthly. (as shown below)
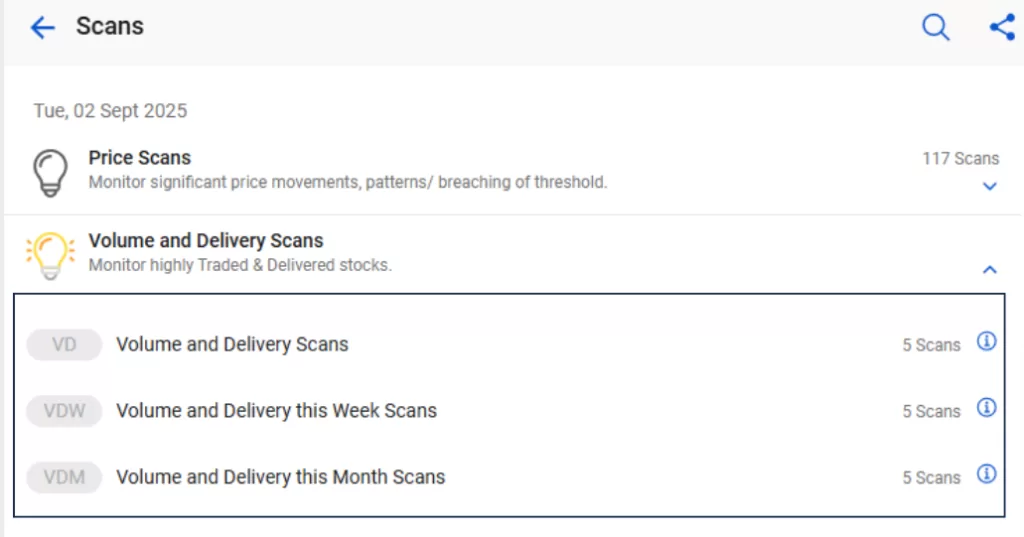
Selecting Volume and Delivery scans, you will have a list of individual scans, such as high traded quantity, which is essentially the volume of the stock. Also, you can stocks that have high delivery volume both in terms of quantity and as a percentage of volume.
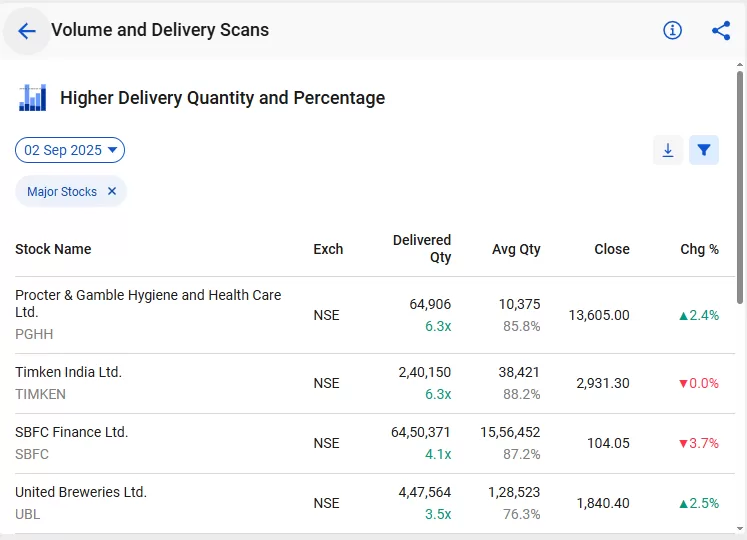
Let’s scan the stocks which have High Delivery Quantity and Percentage:
Technical Scans
This is by far the most useful and important category of scans if you are a trader in the stock market. We have developed technical indicator-based powerful scans for you so that you take entry and exit stocks at the right time and at the right pierce level. This is essentially a “trader’s paradise.”
We have a comprehensive list of stock screener based on technical indicators, ranging from basic Simple or Exponential Moving averages to highly advanced Ichimoku Cloud scans and Momentum Score. (see the image below for the entire list of indicator-based technical scans!
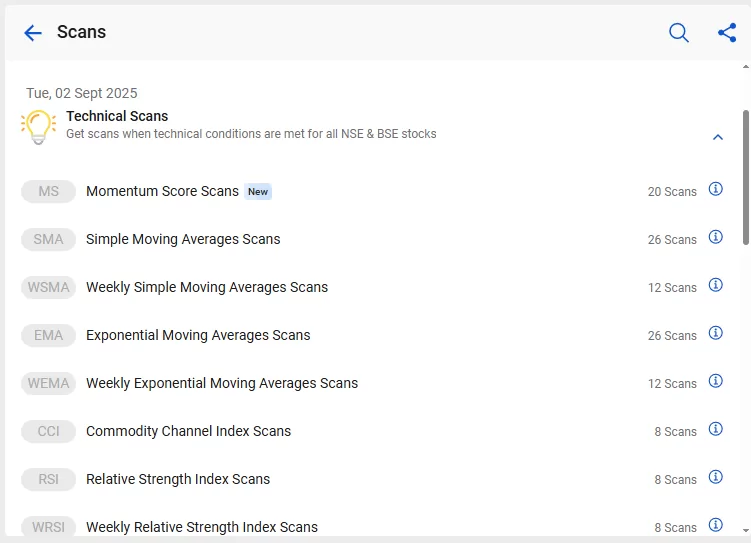
Momentum Score
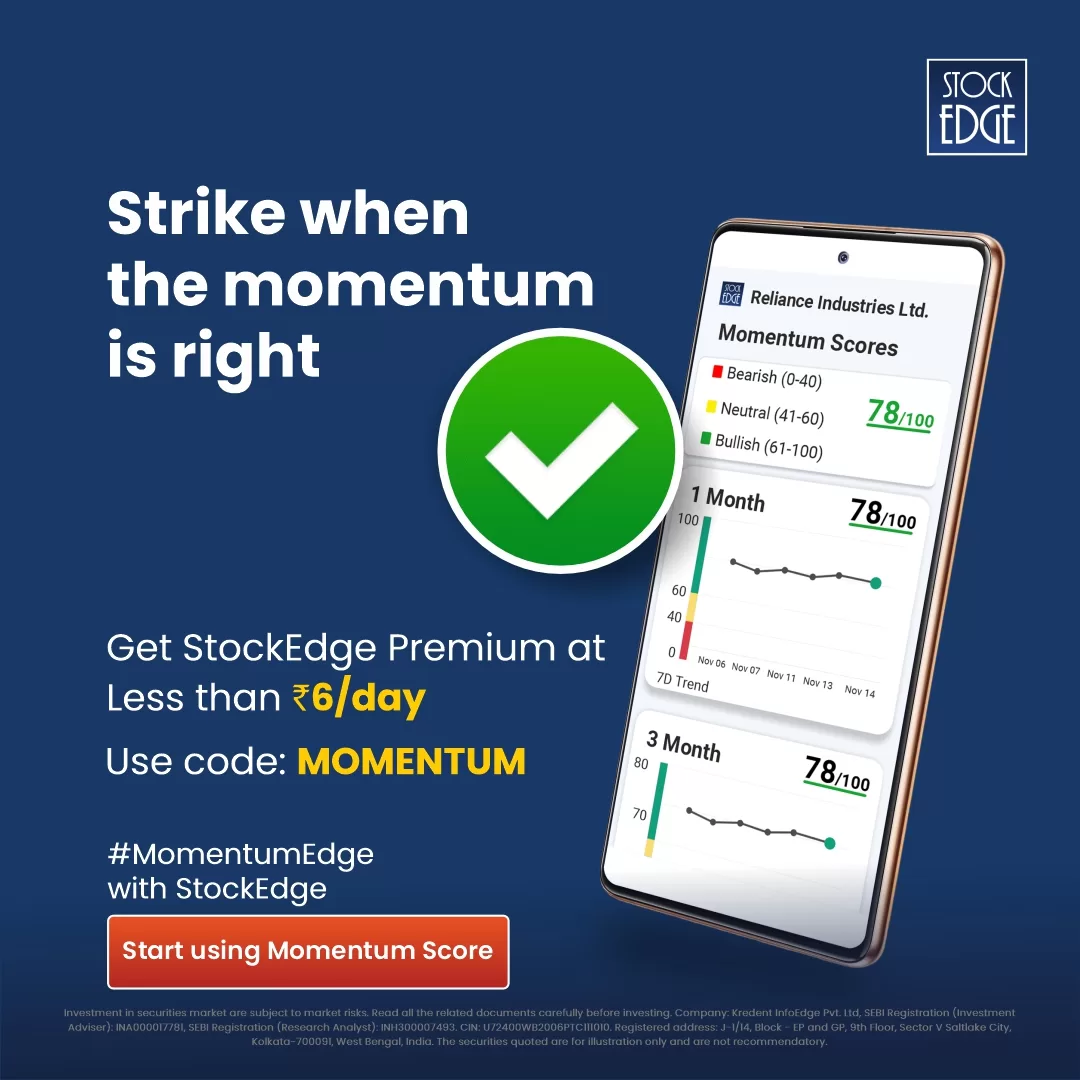
Momentum scores assist traders in evaluating the strength and direction of a stock’s price movement across various timeframes, such as one month, three months, and six months, depending on the trading approach.
A higher score (61-100) signifies strong bullish momentum, whereas a lower score (0-40) indicates bearish momentum. Neutral scores (41-60) point to a consolidation phase.
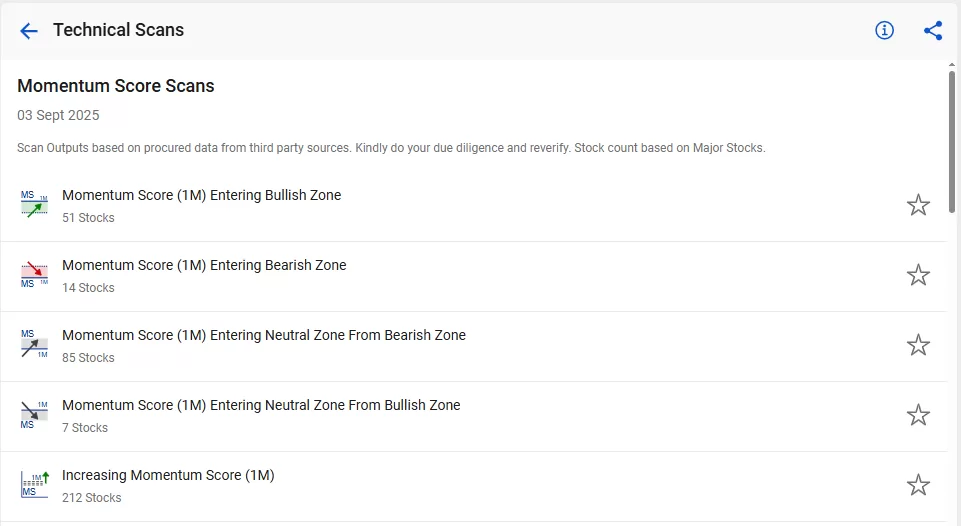
Let’s understand how to use this example. If you are a short-term trader, you may want to check the “Momentum Score (1M) Entering Bullish Zone” scan to identify high-momentum stocks.
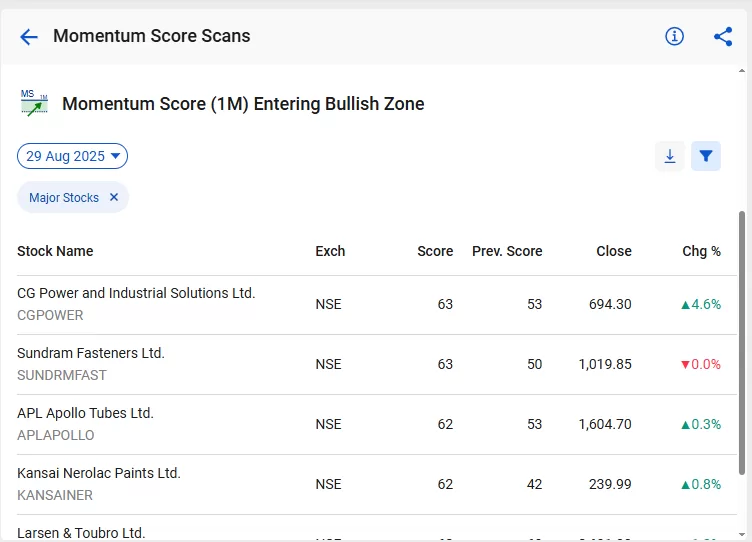
If you see, on 29th Aug 2025, CG Power and Industrial Solutions Ltd. has recently entered the bullish zone with its one-month momentum score rising to 63 from the previous level of 53. This reflects strengthening price action and growing investor interest.
Now, let’s look at the chart
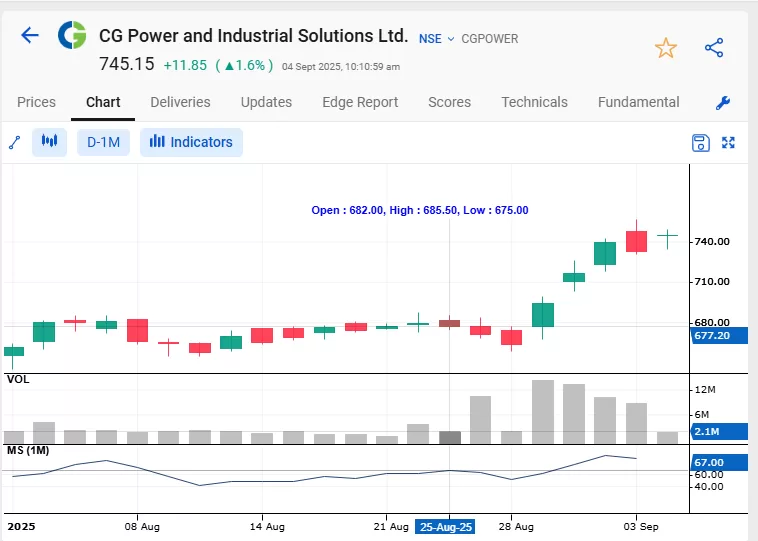
When we look at the chart, the trend is clearly moving in an upward direction, validating the momentum score signal. So, you can use this stock screener to identify the high momentum score.
To know more about the momentum score, read our blog StockEdge Momentum Score.
RSI Scan
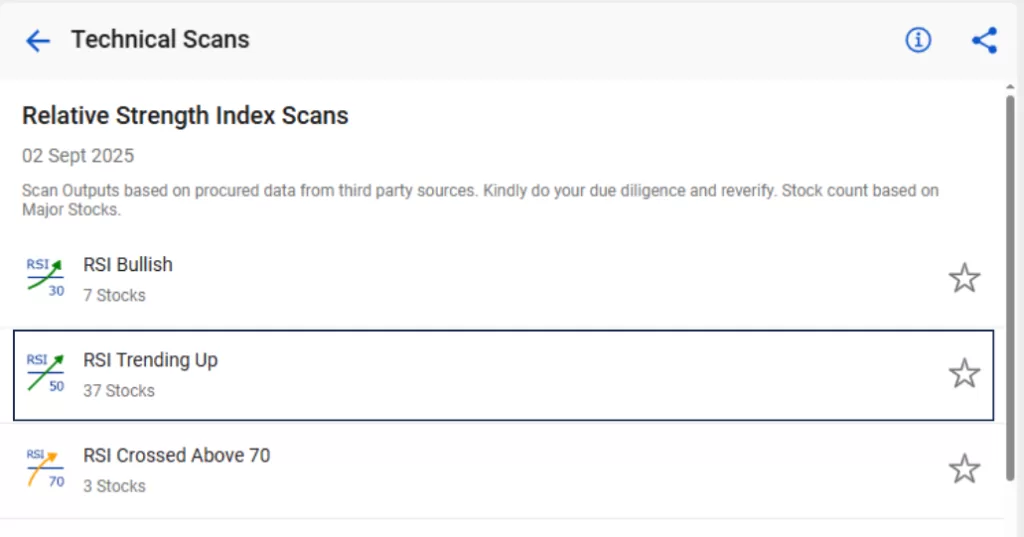
To give you an example of how you can use these scans for identifying stocks for trading, let’s explore the Relative Strength Index (RSI) Scan to find stocks!
Here is the list of scans that you will find under RSI Scanner; based on your trading style, you can find stocks that meet your criteria. For instance, generally, the RSI crossing above 50 is considered to be a signal for bullish momentum. Let’s take a look at those stocks that have just crossed RSI > 50 on daily charts.
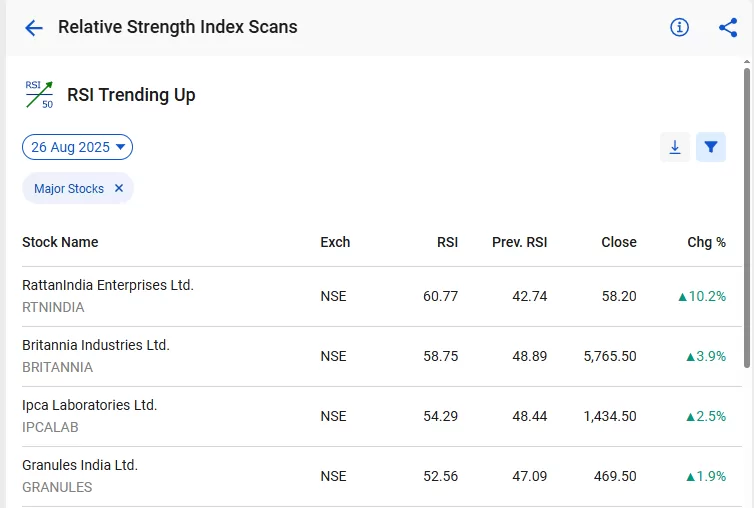
As you can see, the first stock in the list which appeared on 26th August was RattanIndia Enterprises Ltd. Now, let’s move to the daily price chart of the stock and how it performed since then.
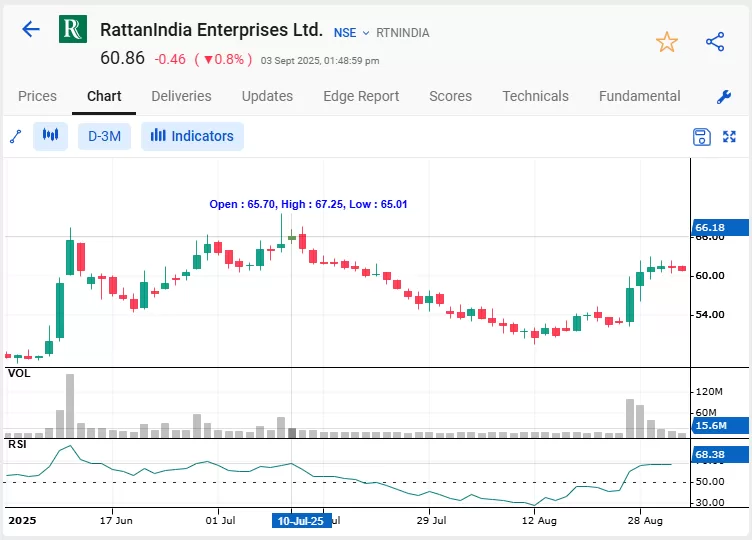
As you can see, after RSI crossed 50, the share price increased by almost 15% in 4 days.
Similarly, you can explore other RSI scans and other technical scans based on your parameters to identify stocks for your trading.
Fundamental Scans
The next set of scans is developed for investors in the stock market. If you are an investor in the market, this market screener is one of the best ways to identify strong fundamental stocks. As we all know, understanding the company’s fundamentals and analyzing its balance sheet, cash flow statements, and income statements is a time-consuming process, and it may happen that you can miss lucrative opportunities in the market.
Therefore, fundamental analysis, with the help of StockEdge, essentially helps you to save time and focus on companies that are worth your time and money.
Please note these scans are updated as when the quarterly or annual results are announced by the companies.
Under the fundamental scans, you will find multiple scans based on profitability, valuation, solvency, efficiency and even corporate activity scans and much more. (as shown in the image below)
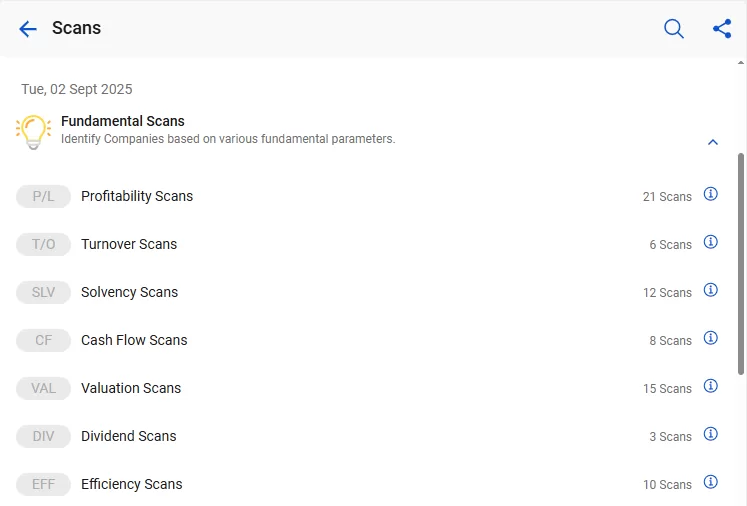
Also, under each type of fundamental scan, you will find a plethora of scans for your fundamental analysis.
So, without further ado, let’s jump into profitability scans and find out what different parameters you get to screen profitable companies to invest in.
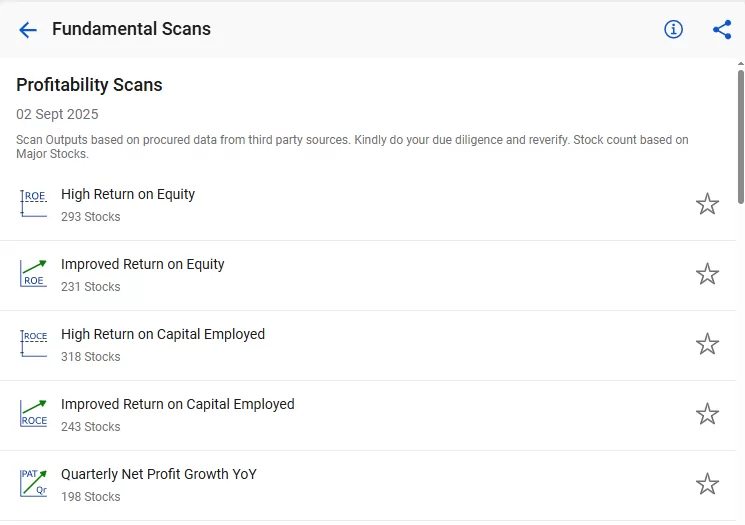
As you can see, there is a vast library of scans available based on the portability of a company. Suppose you want to find such companies whose EPS (earnings per share) has been increasing QoQ.
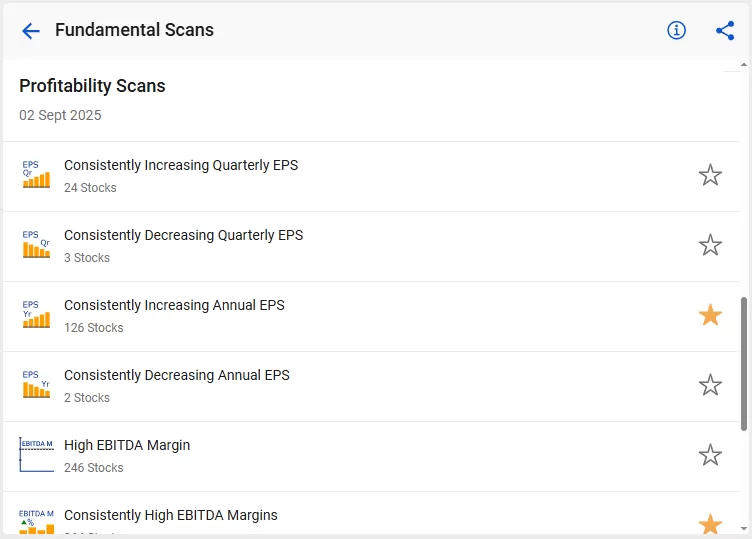
This particular scan, which consists of Consistently Increasing Quarterly EPS, gives us the list of companies that have positive EPS for the past five quarters, and it is also increasing every quarter as compared to the previous quarter.
Now, if you are wondering what exactly the EPS of a company is and what increasing EPS signifies? Here is a brief explanation:
Earnings Per Share (EPS) is a financial measure that signifies the division of a company’s earnings among each outstanding common stock share.
Consistently increasing EPS QoQ (Quarter-over-Quarter) is significant because it indicates improving profitability and financial health, attracting investors and potentially driving stock price growth.
Now let’s take a look at the price action move made by Acme Solar Holdings Ltd., which is the first company on our list.
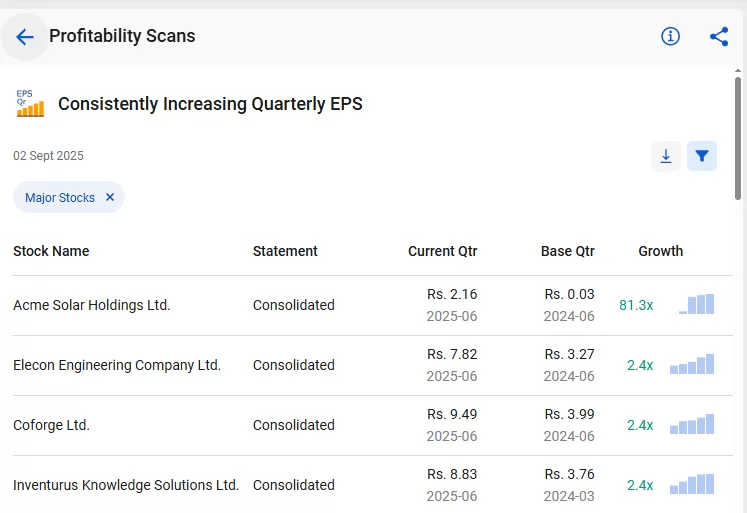
You may have your own set of fundamental parameters, which you can explore from our vast library of fundamental scans from StockEdge.
Futures & Options Scans
Futures and options are highly active in the Indian stock market, with the National Stock Exchange (NSE) standing as the world’s largest derivatives exchange. India’s derivatives market has experienced robust expansion in recent years.
Trading in stock futures and options offers several advantages. In simple terms, they allow investors to speculate on the future price of a stock without owning the stock itself. Futures provide a way to profit from both rising and falling markets, meaning that you even short-sell stock futures, which you cannot do with cash stock, giving you the flexibility to earn profits in different market scenarios.
Also, while dealing in futures and options, they are used to hedge against price fluctuations, amplify potential gains, and require a smaller upfront investment compared to buying stocks outright.
We have developed scans based on futures open interest data, which is very crucial to analyze if you are trading in futures and options. (as shown in the image below)
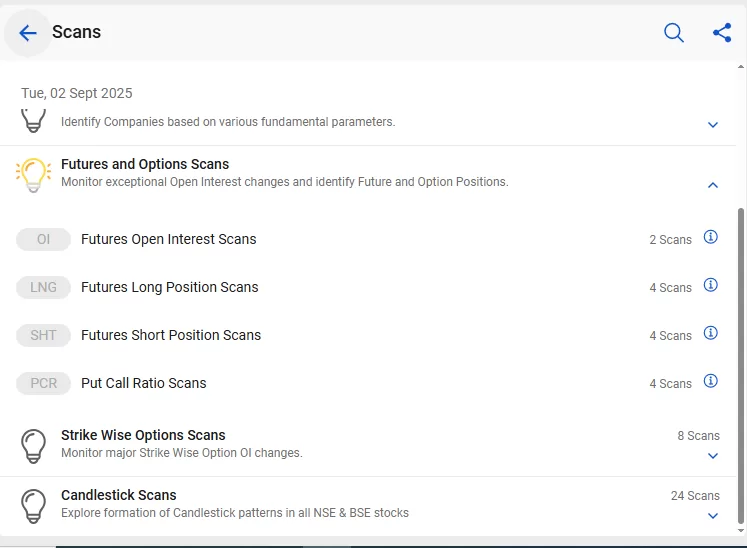
Open interest in stock futures represents the total number of outstanding, unclosed contracts in the market.
An increase in open interest indicates that new positions are being created, suggesting growing interest and participation in that specific futures contract. It can be a sign of bullishness if accompanied by rising prices. Conversely, a decrease in open interest suggests that positions are being closed, potentially signaling a lack of enthusiasm in the market or traders exiting their positions.
If you closely monitor these changes in open interest, it can provide valuable insights into the strength and direction of the trend in a stock.
Let’s try to scan the list of stocks with New Longs in futures contracts, meaning the stock price has increased along with a rise in cumulative open interest, which is generally considered a bullish signal.
You will find new long scans in stock futures under the sub-category “Future Long Position Scans.”
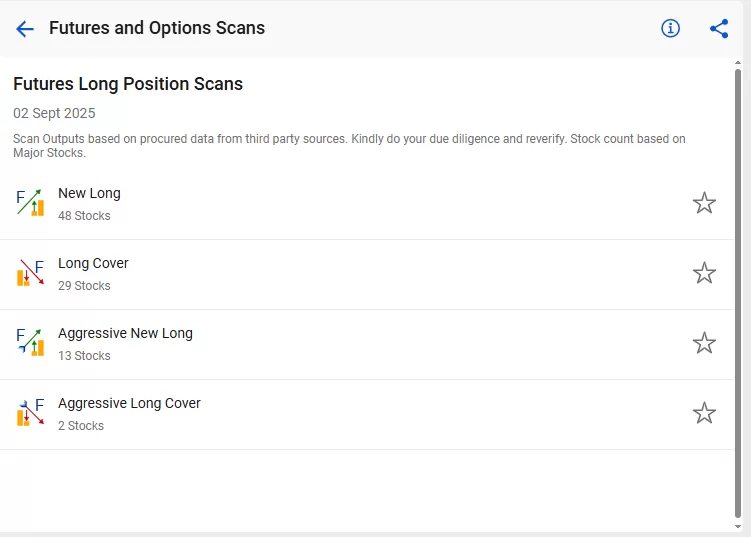
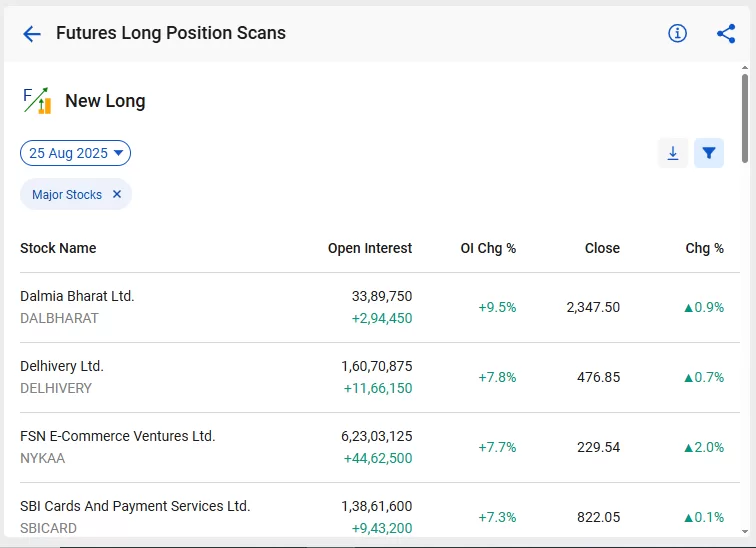
Going forward with the example of Dalmia Bharat that appeared on New Long Scan on 25th August. By clicking on any stock, you can also see the historical trend in open interest, OI analysis (whether New long, New shorts have taken place in earlier dates) and Option chain data as well. (as you see in the screenshots below)
Now, let’s jump into the daily price chart to find out how the stock price has reacted after it appeared on the New Long scan on 25th August.
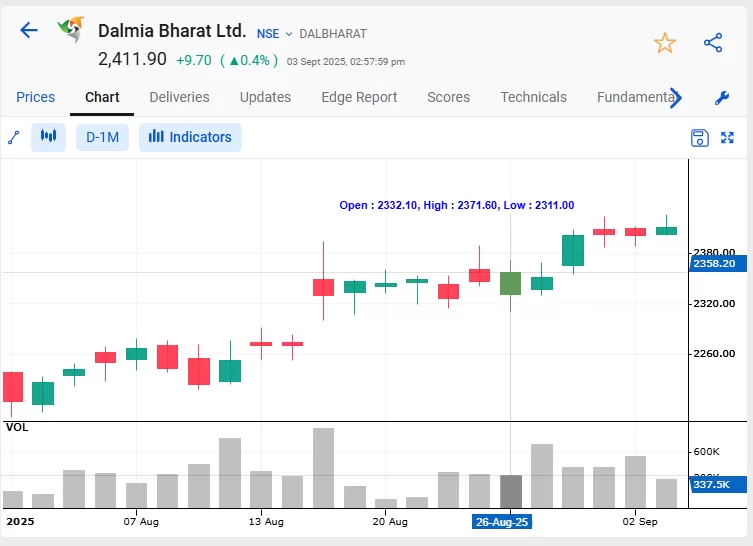
As you can see in the above price chart, the stock price jumped almost 2.3%. Therefore, it is very important that while you are dealing in the futures and options, you must set a defined risk-reward ratio so that you hold on to the trade, even if the stock doesn’t react immediately the next day.
You can not only identify stocks for taking a long position but also identify bearish stocks with the help of numerous other scans under Future Short Position Scans.
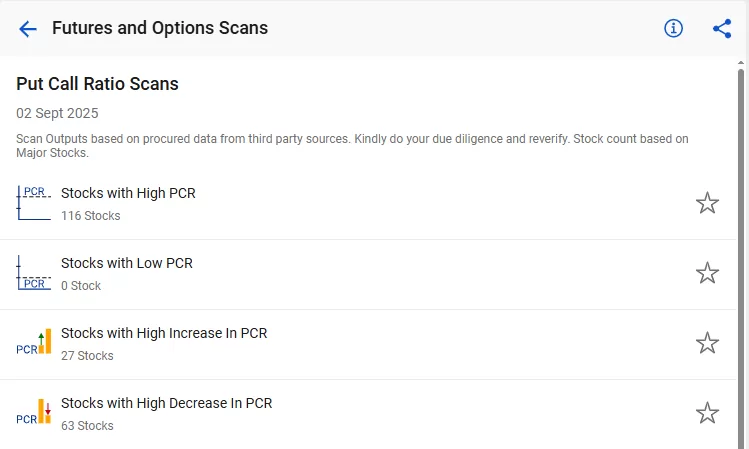
Additionally, identifying High or Low PCR (Put-Call Ratio) stocks has become easy as we have developed several PCR scans (as shown in the screenshot below)
Strike Wise Option Scans
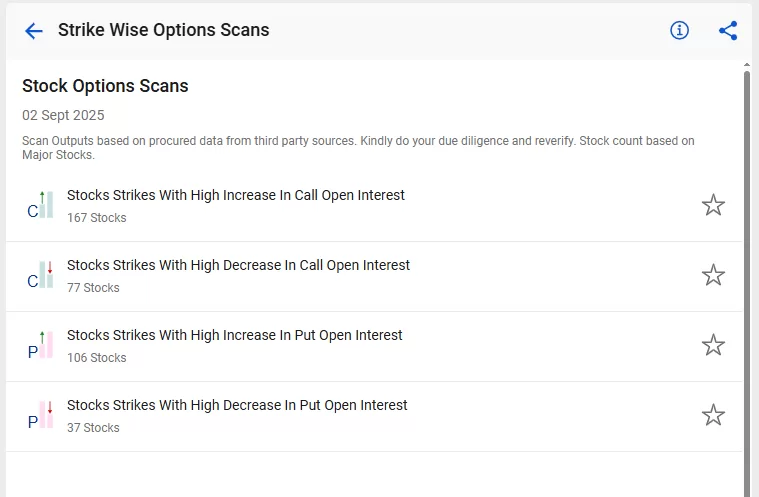
We have another set of F&O scans, which are strike-wise option scans. When you are dealing with only options, choosing the right strike is crucial. Be it Index Options or Stock Options. In StockEdge, you will be able to identify the correct strike to trade. In this set of scans, you will be able to identify strikes with a high increase or decrease in open interest for both Calls and Puts. This will help you to identify resistance and support levels as well as the trend for any index or stocks.
How? Let’s find out!
In general, the market anticipates an increase in open interest as (an addition of open interest by the option writers/option sellers). So, when you scan the increase in Call OI for stocks or indices, that strike is considered as a resistance level, and vice versa for Puts is considered as a support level.
On the other hand, when you scan for the decrease in open interest, it indicates that option writers are unwinding their positions; hence, you can expect a price movement based on call or put. For instance, if there is a decrease in call OI, it is considered a bullish signal, whereas a decrease in Put OI is considered a bearish signal.
Based on the same logic, let’s identify a bullish signal in stocks using the scan “Stock Strikes with a decrease in Call Open interest.”
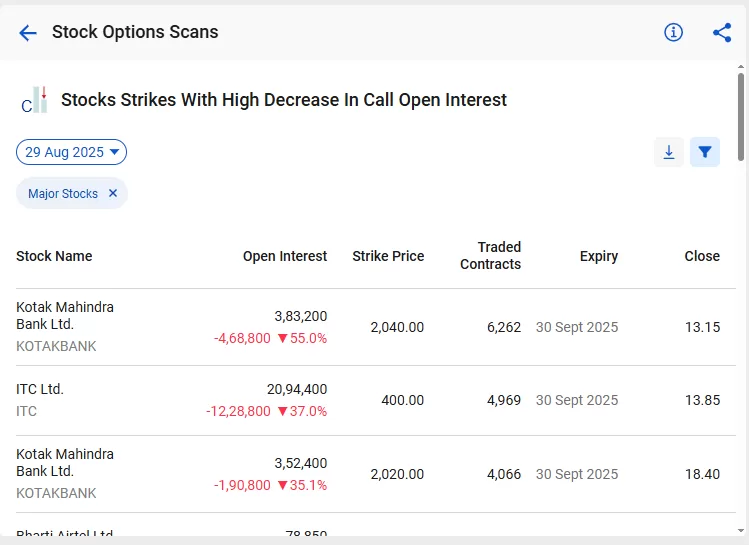
As you can see, the strike of ATM and near OTM strikes of Kotak Mahindra Bank Ltd have witnessed high unwinding of Call OI, which indicates a bullish signal in the stock. Let’s go straight into the price chart of MCX to see how the price reacted after that day.
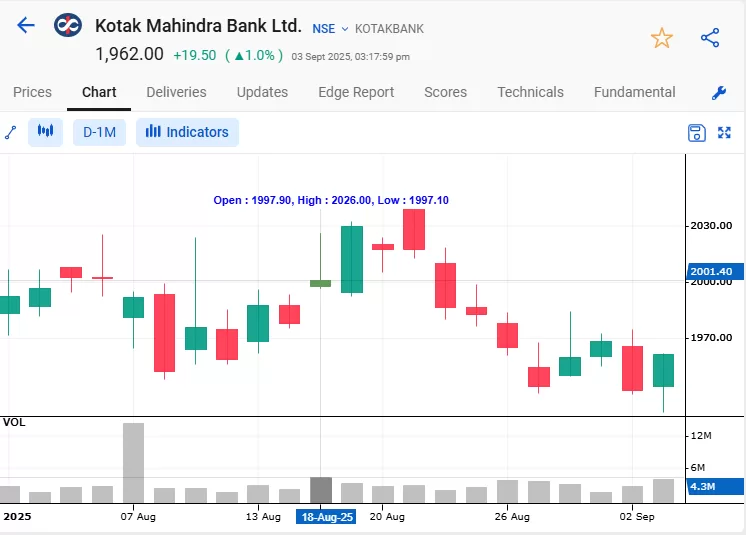
However, it is always advisable to consider analyzing the stock’s primary trend, volume, and other technical indicators before initiating any trade. These scans are helpful in identifying trading opportunities, but you must do your own research and due diligence before taking a trade in futures and options.
Lastly, we have Candlestick scans in StockEdge; let’s explore that:
Candlestick Scans
Candlesticks are basically graphical representations of the price movements of stocks. A candle consists of (open, high, low and close) prices of a stock for a specific time period (minutes to days, weeks, or months). A single or a combination of two or more candles forms patterns that can provide valuable insights into the trend of the stock and potential price reversals, which helps you make informed decisions about buying or selling stocks at the correct price and at the right time.
There are more than 35+ candlestick patterns, and we have managed to develop popular candlestick scans that can help you screen stocks that have made any type of candlestick patterns on daily charts. We have a bunch of categories of candlestick patterns (as shown below)
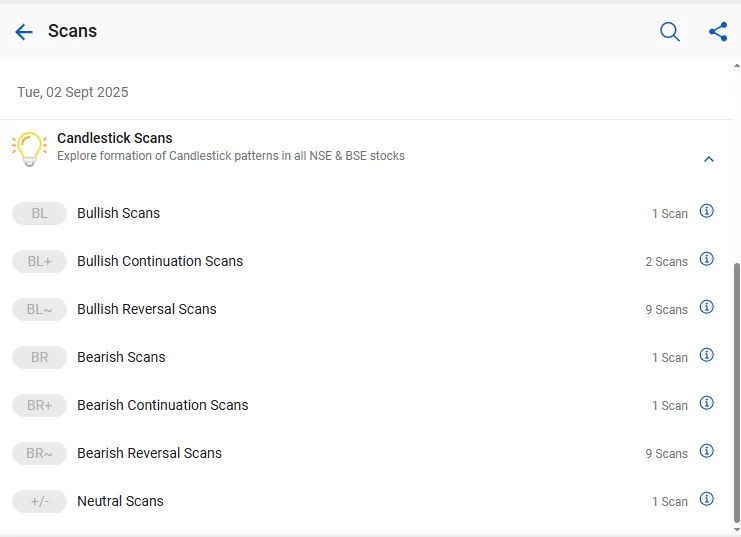
We will be exploring candlestick reversal scans as they signal potential shifts in the sentiment, indicating a change in the current trend. This may help you identify ideal entry and exit points, thus reducing your risks and maximizing profits.
Let’s take the example of Dark Cloud Cover, which is essentially a bearish reversal candlestick pattern.
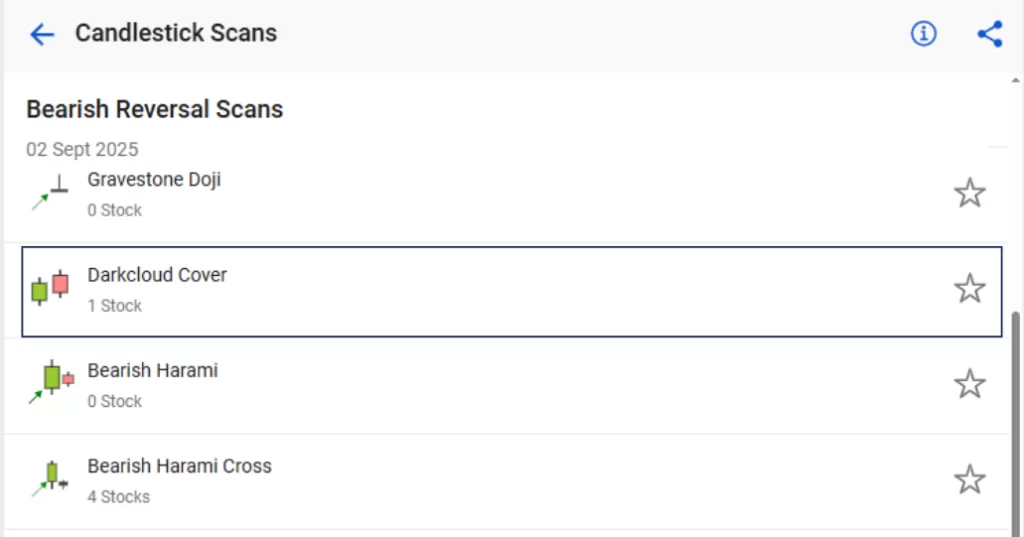
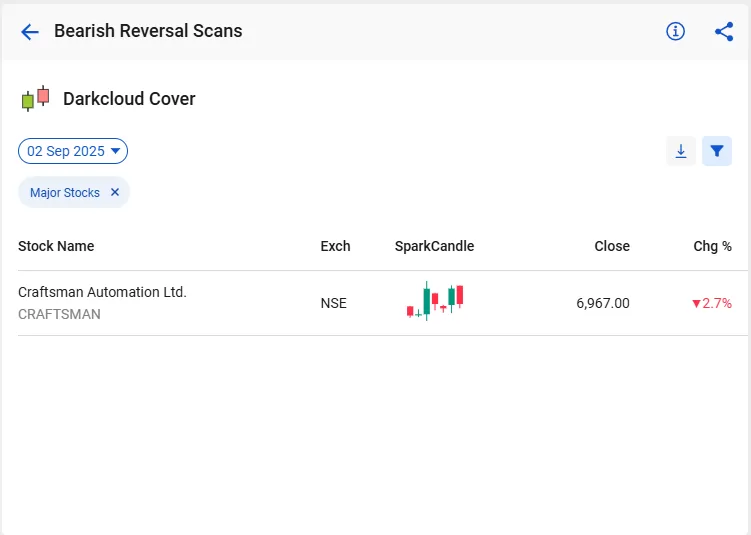
As you can see, Dark Cloud Cover has formed on the stock of MapMyIndia and appeared on the list on the 2nd of Sept. This candlestick pattern is usually seen at the end of an upward trend as it indicates a potential reversal of the trend.
Now, let us jump into the price chart to find out whether the trend of the stock has changed or not.
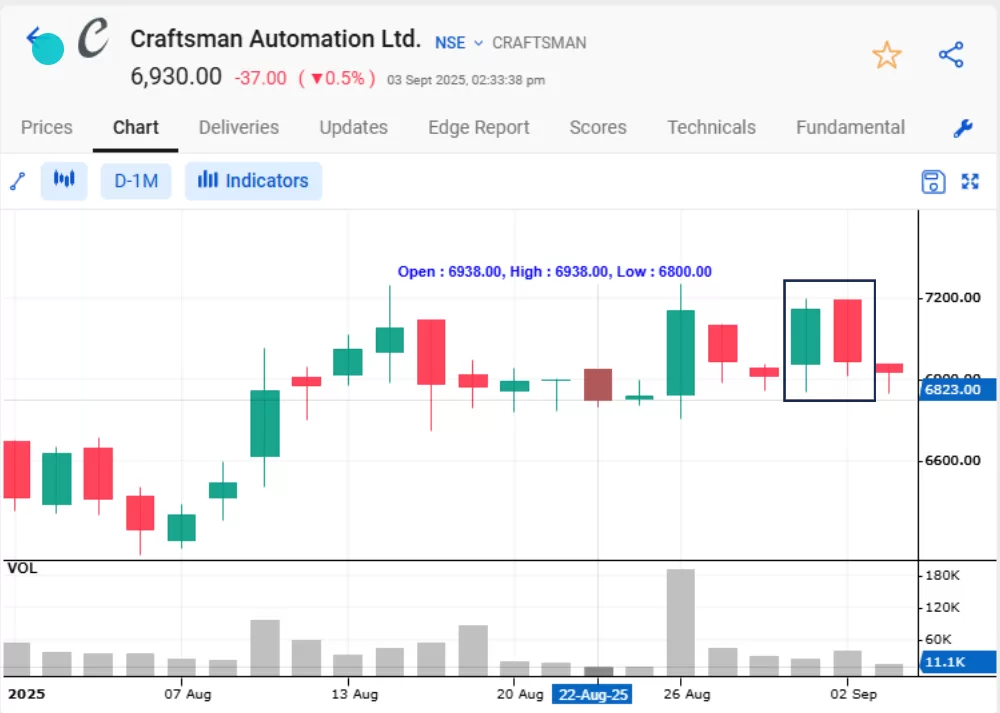
In the above daily price chart of Craftsman Automation Ltd., you can see that the stock’s trend was upward, but after the formation of the Dark Cloud Cover candlestick pattern, the stock price dropped by nearly 2%.
You can explore other scans on candlesticks, which will essentially help you to make an informed decision while trading in stocks. However, screening stocks based on a single parameter may not be ideal for some.
Therefore, we have created a section called “Combination Scans” where you can add your multiple scans from different categories and subcategories as per your specified criteria.
Combination Scans
A combination Scan or Combo Scan gives you an edge to identify stocks not only by a single parameter but also by a number of different criteria for selecting stocks. So, how do you create your own combination scans? Follow these steps:
- Go to My StockEdge
- Click on “My Combo Scan”, which you will find under “My Data.”
- To add a combination scan, click on the + button in the top right corner
- Give a name to your combo scan and click Add.
- Click on Add Scans and start adding your favorite scans.
For example, here is a techno-funda scan named FIPA (Financial Improvement with Price action), created by Mr. Vivek Bajaj
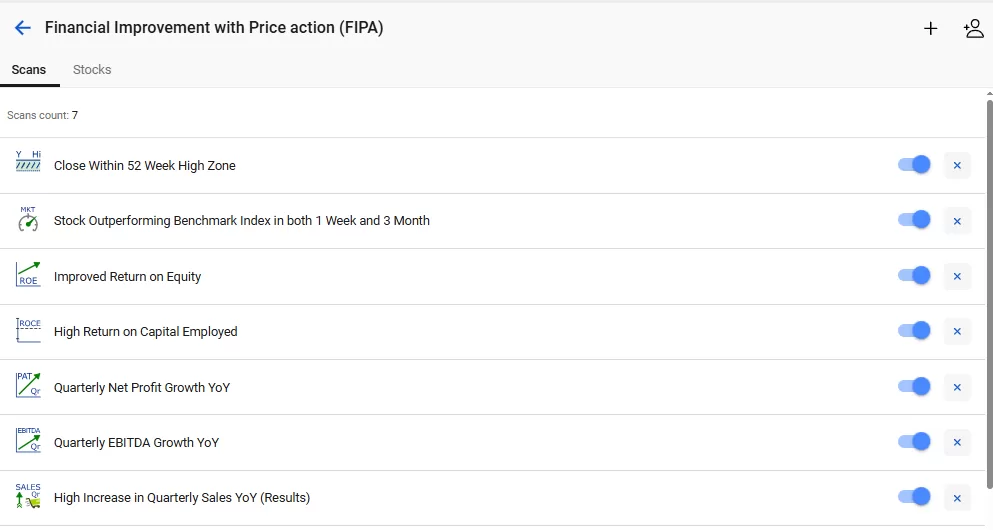
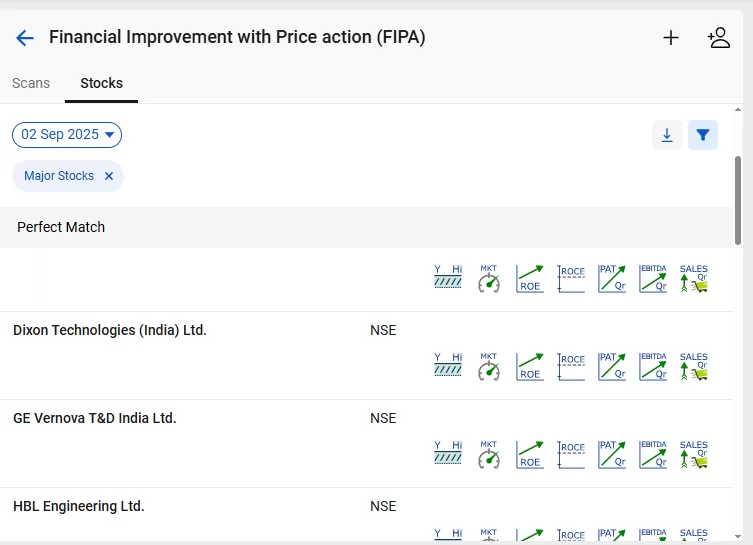
Start using StockEdge scans and create your own combination scans to screen stocks for trading or investing.
The Bottom Line
In conclusion, using StockEdge scans is a powerful way to optimize your stock selection process for both trading and investing. These scans provide a systematic and data-driven approach to filter and screen stocks based on specific criteria. By leveraging the extensive capabilities of StockEdge, you can uncover potential opportunities, reduce risks, and enhance decision-making skills in the stock market. Whether you’re looking for short-term trades or long-term investments, the ability to customize scans and focus on relevant data can greatly improve your stock selection strategy.
Remember that successful stock selection is a crucial component of success in the stock market, and StockEdge scans can be a valuable ally in this pursuit.


