Table of Contents
What is a Breakout?
A price movement through an identified level of support or resistance, which is usually followed by heavy volume and increased volatility, is a ‘breakout’. Traders will buy the stocks when the price breaks above a level of resistance and sell when it breaks below support.
2 Year Breakout Scans
Close Crossing 2 Year High
Stocks whose closing price have crossed the last 2 year high of itself are displayed in this scan. This signifies that it is a bullish indicator as it indicates the stock is moving upward and has crossed its 2 year’s high.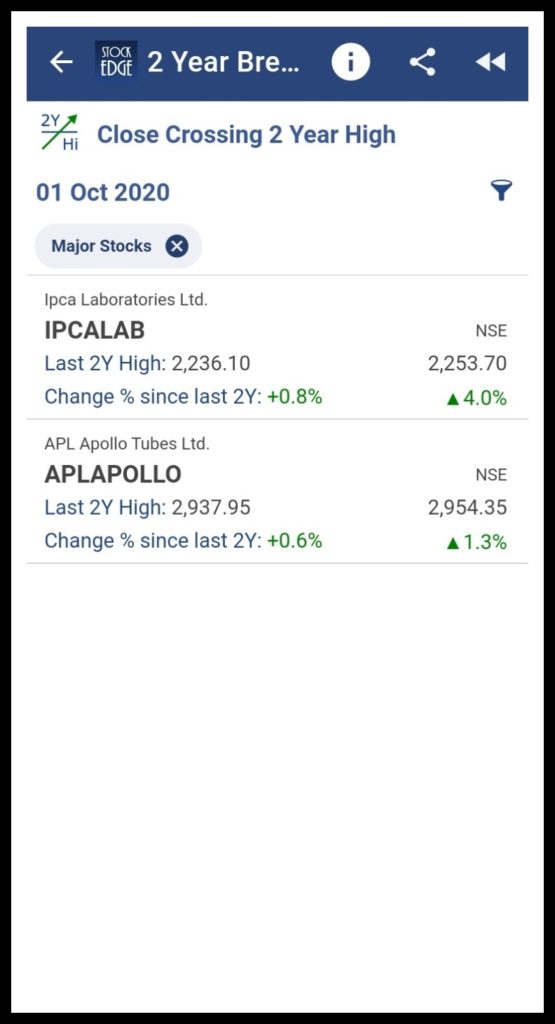
Close Crossing 2 Year Low
Stocks whose closing price have crossed the last 2 year low of itself are displayed in this scan. This signifies that it is a bearish indicator as it indicates the stock is moving downward and has crossed its 2 year’s low. Since no major stocks is fulfilling the criterion for the scan, its been displayed as “No Stocks Found”.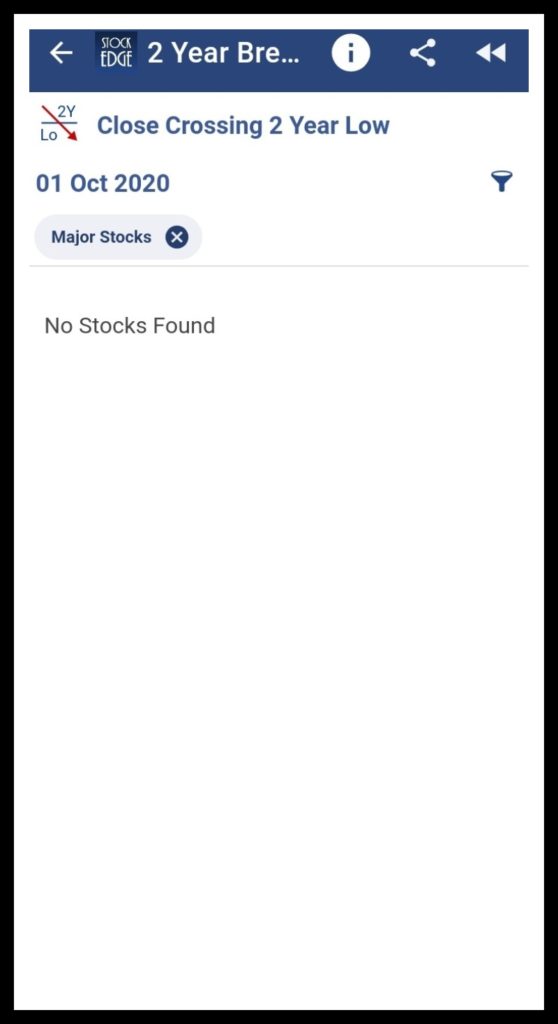
Close Within 2 Year High Zone
Stocks whose closing price is in the range 2 year high to 15% level below are displayed in this scan. This scan helps in identifying stocks which have strength and can show momentum.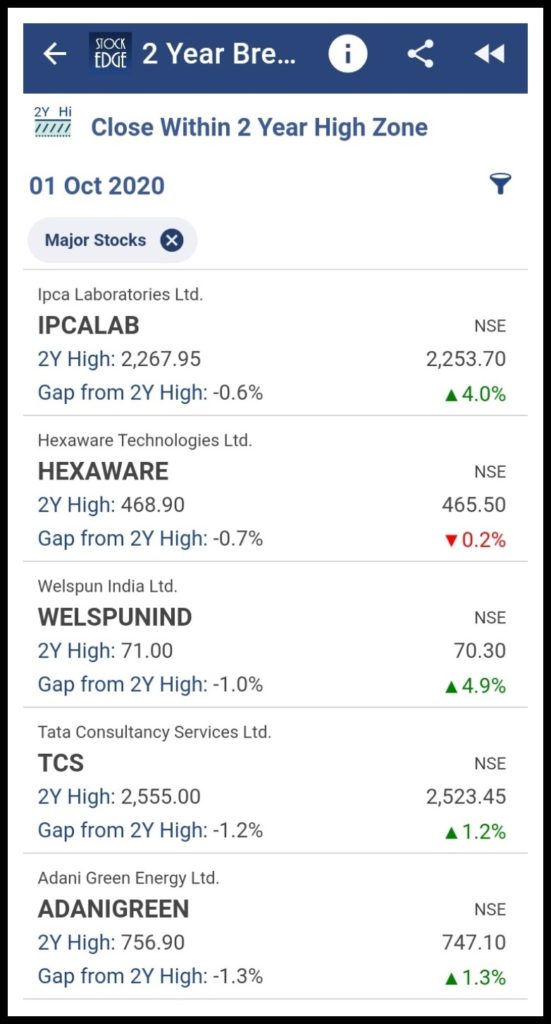
Close Entering 2 Year High Zone
Stocks whose closing price is in the range 2 year high to 15% level below are displayed in this scan. This scan also displays the gap from 2 Year High in percentage terms. This scan is a bullish indicator and shows stocks which have newly entered in this zone.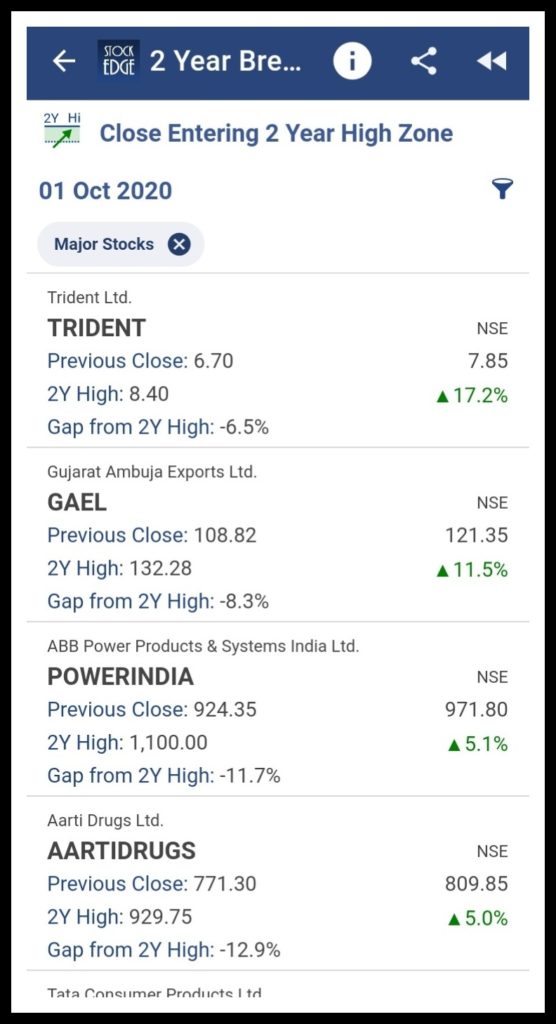
Close Within 2 Year Low Zone
Stocks whose closing price is in the range 2 year low to 15% level above are displayed in this scan. This scan also displays the gap from 2 Year Low in percentage terms.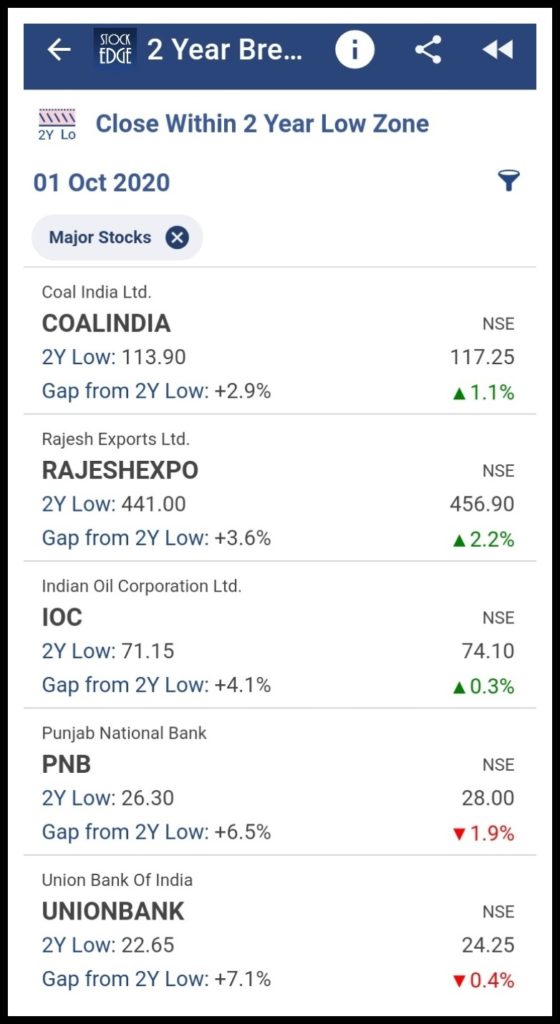
Close Entering 2 Year Low Zone
Stocks whose closing price is in the range 2 year low to 15% level above are displayed in this scan. This scan also displays the gap from 2 Year low in percentage terms. This scan is a bearish indicator and shows stocks which have newly entered in this zone.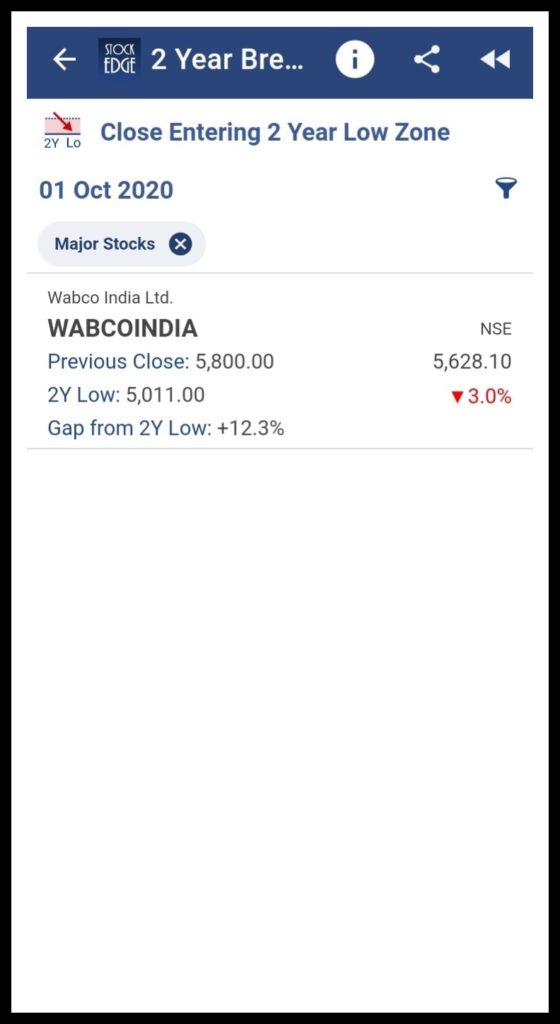
5 Year Breakout Scans
Close Crossing 5 Year High
Stocks whose closing price have crossed the last 5 year high of itself are displayed in this scan. This signifies that it is a bullish indicator as it indicates the stock is moving upward and has crossed its 5 year’s high.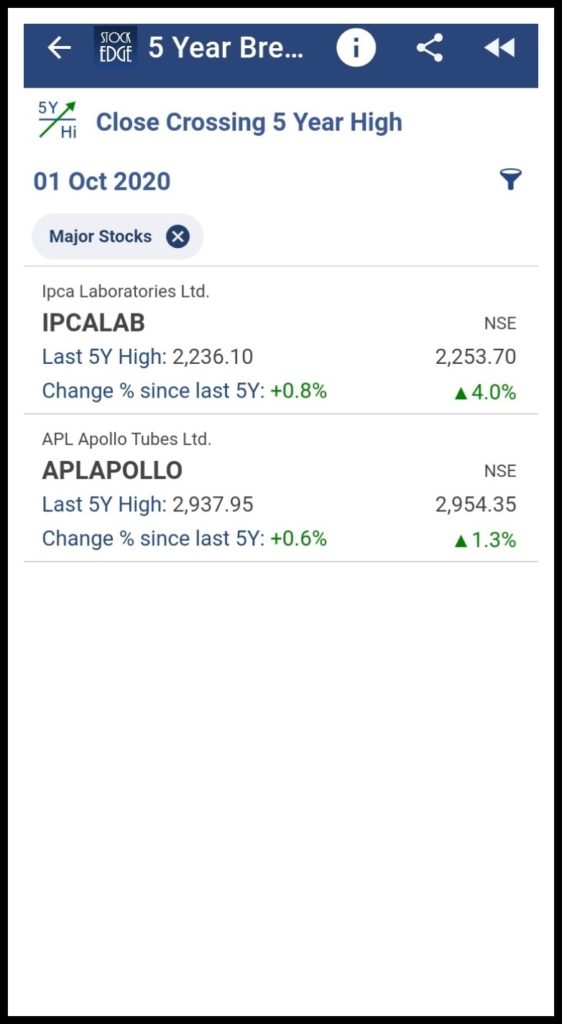
Close Crossing 5 Year Low
Stocks whose closing price have crossed the last 5 year low of itself are displayed in this scan. This signifies that it is a bearish indicator as it indicates the stock is moving downward and has crossed its 5 year’s low. Since no major stocks is fulfilling the criterion for the scan, its been displayed as “No Stocks Found”.
See also: Narrow Range Scans (NR)
Close Within 5 Year High Zone
Stocks whose closing price is in the range 5 year high to 15% level below are displayed in this scan. This scan also displays the gap from 5 Year High in percentage terms.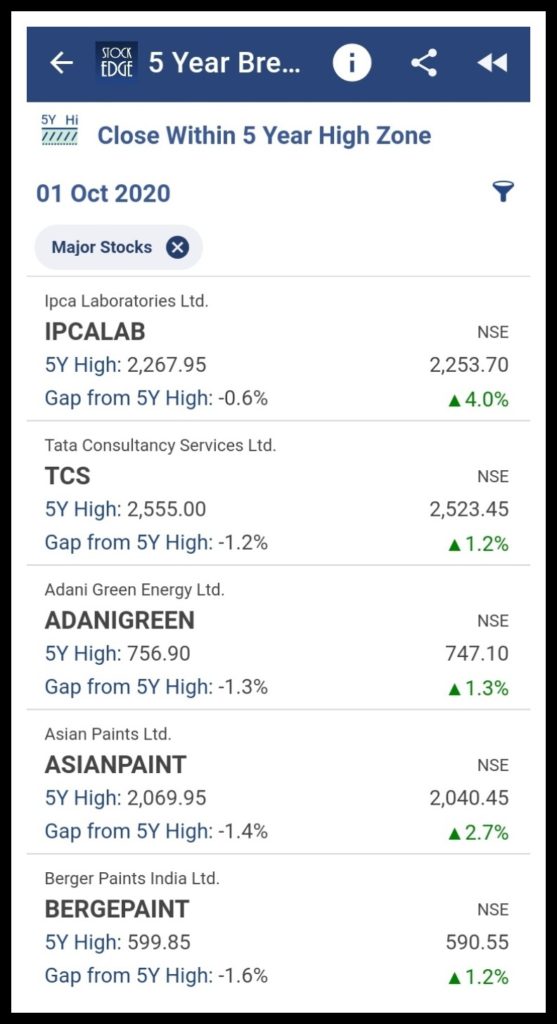
Close Entering 5 Year High Zone
Stocks whose closing price is in the range 5 year high to 15% level below are displayed in this scan. This scan also displays the gap from 5 Year High in percentage terms. This scan is a bullish indicator and shows stocks which have newly entered in this zone.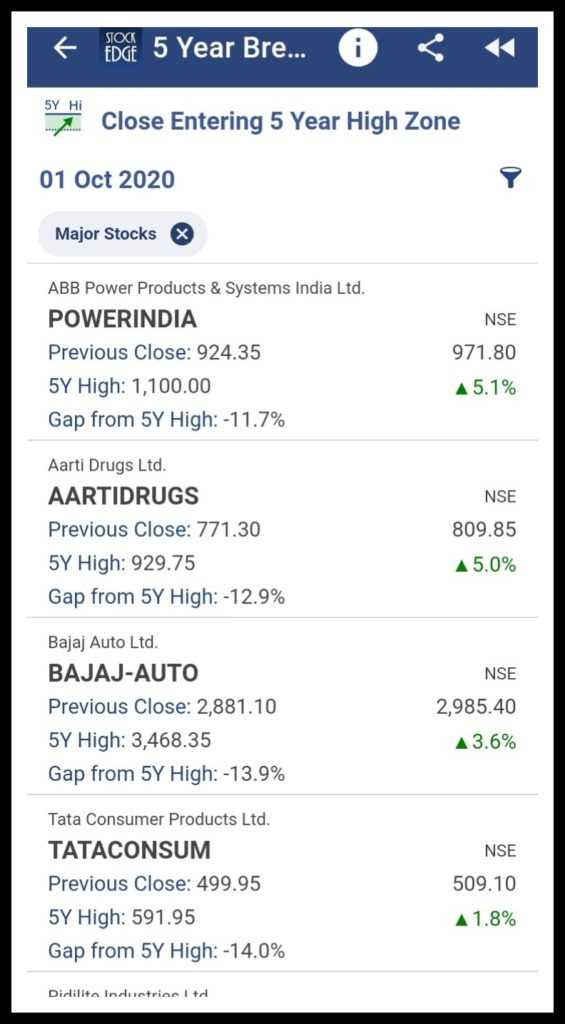
Close Within 5 Year Low Zone
Stocks whose closing price is in the range 5 year low to 15% level above are displayed in this scan. This scan also displays the gap from 5 Year Low in percentage terms.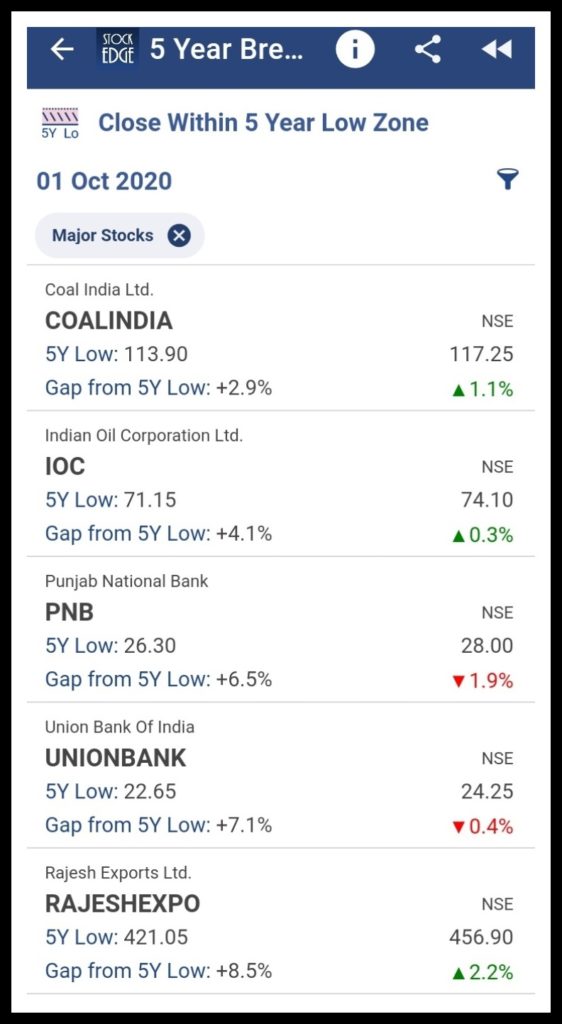
Close Entering 5 Year Low Zone
Stocks whose closing price is in the range 5 year low to 15% level above are displayed in this scan. This scan also displays the gap from 5 Year low in percentage terms.
This scan is a bearish indicator and shows stocks which have newly entered in this zone. Since no major stocks is fulfilling the criterion for the scan, its been displayed as “No Stocks Found”.
Above are examples of the 2Y and 5Y breakout scans which can be used for buy and sell signals and also give us a list of the stock which fulfills the criteria of the scans for that particular day.
You can filter out the stocks and can trade accordingly using these scans.
2 Year and 5 Year breakout scans are one of the few premium tools offered by StockEdge App which you can download from the Play Store.
To check out our Premium plans from StockEdge.com.


