Table of Contents
Established in 1983, Apollo Hospitals is the first corporate health care in India. An interesting fact about Apollo Hospitals stock is that it was the first hospital stock that was included in the Nifty 50 benchmark index in March 2022.
Apollo Hospital Enterprise Ltd (AHEL) is one of the leading integrated healthcare service providers in Asia. Besides its hospitals, it has diversified into other businesses such as pharmaceutical, primary care & diagnostic clinics.
In this blog, a detailed analysis of Apollo Hospital stock may unlock investment opportunities in India’s growing healthcare sector. So, should you add Apollo Hospitals stock to your portfolio? Let’s find out.
Company Overview
Apollo Hospitals Enterprise Ltd. is India’s top healthcare service provider, with a total bed capacity of 9,789 beds spanning across the country. Apart from its hospitals, the company has diversified businesses in the healthcare sector. Besides its hospital-based pharmacies, AHEL runs pharmacy operations under ‘Apollo Pharmacy’ through a retail pharmacy chain of 5,671 outlets. Additionally, diagnostics centers run under the brand of ‘Apollo Clinic’, which spans across India.
Recently, it has completed the slump sale of a few businesses into Apollo HealthCo (AHL), wherein, post the external capital raise, AHEL would continue to be the majority shareholder for ₹1,210 cr as slump sale consideration. The slump sale includes its retail pharmacy chain Apollo Pharmacy, its digital healthcare platform Apollo 24/7, and other private label healthcare brands.
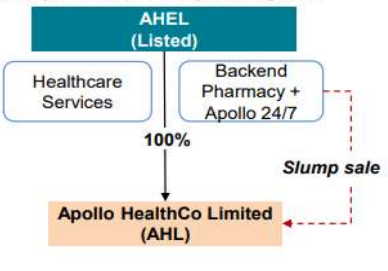
The formation of Apollo Health Co. Ltd (AHL) is a step towards creating India’s largest omni-channel healthcare platform. Currently, as of FY 23, the revenue mix of Apollo Hospitals Enterprise Ltd, as well the healthcare services offered are shown below:
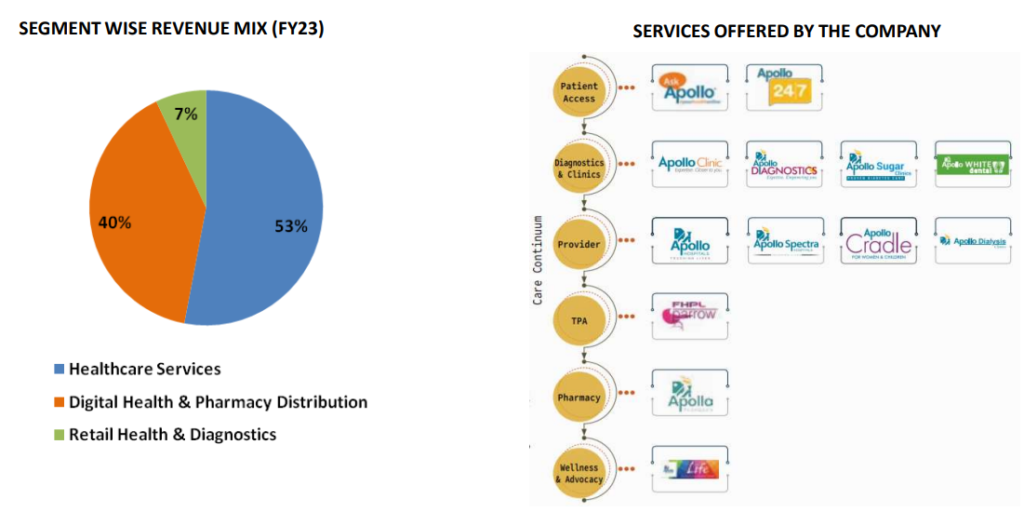
As you see, the company has a diverse range of offerings in the healthcare industry. Additionally, with the growing healthcare sector in India, Apollo Hospitals stocks seem to be a convincing investing opportunity. Hence, without further delay, let’s analyze Apollo Hospitals’ stock.
Sectoral Overview: Hospitals and Healthcare Industry
The healthcare industry in India is experiencing significant growth, thanks to improvements in coverage, services, and increased spending by both the public and private sectors. Private hospitals in India hold an 80% share of the healthcare market. The government has implemented initiatives like Ayushman Bharat and the National Digital Health Mission to expand healthcare coverage and accessibility.
Changing demographics, higher per capita income, increased awareness of healthy lifestyles, an underdeveloped healthcare sector in India, a greater prevalence of non-communicable diseases, advancements in healthcare technology, and cost competitiveness are some factors contributing to the growth of the healthcare industry in India.
Financial Highlights of Apollo Hospitals Stock
Analyzing financial statements such as income statements, balance sheets, and cash flow statements helps investors assess the company’s ability to generate returns, manage debt, and sustain growth, enabling informed and prudent investment choices.
Income Statement
The income statement, commonly known as the profit and loss statement, gives you an understanding of its financial performance, such as its sales growth, profitability, etc.
At StockEdge, we have organized the income statement in a way that will help you analyze it with ease rather than going through the conventional way of downloading the documents from the stock exchanges, which could be time-consuming and tiresome to many.
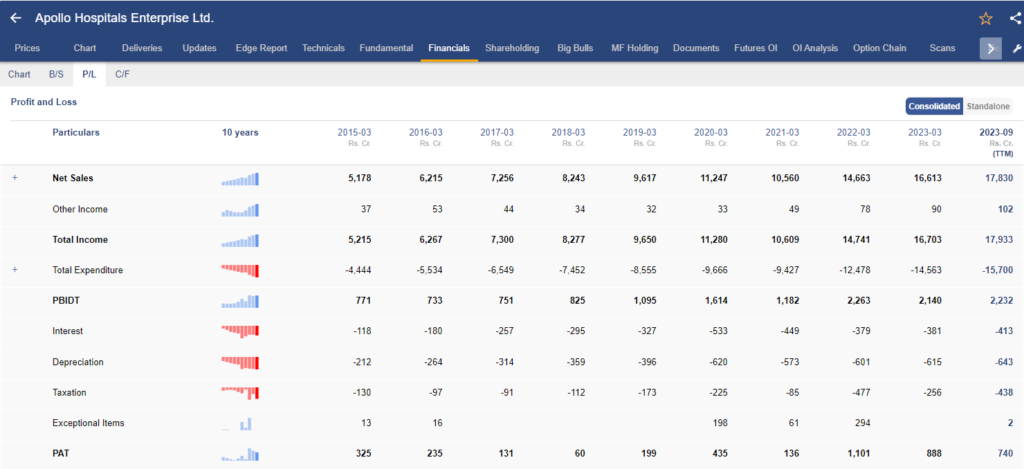
In the above image, you can see the annual income statement of Apollo Hospital Enterprise Ltd. Every detail is in front of your eyes, starting from the top-line sales figures to the bottom-line Net profit of the company.
Sales Growth
In order to determine the growth of revenue in hospitals, the Average Revenue per Operating Bed (ARPOB) is a key metric. For Apollo Hospitals, ARPOB for the period of FY 23 was ₹51,668, up by 14 % YoY, with an increase in patient volumes by 18 % YoY. The overall net sales grew by 13% YoY in FY23, whereas in H1 FY24, net sales were ₹ 9,265 cr, up by 15 % YoY.
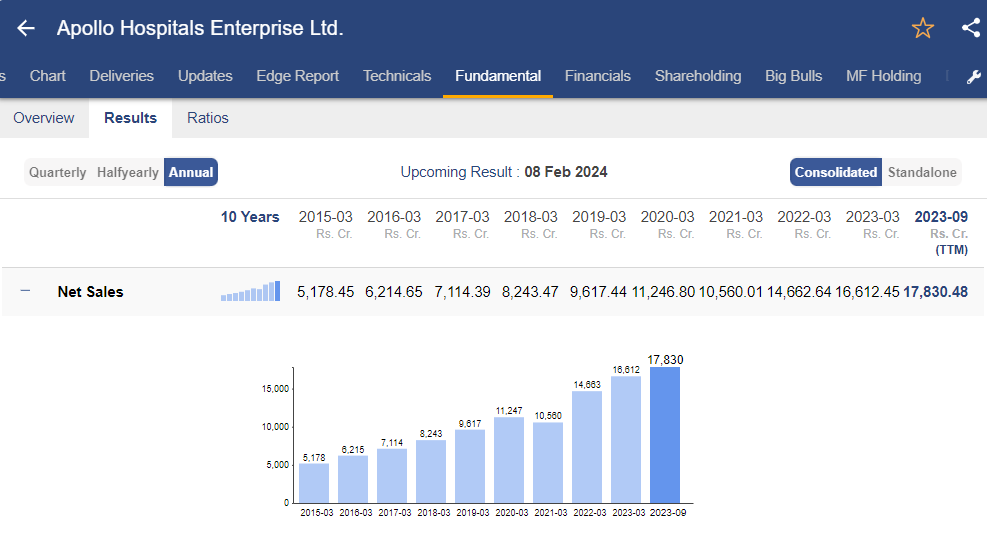
As you can see, with StockEdge, analyzing the annual net sales growth of Apollo Hospital stock or any other stock is easy, as it gives a graphical representation of the overall trend.
EBITDA Growth
The company remains focused on expanding and investing aggressively in its digital platform, thereby restricting operational performance in the near term. Therefore, in FY23, EBITDA was ₹2,050 cr, a decline of 6% YoY. But in H1 FY24, EBITDA was ₹1,137 cr, a growth of 8% YoY. For Q3 FY24, EBITDA jumped 21% YoY.
PAT Growth
The company’s PAT growth declined 19% YoY in FY23 and 26% YoY in the first half of FY24. However, fortunately, the company reported a PAT increase of 56.7% in Q3 FY24. The growth in profitability is expected to be driven by the addition of laboratories and collection centres in the diagnostic industry, the expansion of primary and secondary patient care, elective procedures, and a concentration on private-label sales.
Balance Sheet of Apollo Hospitals Ltd.
The balance sheet follows the accounting equation: Assets = Liabilities + Equity. It provides a company’s financial position, stability, and overall health.
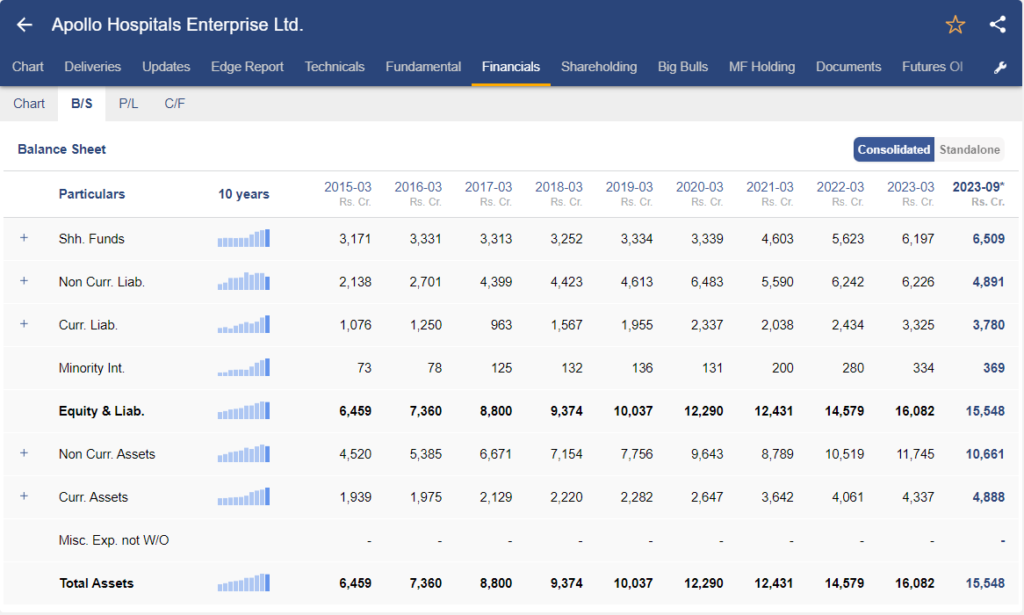
In the above image, you can see the balance sheet of Apollo Hospitals Enterprise Ltd. It provides an overview of the company’s financial position as of date. What are the assets and liabilities of the company? A company’s liabilities can be both short-term and long-term.
As of 30th September 2023, total debt stood at ₹3,010 cr. Out of which, long-term debt stood at ₹2,016 cr.
Cash Flow Statement of Apollo Hospitals Enterprise Ltd.
A cash flow statement provides a summary of how a company generates and uses cash over a specific period of time. It has three different sections:
- Operating cash flow statement
- Financing cash flow statement
- Investing cash flow statement
Out of these the most important one being the cash flow from operations as it provides you with an understanding of how the company generated cash from its core business operations. A positive cash flow from operation signifies that the company has generated higher cash revenue than its expenditure.
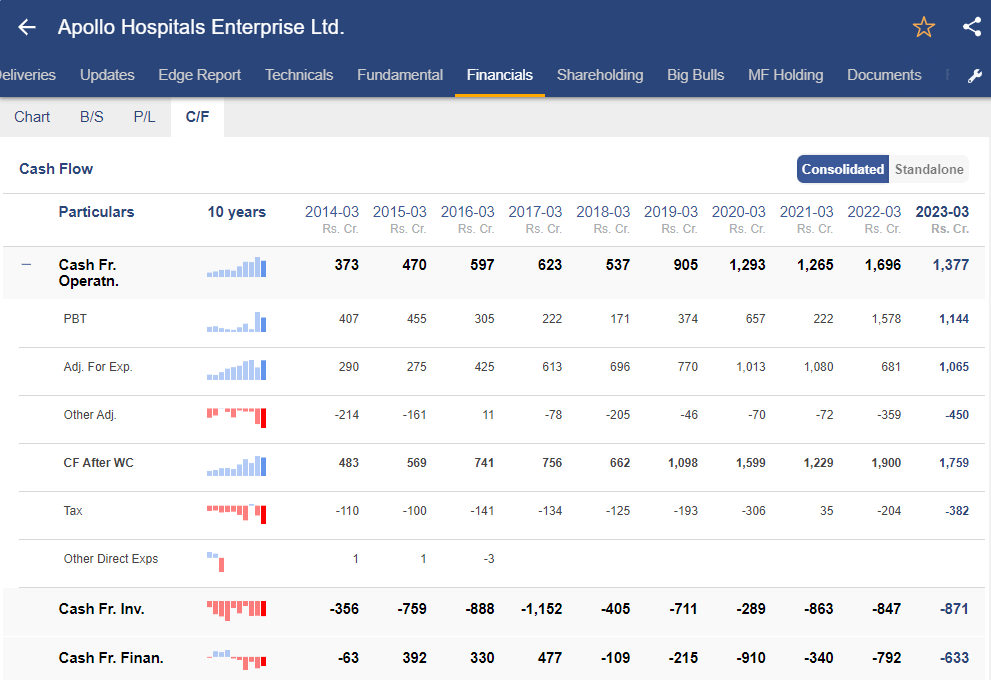
In FY23, the financial statements indicate the following cash flows:
Cash Flow from Operations (CFO): ₹1,377 crore inflow. The decline compared to the previous year was due to lower profitability and adjustments in working capital.
Cash Flow from Investing Activities (CFI): ₹871 crore outflow. This is primarily attributed to the acquisition of Property, Plant, and Equipment (PP&E), including intangible assets.
Cash Flow from Financing Activities (CFF): ₹633 crore outflow. This is mainly due to the repayment of borrowings and lease liabilities, along with finance costs. Additionally, significant dividend payments were made during this period.
Overall, the company experienced a moderation in cash inflow from operations, coupled with significant outflows in both investing and financing activities during FY23.
Ratio Analysis of Apollo Hospitals Stock
Ratio analysis of a company involves evaluating a company’s financial performance by examining certain ratios which are derived from its financial statements. It makes easy comparing the financial performance to its industry benchmarks or competitors.
Ratio has different classifications like profitability ratios, solvency ratios, return ratios and more as you can see in the image below, you can analyze all such ratios directly from StockEdge.
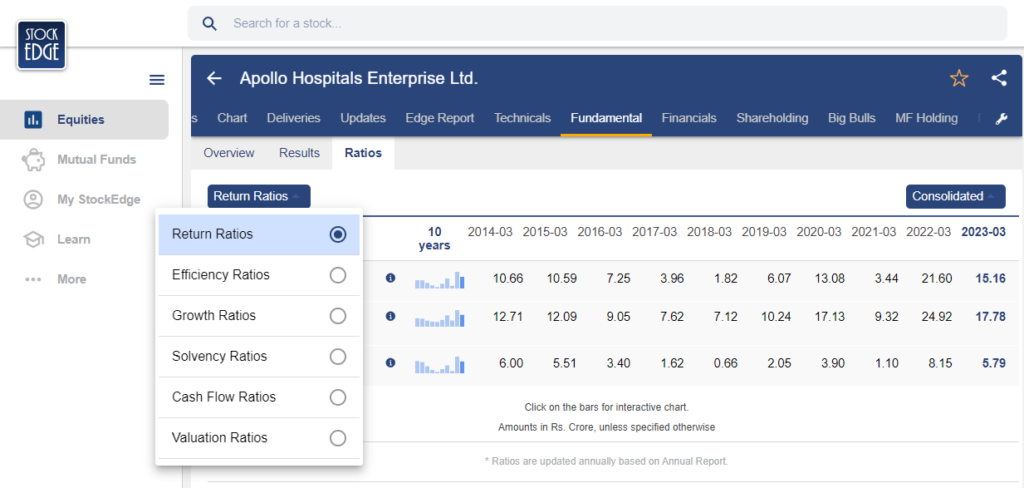
Here are the return ratios of the Apollo Hospitals stock, starting with the two most important ratios which are ROE and ROCE.
What is ROE and ROCE?
ROE is a profitability ratio that measures the company’s ability to generate net income as a percentage of shareholders’ equity, whereas ROCE assesses the efficiency of a company in utilizing its total capital, including both equity and debt.
Return on Equity (ROE)
In FY23, ROE was 15.16%. This moderation can be attributed to a higher base from the previous year, which was supported by an exceptional gain of ₹294 cr.
Return on Capital Employed (ROCE)
ROCE was 17.78% in FY23. The statistic was impacted by the moderation in operating profitability.
Debt to Equity Ratio (D/E Ratio)
In FY 2023, the company’s debt-to-equity ratio was approximately 0.44x. This ratio indicates that the company had a moderate level of financial leverage. A debt-to-equity ratio of less than 1 is generally considered favourable as it suggests a lower financial risk and indicates a more conservative capital structure.
Price to Equity Ratio
As of the latest data, Apollo Hospitals stock is trading at a Trailing Twelve Months (TTM) Price-to-Earnings (PE) multiple of 121.80. In comparison to its industry average of 71.22, the elevated PE multiple can be attributed to its strong brand presence across India and also its vast business verticals.
Management Quality & Shareholding Pattern
The mission of Apollo Hospitals is to make India self-reliant in healthcare by providing superior care of international standards accessible to the common man. To achieve this mission, the company has made strategic investments in artificial intelligence, automation, robotics, and 3-D printing in healthcare. These technologies are expected to enhance patient management systems and treatment methodologies, ultimately improving healthcare outcomes.
To further strengthen its strategic initiatives, Apollo Hospitals appointed Dr. Madhu Sasidhar as the Chief Strategy Officer, effective from October 1st, 2023. Dr. Sasidhar joins the company as one of the Senior Management Personnel, bringing with him expertise and experience to drive the company’s strategic vision forward. His appointment signifies the company’s commitment to innovation and strategic planning in achieving its healthcare objectives.
The promoter shareholding has remained at 29.33% for the last few quarters. Promoter pledged shareholding remained at 16.09% in Q2 & Q3 FY24, which indicates a red flag. However, both FIIs and DIIs have marginally increased their stake in Apollo Hospitals stock.
Future Outlook of Apollo Hospitals Stock
Apollo Hospitals continues to strengthen its specialities, including cardiac sciences, oncology, neurosciences, nephrology, gastroenterology, and orthopaedics, which contribute to approximately 60% of its revenue. As a prominent player in the healthcare sector, Apollo Hospitals is also a significant part of the Nifty 50, offering investors valuable exposure to a company with a strong growth trajectory.
In FY24, the company aims to achieve an Average Revenue Per Occupied Bed (ARPOB) of approximately ₹60,000, supported by steady margin growth driven by increased occupancy rates and an improving case mix. In Q3 FY 24, the ARPOB on an overall basis increased by 10% YoY to ₹56,368.
It seeks to double revenue from Apollo 24/7 on the digital front and target 28%-29% growth in its pharmacy business, aiming to break even by Q4 FY24.
Non-COVID diagnostics business is projected to grow to ₹500 crore in FY24 and ₹1,000 crore within the next three years, with targeted EBITDA margins of 10%-12% in the coming quarters.
Apollo Hospitals also expanded its footprint through strategic acquisitions, including a 325-bed hospital in Kolkata and a binding agreement for a 250-bed Royal Mudhol Hospital in Pune, which is expandable to 425 beds.
The company aims to increase the share of international patients to 15% by FY24, up from the current 6%-7% contribution to hospital revenue.
Case Study on Apollo Hospitals Stock
We have a case study report prepared by our team of analysts. This fundamental report on Apollo Hospitals stock provides you with a detailed analysis of the company as well as how it stands among its competitors.
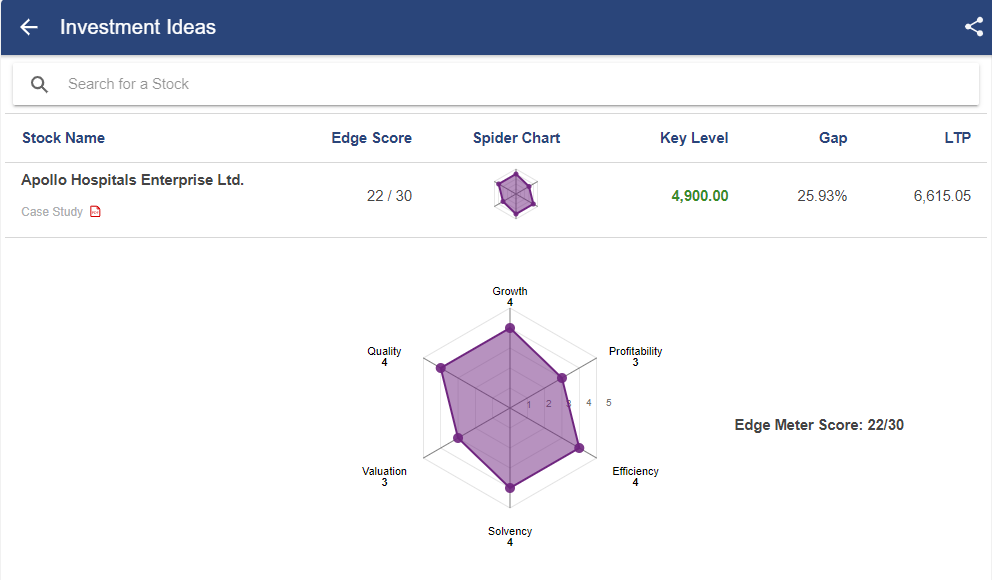
As you can see, Apollo Hospitals stock has rating based on 6 parameters:
- Growth
- Quality
- Profitability
- Efficiency
- Solvency
- Valuation
Based on the above parameters, Apollo Hospitals scored 22/30. Read the case study report on Apollo Hospitals stock. To find out other healthcare stocks you can invest, read: Health is Wealth! Know the Top 3 Healthcare Stocks in India
Conclusion
In conclusion, Apollo Hospitals presents a compelling investment opportunity due to its strategic focus on expanding specialties, leveraging emerging technologies, and pursuing growth across various business segments.
The proactive approach towards expanding its footprint through acquisitions and partnerships further strengthens its growth prospects. Additionally, Apollo’s commitment to innovation and digital transformation, coupled with its goal of increasing the share of international patients, underscores its ability to adapt to evolving market dynamics and capture new revenue streams. Overall, Apollo Hospitals demonstrates resilience, innovation, and a clear vision for sustainable growth, making it an attractive investment choice for long-term investors seeking exposure to the healthcare sector.


