
Table of Contents
A bank can report rising deposits and fast loan growth while risks build beneath the surface, and the YES Bank case shows how. Rapid corporate-led lending, rising gross NPAs, falling CASA and weakening capital adequacy came before the 2020 moratorium and the ₹8,415 crore Additional Tier 1 bond write-down. This is despite a 65% year-on-year rise in Q2 FY27 net profit and an improved 1.2% gross NPA. A five-step StockEdge walkthrough takes you from financial highlights and ratios to GNPA, NNPA and CRAR trends, CASA, net interest margin and cost-to-income, peer comparison, and quarterly result tracking. Reading these together, rather than relying on profit or any single ratio, keeps the focus on asset quality, deposit strength and capital rather than headline numbers.
A bank rarely goes from looking healthy to being in trouble overnight. The warning signs often appear much earlier, hidden in numbers that most investors may not think to check. A bank can report rising deposits, expand its loan book and still be carrying risks beneath the surface.
That is what makes YES Bank Q2 results worth looking at beyond the headline profit or loss. For investors, the more important question is not simply whether a bank is making money, but whether its lending is sound, its bad loans are under control and its capital is strong enough to absorb unexpected losses.
In Q2 FY27, the bank reported a 65% year-on-year rise in net profit to ₹1,080 crore, while its gross NPA ratio improved to 1.2%. However, the concerns surrounding YES Bank date back to 2020, when the bank wrote down ₹8,415 crore worth of Additional Tier 1 (AT1) bonds as part of its financial reconstruction. The issue resurfaced in October 2026, when the Supreme Court ruled on the legality of the write-down. It is a useful reminder that even improving earnings and asset-quality numbers do not tell the entire story.
In this blog, we will look beyond the headline figures to understand what the numbers reveal about a bank’s financial health, which warning signs investors should watch, and how you can use StockEdge to carry out the same checks on any bank before making an investment decision.
The Setup: A Bank Growing Faster Than Its Risks
There was a time when YES Bank looked like one of India’s most promising private-sector banking stories. Under its co-founder and then CEO Rana Kapoor, the bank pursued an aggressive expansion strategy, building a strong presence in corporate banking and lending to businesses across sectors. Its rapid growth helped it establish itself as a major private-sector lender.
On the surface, the story looked encouraging. The loan book was expanding quickly, reported bad-loan ratios remained relatively low, and the bank continued to attract deposits. For investors looking at headline numbers, there appeared to be little reason to question the growth story.
But there was a bigger question beneath that growth. Was the bank expanding its lending business faster than it could manage the risks?
That question became harder to ignore when the RBI identified a significant gap between the bank’s reported bad loans and its own assessment. In March 2017, YES Bank had reported gross NPAs of ₹2,018.6 crore. The RBI’s assessment put the figure at ₹8,373.8 crore.
The gap did not, by itself, explain everything that followed. But it exposed why rapid loan growth and apparently comfortable asset-quality ratios should never be viewed in isolation.
What the Numbers Showed
The first warning sign was not necessarily a fall in profits or a sudden spike in bad loans. It was the pace at which the bank was growing.
To understand what went wrong, we need to look at four parts of its balance sheet: how quickly it was lending, what the quality of those loans really looked like, how it was funding that growth, and how much capital it had to absorb potential losses.
Credit Growth: When the Loan Book Expands Too Quickly
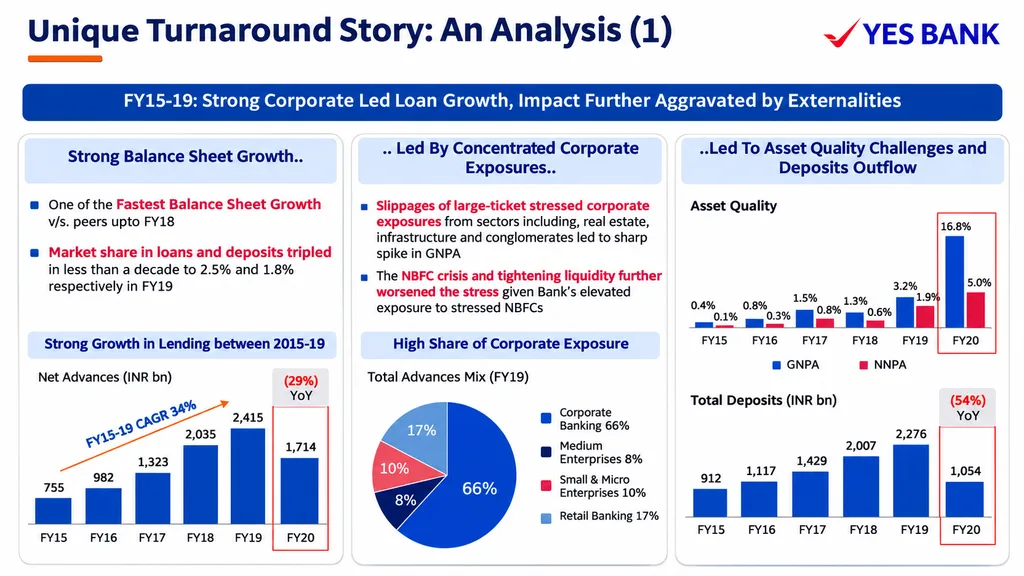
YES Bank was growing its lending business at a remarkable pace. Its advances grew by 46.5% year-on-year to ₹1,71,514.9 crore in December 2017, while deposits grew by 29.7% during the same period. The bank’s own investor presentation also highlighted a 39% CAGR in advances between FY15 and FY18, compared with an industry CAGR of just 8%.
That difference is important. The bank was gaining market share much faster than the broader industry, but rapid lending also meant that it was taking on new borrowers and expanding its exposure at an accelerated rate.
Asset Quality: The Difference Between Reported and Actual Stress
This is where the YES Bank story took a serious turn. The bank’s reported bad-loan figures looked relatively comfortable, but the RBI’s assessment revealed that the actual stress in its loan book was much higher.
For the financial year ended March 2017, the difference was striking:
| Asset quality indicator | Bank-reported | RBI-assessed |
| Gross NPA | ₹2,018.6 crore | ₹8,373.8 crore |
| Net NPA | ₹1,072.3 crore | ₹5,891.6 crore |
| NPA provisions | ₹946.3 crore | ₹2,482.1 crore |
The RBI-assessed Gross NPA was more than four times the figure reported by the bank. The gap was not just about accounting presentation. It meant that a much larger portion of the loan book was under stress than investors could understand from the reported numbers alone.
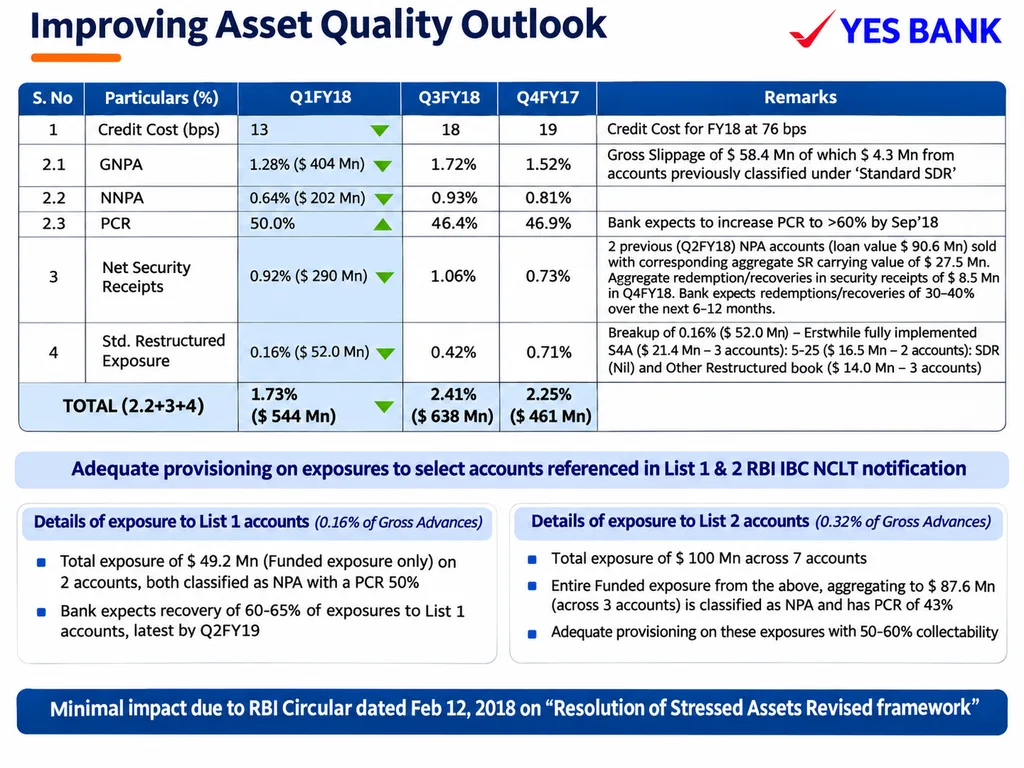
There was another important consequence. The bank’s reported FY17 net profit was ₹3,330.1 crore, but after adjusting for the additional provisioning identified by the RBI, the notional profit came down to ₹2,316.1 crore.
CASA Ratio and Deposit Base: Was the Growth Well-Funded?
A bank does not run only on the loans it gives out. It also needs a reliable source of funds to keep lending, and that is where deposits become important. For the bank, the deposit numbers initially looked reassuring.
Between FY17 and FY18, its total deposits increased from ₹1,42,874 crore to ₹2,00,738 crore, a growth of around 40.5%. Its CASA ratio also remained broadly stable, moving from 36.3% to 36.5%. CASA refers to Current Account and Savings Account deposits, which are generally a relatively lower-cost source of funding for banks and can support the net interest margin.
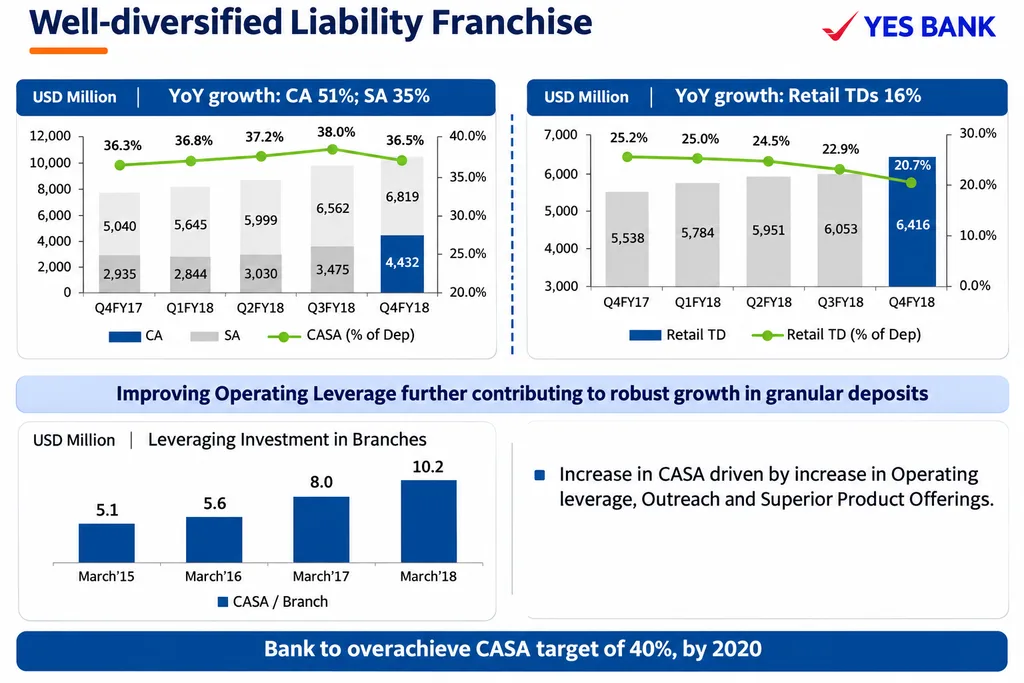
The bank’s Q3 FY18 investor presentation also reported a CASA ratio of 38%, compared with 33.3% in the corresponding quarter of the previous year. On the surface, this suggested that YES Bank was building a stronger deposit franchise alongside its rapid loan growth.
But there is an important distinction investors should make. A growing deposit base does not automatically mean the bank’s lending is safe. Deposits tell us how a bank is funding its operations. They do not tell us whether the borrowers will repay their loans.
Capital Adequacy: Why the Numbers Looked Comfortable Until They Didn’t
A bank can have a rapidly growing loan book and a strong deposit base, but what happens when borrowers stop repaying? That is where capital adequacy becomes critical. It tells investors how much capital a bank has available to absorb losses relative to its risk-weighted assets.
At first glance, YES Bank appeared well-capitalised. Its Capital Adequacy Ratio (CAR) stood at 17% in March 2017, comfortably above the then applicable regulatory requirement. By March 2018, it had increased further to 18.4%. These figures suggested that the bank had a reasonable capital cushion to support its growing business.
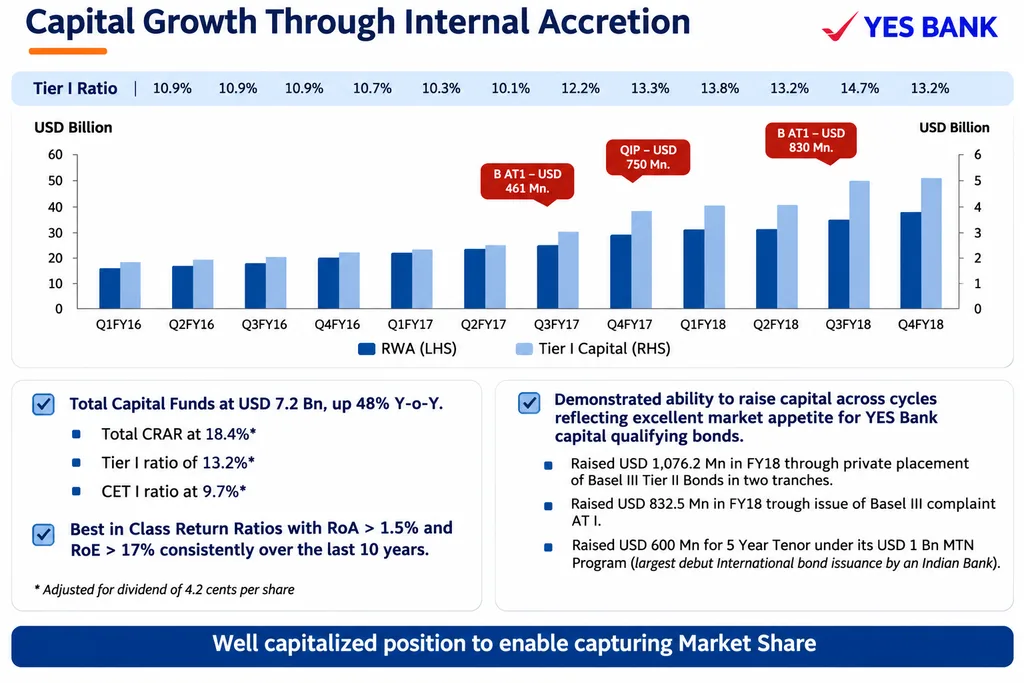
But one detail deserves closer attention. While the overall CAR improved, the bank’s Common Equity Tier 1 (CET1) ratio fell from 11.4% in March 2017 to 9.7% in March 2018. CET1 is the highest-quality form of bank capital, consisting primarily of common equity and retained earnings. It is particularly important because it represents the first line of defence against unexpected losses.
The Crisis, the Rescue and the ₹8,415 Crore Bond Controversy
By March 2020, the concerns surrounding YES Bank had turned into a full-blown banking crisis. What had once looked like a fast-growing private bank was now facing a serious liquidity and confidence problem. The situation became severe enough for the RBI and the Central Government to step in.
On March 5, 2020, the government imposed a moratorium on the bank under Section 45 of the Banking Regulation Act, 1949. The RBI superseded the bank’s board and appointed an administrator to take charge. During the moratorium, customers faced restrictions on withdrawals, adding to concerns about the bank’s stability.
The Reconstruction: A Rescue Plan Takes Shape
The intervention was followed by the YES Bank Limited Reconstruction Scheme, 2020, notified on March 13. The plan brought in a consortium of investors led by the State Bank of India (SBI), alongside other financial institutions, to recapitalise and reconstruct the bank. The new board took charge on March 26, 2020, marking the beginning of its recovery process.
But the rescue came with another major controversy: the treatment of the bank’s Additional Tier 1 bonds.
The AT1 Write-Down: Why Bondholders Lost Their Investment
YES Bank had issued AT1 bonds worth ₹8,415 crore in two tranches: ₹3,000 crore in 2016 and ₹5,415 crore in 2017. These instruments are designed to absorb losses when a bank’s financial position deteriorates. Unlike ordinary fixed-income bonds, AT1 instruments carry the risk of being written down or converted into equity under specified conditions.
On March 14, 2020, the bank’s administrator wrote down the entire ₹8,415 crore. This meant that the affected bondholders lost their investment, including institutional and retail investors.
The decision was challenged in court. In January 2023, the Bombay High Court set aside the write-down. The bank, the RBI and the Central Government challenged that decision before the Supreme Court.
The October 2026 Verdict: The Controversy Returns
On October 15, 2026, the Supreme Court upheld the Bombay High Court’s decision, ruling that the administrator did not have the authority to write down the AT1 bonds after the final reconstruction scheme had been notified. The Court also noted that the provision permitting the write-down had been removed from the final scheme.
The ruling brought the ₹8,415 crore bond issue back into focus, with potential implications for the bank’s capital position. On November 13, 2026, the bank disclosed that it had filed a review petition before the Supreme Court seeking reconsideration of the judgment.
The episode highlights an important distinction for investors: a bank’s financial health is not determined by its loan book alone. Its capital structure, funding instruments, regulatory position and ability to absorb losses matter just as much.
Where YES Bank Stands Today
The recovery is visible in the latest YES Bank Q2 results for FY27, but the numbers still need to be read carefully. For the quarter ended September 2026, the bank reported a net profit of ₹1,080 crore, up 65% year-on-year, while net interest income increased 22.7% to ₹2,822 crore. Asset quality also improved, with GNPA declining to 1.2% from 1.6% and NNPA falling to 0.2% from 0.3% a year ago.
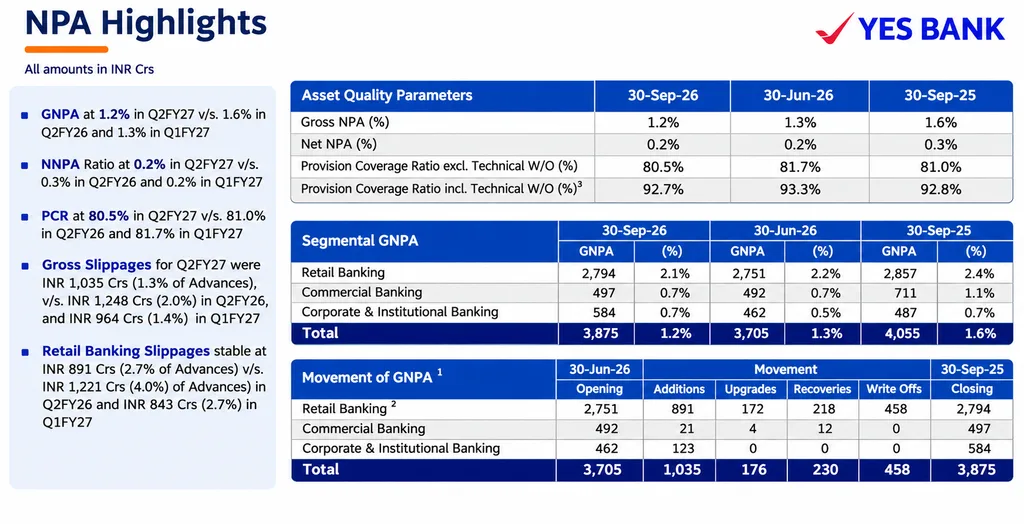
Advances grew 23.7% to ₹3,09,510 crore, while deposits increased 19.5% to ₹3,54,004 crore. However, the CASA ratio declined to 30% from 33.7%, and the capital adequacy ratio fell to 14.5% from 15.6% a year earlier.
The ₹8,415 crore AT1 bond judgment remains a significant uncertainty. The bank did not recognise its financial impact in the reported results. Its pro-forma estimates indicated a potential net loss of ₹5,217 crore and a CET1 ratio of 11.4%. These are indicative estimates, not reported financial figures.
Overall, profitability and asset quality have improved, but deposit composition, capital strength and the unresolved AT1 bond issue remain important areas to monitor.
How to Check Any Bank in StockEdge: A Step-by-Step Guide
The YES Bank case shows why investors need to look beyond headline profits. Here are five quick checks you can perform on StockEdge to assess the financial health of banking stocks in India.
Step 1: Open Financial Highlights and Ratios
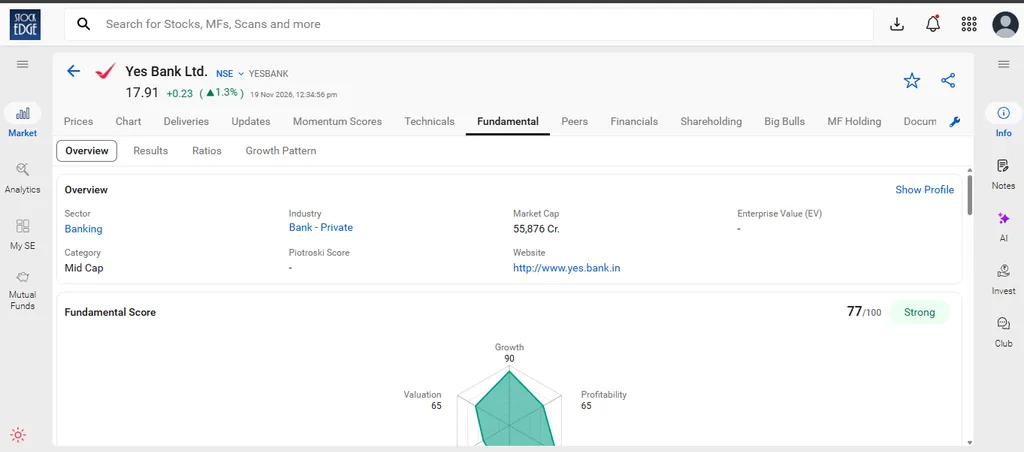
Search for the bank on StockEdge, take an example of YES Bank and open its Stock Fundamentals section. Review its key financial figures and banking ratios.
Step 2: Track GNPA, NNPA and CRAR
Check their five-year trends to understand whether bad loans are declining and the capital adequacy ratio is holding up.
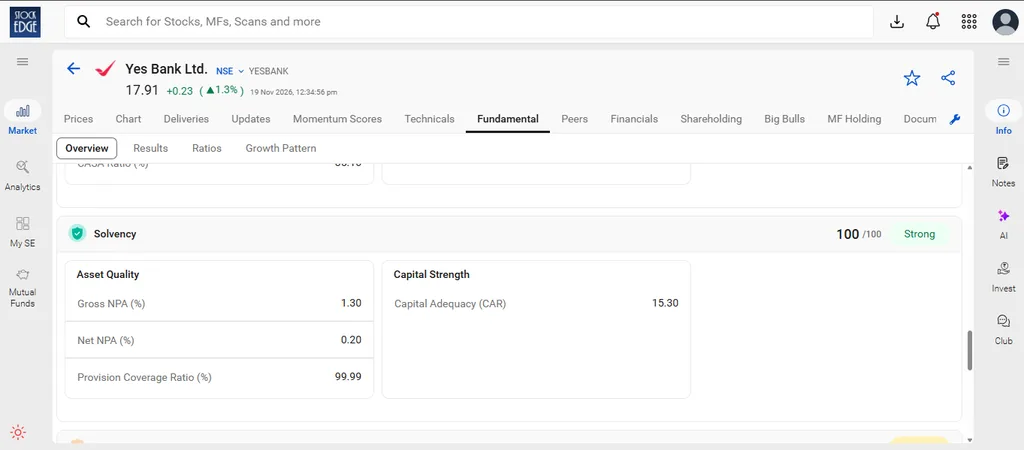
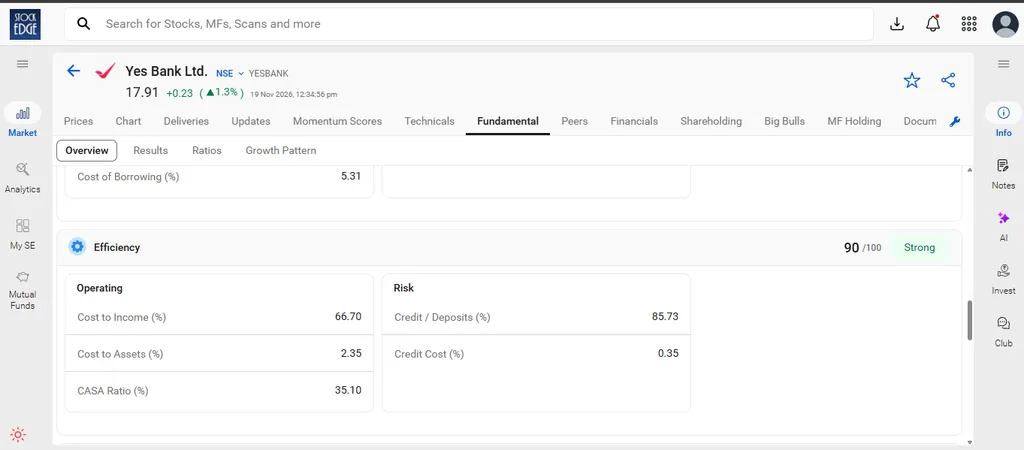
Step 3: Examine CASA, NIM and Cost-to-Income
These ratios, including the net interest margin, help assess deposit quality, lending profitability and operating efficiency.
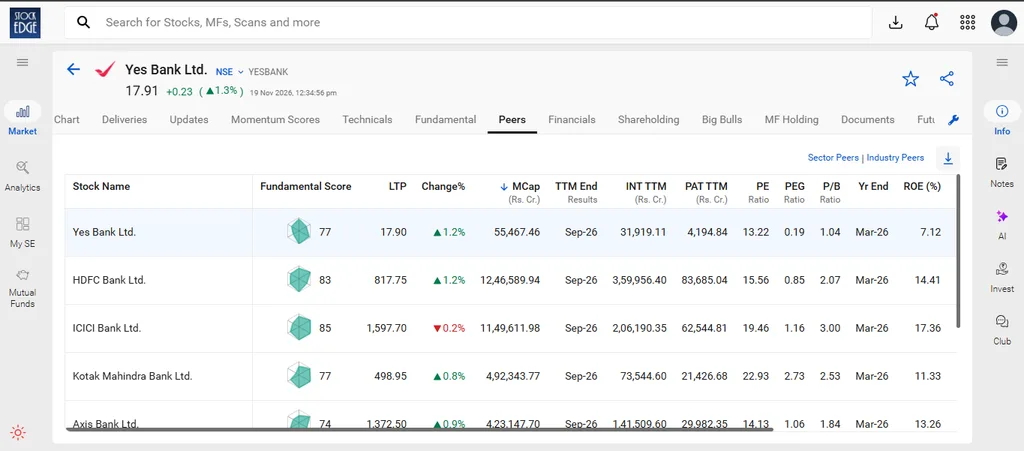
Step 4: Compare the Bank with Its Peers
Compare its growth, asset quality, profitability and capital ratios with other banks to understand its relative position.
Step 5: Track Every Quarterly Result
Monitor changes in profits, advances, deposits, NPAs and provisions, as the YES Bank Q2 results show. One quarter may look strong, but consistent trends reveal more about the bank’s health.
Bank Warning-Sign Checklist: What Investors Should Watch
This case highlights how multiple warning signs can exist beneath apparently strong financial performance. The following checklist can help investors identify areas that deserve closer attention.
| Metric | What YES Bank showed | What investors should look for |
| Credit growth | Rapid advances growth | Credit growth consistently outpacing deposits |
| GNPA and NNPA | Significant gap between reported and RBI-assessed NPAs | Rising bad loans or regulatory divergence |
| CASA ratio | Initially stable, but declined in recent years | Sustained decline in low-cost deposits |
| CRAR and CET1 | Overall capital ratio appeared comfortable, while CET1 weakened | Falling capital buffers or proximity to regulatory minimums |
| Provisions | RBI assessment revealed higher provisioning requirements | Inadequate provisions against stressed loans |
| Profitability | Reported profits did not fully reflect the underlying stress | Profit growth unsupported by core income or asset quality |
Beyond financial ratios, investors should also assess qualitative factors such as the bank’s corporate governance, management credibility, lending policies, risk management practices and regulatory compliance. These factors may not always be visible in the financial statements, but they can significantly influence the bank’s long-term stability and financial health.
Common Mistakes Investors Should Avoid While Analysing Banks
Even experienced investors analysing banking stocks in India can misread a bank’s financial health by focusing on a few headline numbers. The YES Bank case highlights three common mistakes.
- A low reported GNPA does not always mean asset quality is healthy. Investors should also examine NNPA, provisioning and any divergence disclosed by the RBI.
- Rapid loan growth may look attractive, but it is important to assess whether deposits are keeping pace and whether lending standards remain sound.
- A comfortable capital adequacy ratio (CRAR) may hide weakness in core capital. Investors should also track CET1 and the bank’s capital buffers.
- A growing deposit base does not automatically indicate stable funding. Investors should monitor the CASA ratio and the bank’s dependence on high-cost deposits.
- Rising net profit may not reflect sustainable performance. Investors should also examine net interest income, net interest margin, provisions and whether earnings are supported by core banking operations.
FAQs
1. What went wrong at YES Bank?
Aggressive lending, hidden asset-quality stress and governance concerns weakened the bank’s financial position.
2. What is GNPA vs NNPA?
GNPA represents total bad loans, while NNPA represents bad loans remaining after provisions.
3. Why does the CASA ratio matter?
It indicates the share of low-cost current and savings deposits in a bank’s total deposits.
4. What happened to YES Bank’s AT1 bonds?
The ₹8,415 crore bonds were written down in 2020, but the Supreme Court overturned the decision in October 2026.