

Table of Contents
Rising Brent crude above $100 does not hit every Indian company the same way: airlines, paint makers, tyre makers and oil marketing companies face higher costs, while upstream producers like ONGC and Oil India may gain. A five-step StockEdge walkthrough takes you from crude-linked sectors to peer comparison, raw material cost trends, gross and EBITDA margins, and a watchlist. Checking Q2 results for cost pass-through, and avoiding the habit of treating every oil-linked stock as a loser, keeps the focus on margins rather than headline crude moves.
When Brent crude crosses $100 per barrel, the impact doesn’t stop at petrol pumps. For an airline, it means a higher fuel bill. For a paint manufacturer, it can mean costlier raw materials. And for an oil marketing company, it can put pressure on fuel marketing margins.
With Brent crude staying above $100 since September, rising oil prices have once again become a concern for Indian markets. Since India imports most of its crude oil requirements, a sustained spike can increase costs for businesses, squeeze profit margins and affect stock prices across several sectors.
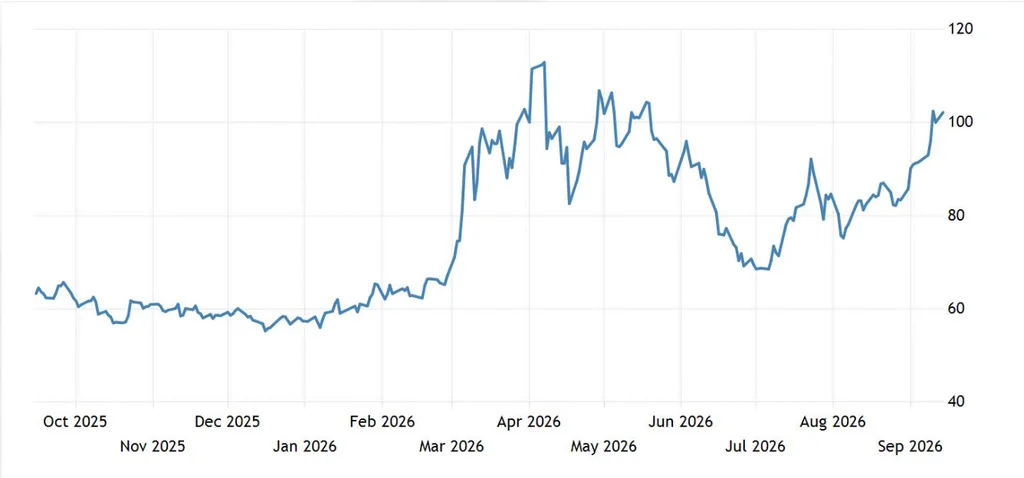
But here’s the question investors need to ask: which crude oil stocks are most exposed to rising crude oil prices, and how can you identify the impact before it shows up in their earnings?
When Crude Oil Gets Expensive, Which Businesses Feel the Heat?
A rise in crude oil prices doesn’t affect every company in the same way. For some businesses, crude is a major raw material. For others, it is an important part of their transportation and operating costs.
Take airlines, for example. Aviation turbine fuel (ATF) is one of their biggest expenses. When crude prices rise, fuel costs can increase and put pressure on operating margins.
Paint manufacturers face a different challenge. Many of their raw materials are crude-oil derivatives, so higher oil prices can increase production costs. Tyre makers, chemical companies and packaging businesses can also feel the impact through costlier inputs.
But the story isn’t always negative. Among crude oil stocks, upstream oil producers may benefit from higher crude prices because they can earn more from selling oil.
The RBI reported that India’s merchandise trade deficit widened to US$86.6 billion in Q1 FY2026–27, compared with US$68.7 billion in Q1 FY2025–26. Imports of crude oil, electronic goods and gold were among the main contributors.
The key difference is whether crude oil is a cost for the company or a source of revenue. Understanding this distinction is the first step towards identifying crude-sensitive stocks.
Why Crude Oil Matters for Indian Stocks
India’s dependence on imported crude oil makes global oil prices an important factor for its economy and financial markets. A sustained increase in prices means India has to spend more on imports, which can widen the trade deficit and put pressure on the rupee.
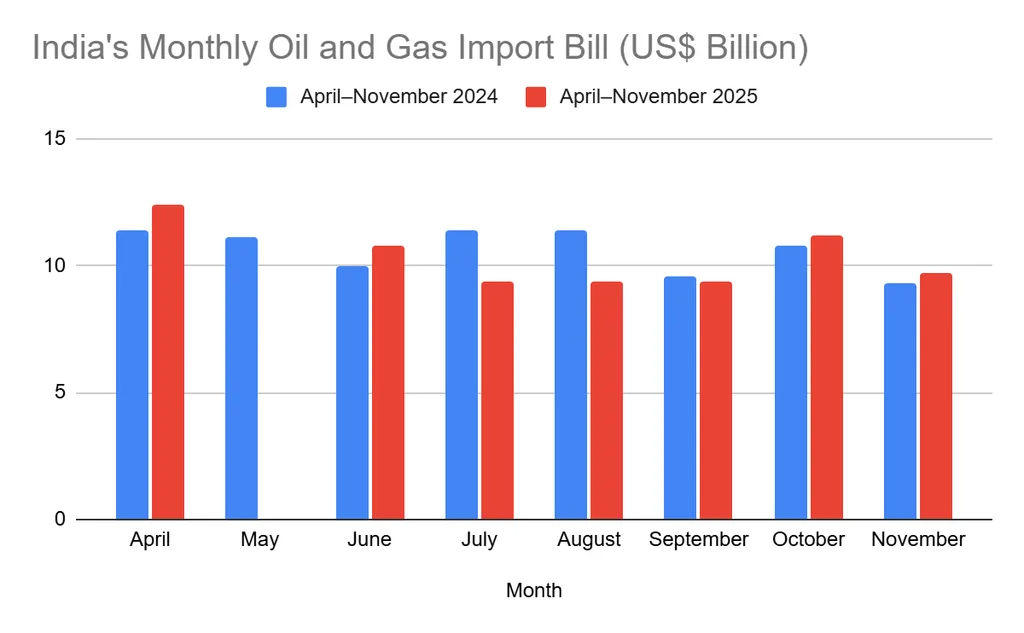
Currency movements add another layer to the impact. Since crude oil is traded in US dollars, a weaker rupee makes imports even more expensive. This can create additional cost pressures for businesses and influence the outlook for inflation, interest rates and economic growth.
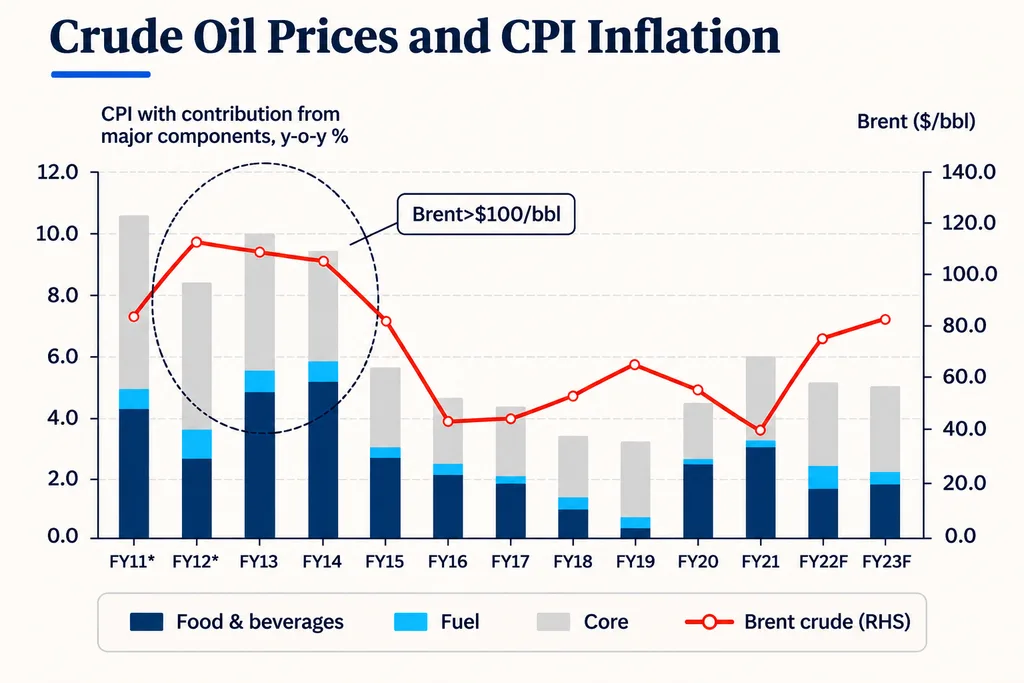
RBI’s study estimates that a 10% increase in global crude oil prices could raise India’s headline inflation by around 20 basis points.
For investors, the impact can show up in company earnings, valuation expectations and sector performance. However, the extent of the impact varies across businesses. Tracking crude oil prices alongside a company’s operating costs, raw material costs and margins can help investors understand which crude oil stocks are more vulnerable to an oil price shock.
Which Crude Oil Stocks Gain and Which Lose When Crude Rises
A rise in crude oil prices can create very different outcomes for crude oil stocks within the oil and gas sector. The biggest distinction is between companies that produce crude oil and those that buy it as a raw material.
| Category | Companies to watch | Likely impact of rising crude prices |
| Upstream oil producers | ONGC, Oil India | May benefit from higher selling prices and improved realisations. |
| Oil marketing companies | Indian Oil, BPCL, HPCL | May face pressure on marketing margins if fuel prices do not rise alongside crude costs. |
| Refining companies | Reliance Industries, Chennai Petroleum | Impact depends on refining margins, or the difference between the value of refined products and crude oil costs. |
| Aviation companies | InterGlobe Aviation, SpiceJet | Higher fuel costs can increase operating expenses and squeeze margins. |
| Paint and tyre manufacturers | Asian Paints, Berger Paints, MRF, CEAT | May face higher input costs because several raw materials are linked to crude oil. |
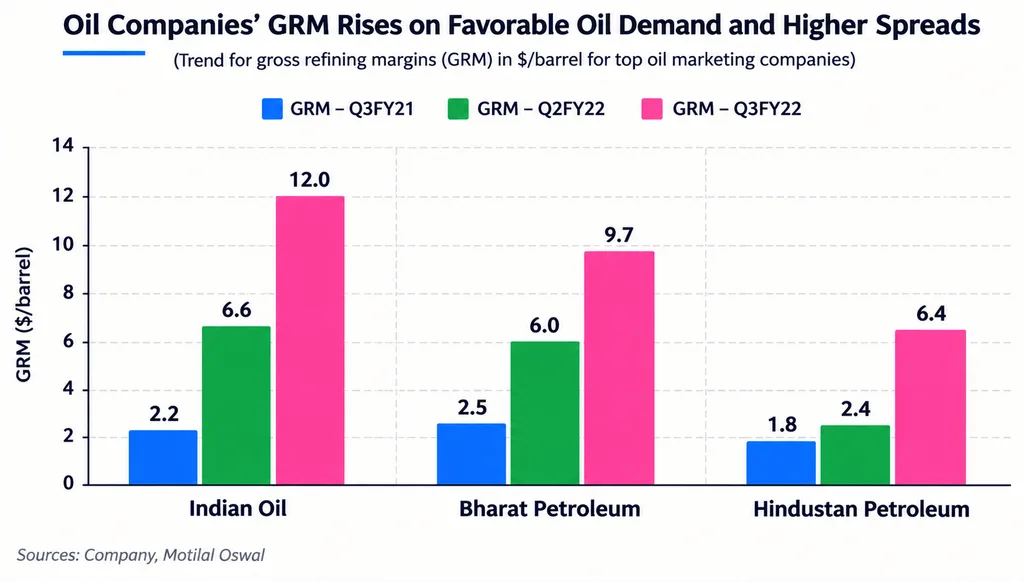
The impact is not always straightforward. For instance, oil marketing companies can benefit when retail fuel prices remain stable and crude prices fall, but the same situation can hurt them when crude prices rise. Similarly, refiners may still perform well if the prices of their finished products increase enough to protect refining margins.
The important point is that a rising crude oil price does not automatically make all crude oil stocks attractive or unattractive. Investors need to examine how each company’s revenue and costs respond to the change. This is where tracking operating margins, EBITDA margin trends, raw material costs and quarterly results becomes important.
How to Find Crude-Sensitive Stocks in StockEdge
Knowing which sectors are affected by crude oil prices is only the starting point. The next step is to identify individual crude oil stocks and examine how changes in input costs are reflected in their financial performance. StockEdge can help you shortlist crude oil stocks, compare their financials and track their quarterly results.
Step 1: Open the sector view and shortlist the crude-linked sectors
Visit StockEdge Markets and navigate to the Sectors section. Browse the available sectors and shortlist those with businesses that have direct or indirect exposure to crude oil prices.
Start with sectors such as Oil & Gas, Aviation, Paints, Chemicals, Tyres and other industries that use petroleum-based products. This gives you a starting list of crude oil stocks to investigate further.
Step 2: Compare companies within each sector
Once you have shortlisted the sectors, look at the individual crude oil stocks operating within them. StockEdge’s Sector/Industry section allows you to explore stocks within a sector or industry and compare their financial performance.
For example, within the paint industry, you can compare companies such as Asian Paints and Berger Paints. Similarly, you can examine oil marketing companies such as Indian Oil, BPCL and HPCL.
Don’t shortlist a stock based on its sector alone. Compare its revenue growth, profitability and financial performance to understand how it is performing relative to its peers.
Step 3: Check raw material cost trends
After shortlisting crude oil stocks, open their individual stock pages and examine their financial statements, particularly the Profit & Loss statement.
Look at the cost of raw materials or materials consumed over the last few quarters. Compare the movement in these expenses with revenue growth and crude oil prices.
For instance, if a paint manufacturer’s raw material costs are rising faster than its revenue, it could indicate pressure on profitability. However, also check whether the company has increased product prices or improved operational efficiency to manage these costs.
Step 4: Check operating and gross margins over recent quarters
Raw material costs alone do not tell the complete story. You also need to examine whether the company is managing its overall expenses effectively.
Track the following indicators across recent quarters:
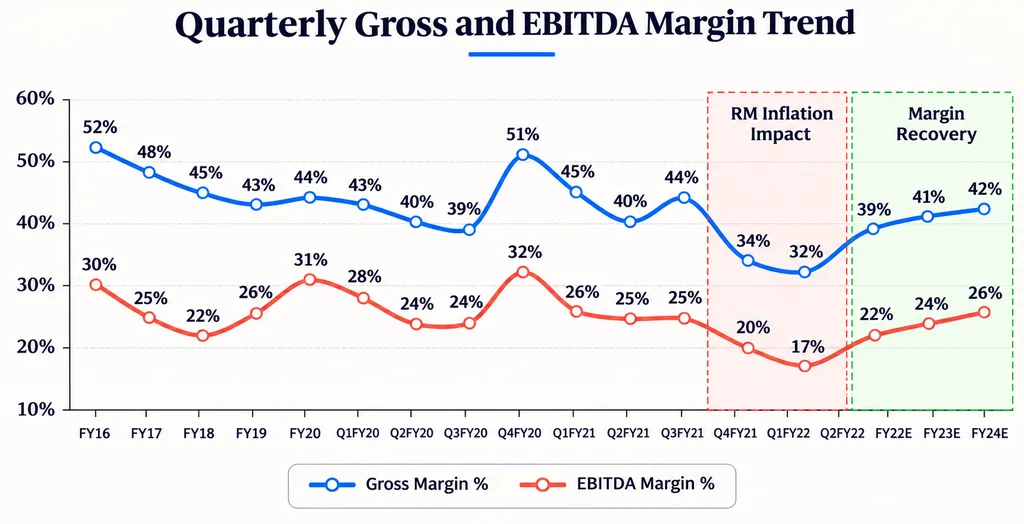
- Gross Margin: Helps assess how much revenue remains after accounting for the cost of goods sold. A decline may indicate rising input costs or pricing pressure.
- EBITDA Margin: Shows the company’s operating profitability after accounting for operating expenses. A sustained decline can indicate pressure on operating performance.
- Operating Profit: Helps you understand whether the company’s core business is generating higher or lower profits.
Compare these figures for each of your crude oil stocks across at least four to six quarters to identify a trend rather than relying on a single quarter. StockEdge’s financial analysis and Sector Analytics features can help you examine sales, EBITDA and profitability trends. For gross margin, check the relevant financial statement line items and calculate it if the platform does not display it directly.
Step 5: Add the stocks to a watchlist and track results
Once you have identified crude oil stocks worth monitoring, add them to your StockEdge watchlist. This makes it easier to follow their price movements and review their financial performance as new quarterly results become available.
Keep an eye on crude oil prices alongside each company’s raw material expenses, gross margins and EBITDA margins. If crude prices remain elevated but a company manages to maintain its margins, it may be handling the cost pressure better than its peers.
The objective is not simply to find stocks that move with crude oil prices. It is to identify crude oil stocks whose financial performance could change meaningfully when crude prices rise or fall.
What to Watch in Q2 Results
A rise in crude oil prices does not immediately translate into lower profits. The Q2 results can help investors understand whether crude oil stocks are absorbing higher costs or passing them on to customers. Here are three things to check in crude-sensitive stocks.
Raw material cost as a share of sales
Compare raw material expenses with revenue over recent quarters. If raw material costs are growing faster than sales, it could indicate increasing cost pressure. This is particularly important for industries such as paints, tyres and chemicals.
Margin change versus the previous quarter and year
Look at gross and EBITDA margins on both a quarter-on-quarter and year-on-year basis. A decline in margins may indicate that higher input costs are affecting profitability. Comparing both periods helps distinguish a recent change from a longer-term trend.
Management commentary on price hikes and pass-through
Read the company’s earnings presentation and conference call commentary. Check whether management has increased product prices, absorbed additional costs or plans to pass them on to customers. This helps investors understand how the company is responding to rising crude prices and whether margins could recover in subsequent quarters.
Common Mistakes to Avoid
Crude oil movements can influence company earnings, but relying on price movements alone can lead to misleading conclusions. Here are three common mistakes investors should avoid when analysing crude-sensitive stocks.
Treating Every Oil-Linked Stock as a Loser
Higher crude prices do not affect all crude oil stocks negatively. Upstream oil producers may benefit from better realisations, while some refiners can benefit from favourable refining margins. Always understand a company’s business model before assessing its exposure.
Ignoring Pricing Power and Inventory Cycles
Crude oil stocks with strong pricing power may pass higher input costs on to customers, limiting the impact on margins. Inventory cycles also matter because companies may be holding raw materials purchased at earlier prices. Ignoring these factors can lead to an incomplete assessment of profitability.
Reacting to Crude Price Movements Instead of Margins
A sudden rise in crude prices does not automatically mean a company’s profitability will decline. Investors should look at changes in raw material costs, gross margins and EBITDA margins to understand the actual impact. Financial performance matters more than reacting to every movement in crude oil prices.
FAQs
1. Which crude oil stocks are most sensitive to crude oil prices?
Aviation, paints, tyres, chemicals and oil marketing companies are highly sensitive to crude oil price movements.
2. Which sectors benefit when crude oil rises?
Upstream crude oil stocks such as ONGC and Oil India may benefit from higher crude prices through better realisations.
3. How does crude oil affect paint and tyre stocks?
Higher crude prices increase the cost of petroleum-based raw materials, potentially putting pressure on their profit margins.
4. How do I check a company’s raw material cost in StockEdge?
Open the company’s page on StockEdge, go to its Profit & Loss statement and compare raw material expenses across recent quarters.