Key Takeaways
- What’s New: StockEdge Version 13.3 introduces Index Analytics, Market Breadth with Momentum Scores, and Sector Rotation tools.
- Index Analytics: Provides a clear view of index performance, ownership trends, and company-level contributions in major indices.
- Market Breadth & Momentum: Combines stock participation with momentum scores across 1M, 3M, and 6M to assess trend strength.
- Sector Rotation: Helps investors track sectors gaining or losing momentum, making it easier to spot leaders and avoid laggers.
- Who Benefits: Useful for traders, long-term investors, and portfolio managers seeking data-driven decisions and better timing.
When it comes to investing, most people start by tracking individual companies. They look at balance sheets, results, or stock charts. While that’s important, it often misses the bigger picture: how indices, sectors, and market trends behave together.
With the launch of StockEdge Version 13.3, investors now have a powerful way to combine fundamental insights (ownership, results) with market momentum (breadth, sector rotation).
This update introduces three standout features: Index Analytics, Market Breadth, and Enhanced Sector Rotation with momentum scores, designed to help both long-term investors and short-term traders make better decisions.
New Features of StockEdge Version 13.3
Index Analytics: A Macro View of the Market
Until now, investors have mostly analyzed stocks one by one. But indices like Nifty 50, Bank Nifty, Nifty 500, and Financial Services capture the collective performance of key companies. Here’s what you get with Index Analytics:
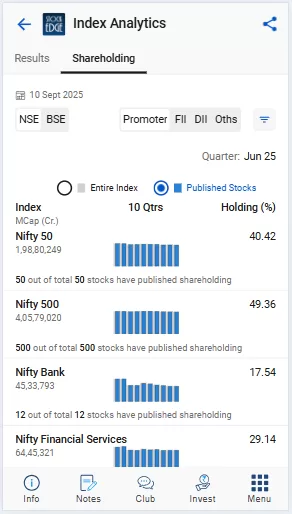
Understand how promoters, FIIs, DIIs, and retail investors are positioned within the entire index. For example,
- Nifty 50: Promoter holding at 40.42% → large-cap companies generally have diversified ownership, with significant institutional participation.
- Nifty 500: Promoter holding at 49.36% → mid- and small-cap companies usually have higher promoter ownership.
- Nifty Bank: Promoter holding at 17.54% → much lower because most big banks are professionally managed institutions with high public & FII shareholding
- Nifty Financial Services: Promoter holding at 29.14% → a mix of private NBFCs (higher promoter stakes) and listed institutions (lower promoter stakes).
Why this matters: If institutions are increasing their stake in an index and the results show steady growth, it signals a strong underlying trend. Instead of chasing individual stocks randomly, you can ride the strength of the whole index.
Market Breadth with Momentum Scores
Market Breadth tells you how many stocks within an index are moving up versus going down. It’s an important indicator of trend strength. StockEdge now enhances this by adding Momentum Scores for different timeframes – 1 month, 3 months, and 6 months.
The scoring system is simple:
- 61–100 (Green) → Bullish trend
- 41–60 (Yellow) → Neutral
- 0–40 (Red) → Bearish trend
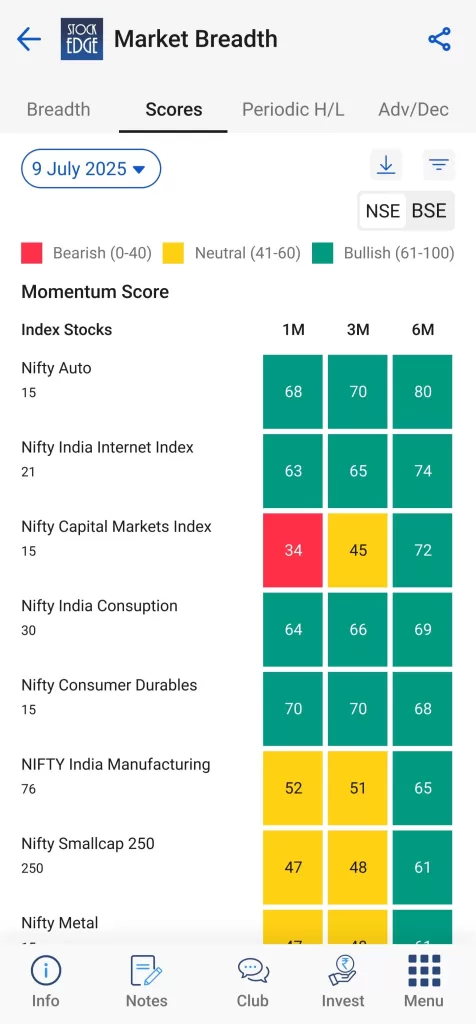
Example insights
- The Nifty Auto Index has a 6-month momentum score of 80, confirming a strong bullish trend.
This feature is especially useful for swing traders and short-term investors who want to time their entries and exits more effectively. Instead of relying only on price charts, you now get a quantitative score that reflects sector-wide strength.
Sector Rotation with Momentum Scores
Markets move in cycles. Some sectors lead during certain phases, while others lag. Understanding these rotations can significantly improve portfolio performance.
The updated Sector Rotation tool in StockEdge shows how momentum shifts across industries, backed by data for 1M, 3M, and 6M horizons.
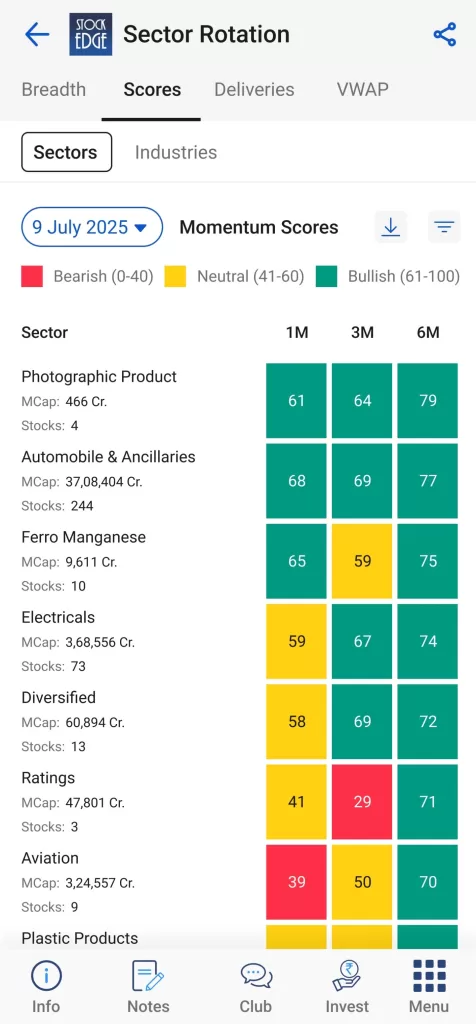
Examples
- Automobile & Ancillaries scored 77 (6M) → making it a clear momentum leader.
- Aviation moved from 39 (bearish) to 70 (bullish) → highlighting a potential turnaround story.
By following sector rotation, investors can capture early opportunities in emerging leaders and avoid being stuck in underperforming areas.
Who Benefits from These Features?
- Long-term investors: Get clarity on where institutional investors are placing bets and which indices are showing consistent earnings strength.
- Momentum traders: Use Market Breadth and Momentum Scores to identify bullish or bearish shifts early.
- Portfolio managers: Track sector rotation cycles and rebalance exposure accordingly.
By combining these insights, you can approach investing with both macro awareness (index and sector strength) and micro timing (momentum entry/exit signals).
Bottomline
StockEdge Version 13.3 bridges a crucial gap for investors. Instead of juggling multiple data sources, you now have a single platform where fundamental and technical signals come together.
- Index Analytics gives you the macro view of ownership and results.
- Market Breadth with Momentum Scores highlights the underlying strength of trends.
- Sector Rotation with Momentum Score helps you stay ahead of market cycles.
Update Now!


