Key Takeaways
- Sector Analytics by StockEdge: It’s a feature in the StockEdge app that helps you track and compare performance of different sectors and industries in the stock market.
- Smart Comparisons: You can view sector-wise price trends, volume changes, and momentum making it easier to spot which sectors are strong or weak.
- Time-Based Filters: Sector performance can be analysed across different timeframes like 1 week, 1 month, 3 months, etc., for short-term or long-term decisions.
- Quick Insights: It helps you find trending sectors, rising stocks within sectors, and where the smart money is flowing ideal for both traders and investors.
- Better Decision Making: With sector-level data at your fingertips, you can make smarter stock picks based on overall market mood and sector rotation.
Have you ever heard about EIC analysis? It is basically an abbreviation of Economy, Industry and Company analysis which is a top down approach framework in fundamental analysis in stocks. Sector analytics provides deep insights on industry growth and its stocks.
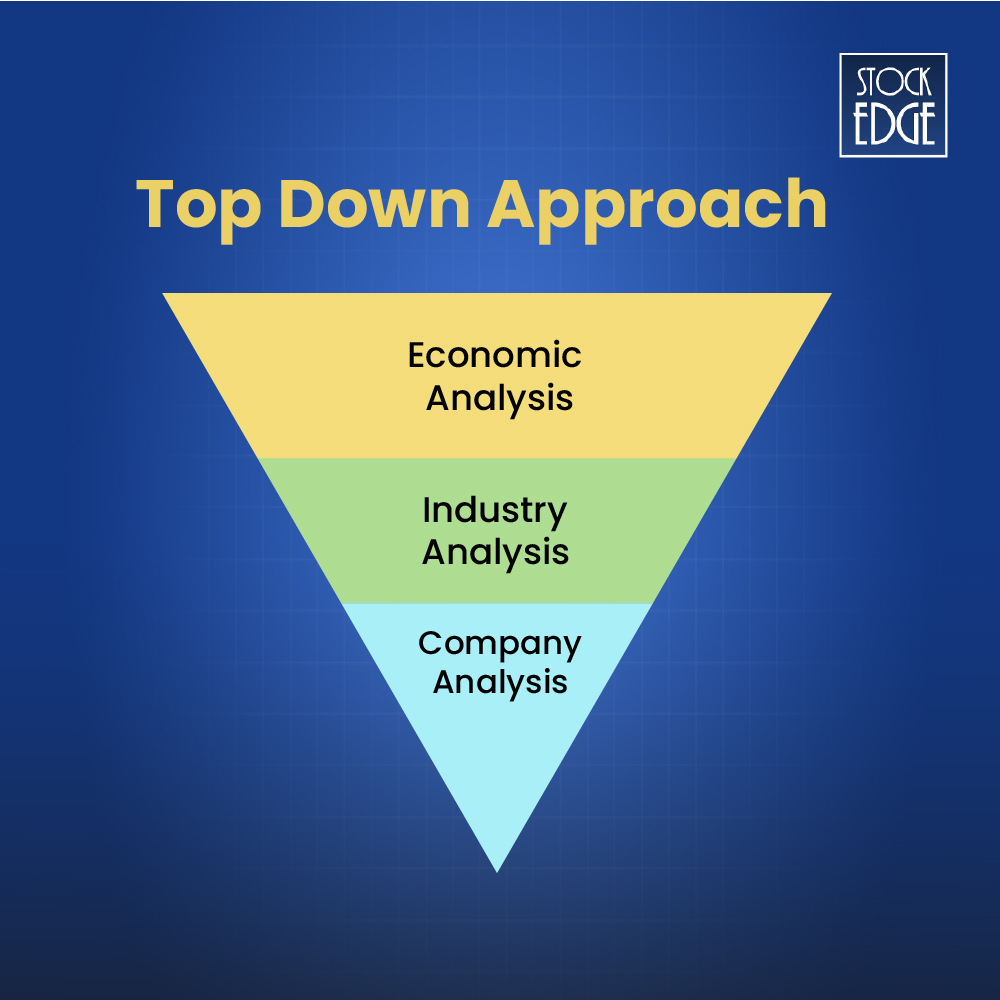
Economic analysis is of utmost importance to large investors, as they diversify their investments in several countries like emerging markets such as India, China, Bangladesh, and more. However, domestic investors don’t have much of a privilege other than to invest in their own country. Yes! Our country, India, has been growing significantly and is considered the top emerging market for global investors to invest in. Next, it comes down to analyzing the industry, where StockEdge offers a unique way to analyze a sector with the Sector Analytics feature of the StockEdge app. Not just that, sector analytics can also help you identify strong stocks from any given sector of the market, which basically involves doing a company analysis to make an informed investment decision.
This article explores the features of sector analytics to showcase how to identify strong stocks from growing sectors of the market. But to identify which sectors are outperforming, follow the sector rotation: Beat the street with Sector Rotation Strategy
What is Sector Analytics?
Sector Analytics is a Pro feature of StockEdge which combines the financial performance of all stocks in a respective sector for a given period based on the outcome of the financial results of a company.
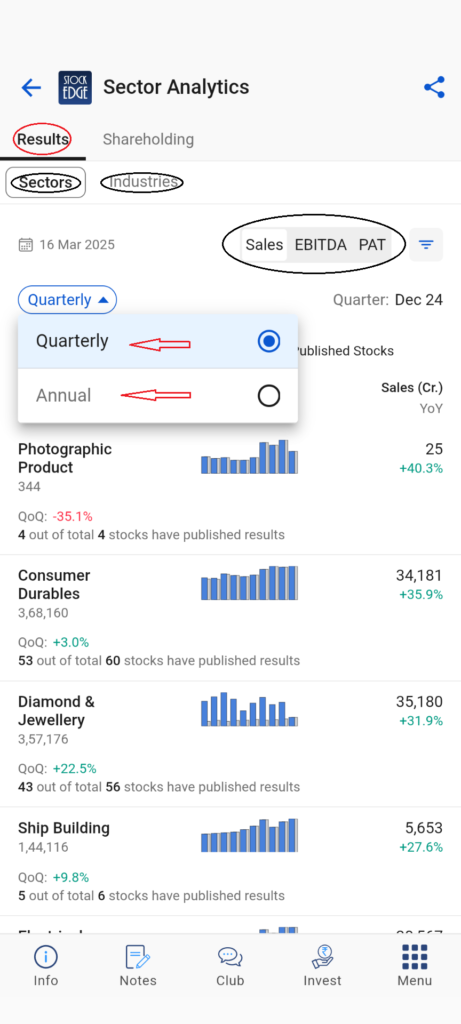
In sector analytics, you may analyze the growth of a particular sector or industry based on three major parameters, which are as follows:
- Sales: It combines the sales of all the stocks inside a sector or an industry to find its growth on a quarterly basis (QoQ) and yearly basis (YoY).
- EBITDA: Earning Before Interest, Taxes, Depreciation and Amortization (EBITDA) is nothing more than the operating profit of the company. Here it combines the EBITDA of all the stocks to show the growth of the sector/industry and also shows its margin.
- PAT: Profit after Tax (PAT) is basically the net profit for the company. It also combines the net profit of all the stocks to calculate the growth of the overall sector/industry on quarterly (QoQ) and yearly (YoY) growth.
So, by analyzing these three parameters of a sector you may measure the overall growth. But to identify strong stocks among the sectors or industries?
How do you find Strong Stocks in Growing Sectors?
In the sector analytics section, you find a list of all the sectors in the market along with its sales, EBITDA, and PAT figures for the last 10 quarters which helps to identify a trend in its growth. You may also switch to industries to view the same or simply click on any particular sector to know more about the industries in it.
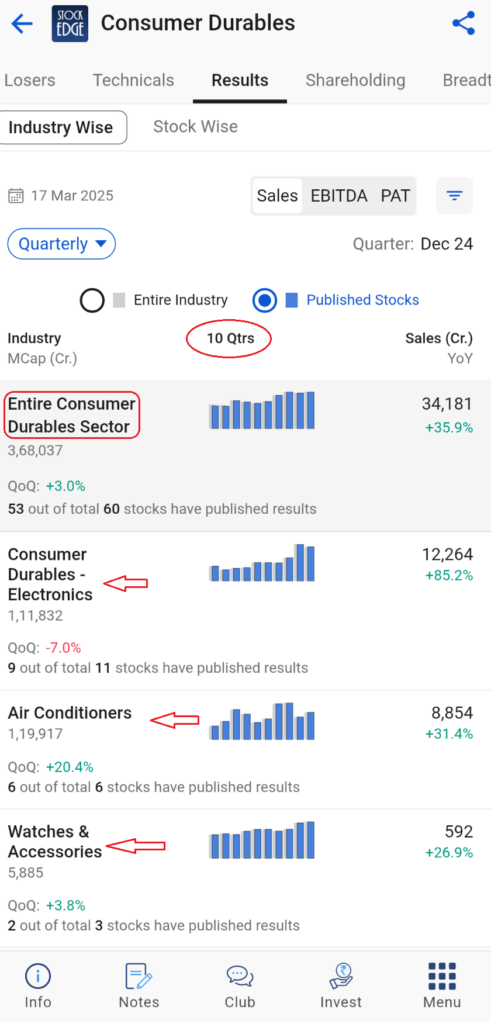
For instance, in the above screenshot, you can see the industries inside the consumer durable sector, like air conditioners, watches & accessories, and other industries down the list. In each industry, you can view the respective sales, EBITDA and PAT growth. To analyze further and identify strong stocks in the sector, let’s take a look at the air conditioner industry. Right now, the summers are coming in, so you may expect the air conditioner industry to grow in the near future. You may also view the number of stocks in a particular industry that has published its quarterly earnings. Here, in this case, 6 out of 6 air conditioners AC stocks have published their results, and the overall sales growth for this industry is 31.4%. Now, you need to compare the growth of stocks with their industry growth on the basis of sales, EBITDA and PAT to identify which stocks have outperformed the entire industry.
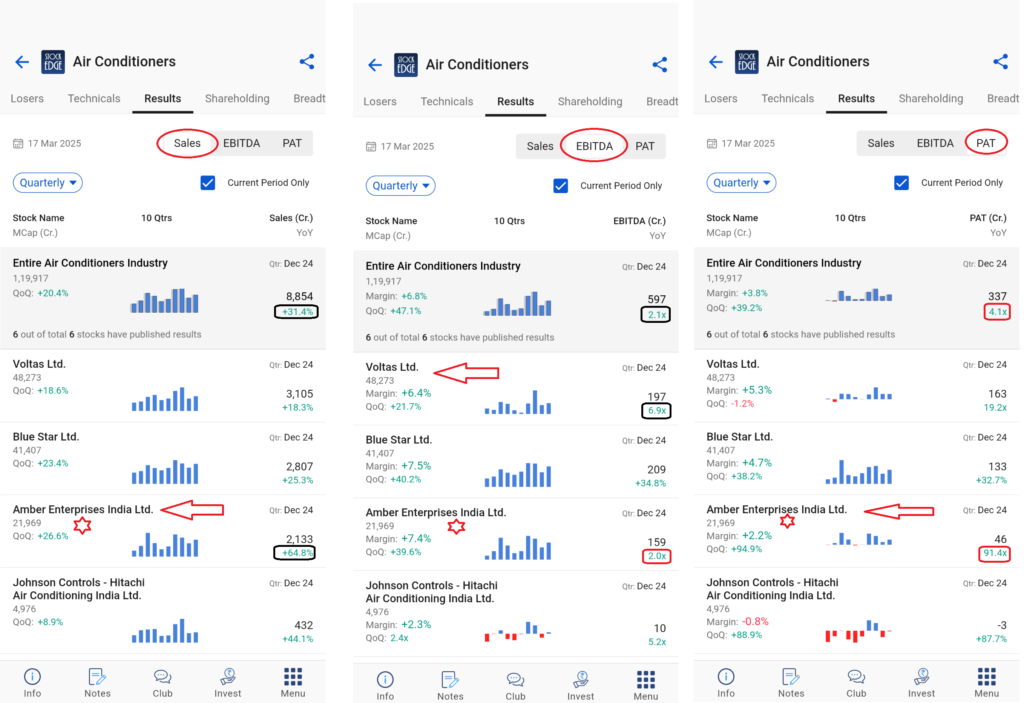
In the above three screenshots, you can view the side by side comparison of Voltas Ltd., Blue Star Ltd., Amber Enterprises India Ltd. and Johnson Controls – Hitachi Air Conditioning India Ltd. on the basis of Sales, EBITDA and PAT.
In terms of sales growth, Amber Enterprises Ltd has strongly outperformed industry growth compared to the other three stocks, whereas in EBITDA growth, Volats Ltd. surpassed the industry growth and the other three stocks. Lastly, in terms of PAT, Amber Enterprises Ltd. again outperformed the industry growth and the other three stocks on the list. So, it seems Amber Enterprises Ltd. has an edge here as it outperformed industry growth in terms of Sales and PAT, but in EBITDA if you closely see the growth in EBITDA for Amber Enterprises Ltd. is almost in line with the industry growth, it may conclude that the overall performance of Amber Enterprise Ltd. in current period stands strong compared to other companies in the list.
Similarly, you can find strong outperforming stocks in other sectors and industries and create a watchlist for yourself to keep track. Now, from the list of stocks that you have curated for several sectors/industries, track them on a daily basis using technical parameters to find the right opportunity to invest in.
Is that it? What else do you get in Sector Analytics? Wait, there is more!
Shareholding Patterns
Yes, every quarter companies publish their shareholding details and StockEdge provides overall holding composition of a sector by the Promoters, FIIs, DIIs and Others.
So, if you wish to find which sectors have highest promoter holdings or highest holdings by the FIIs. Then it is very easy to find it using StockEdge.
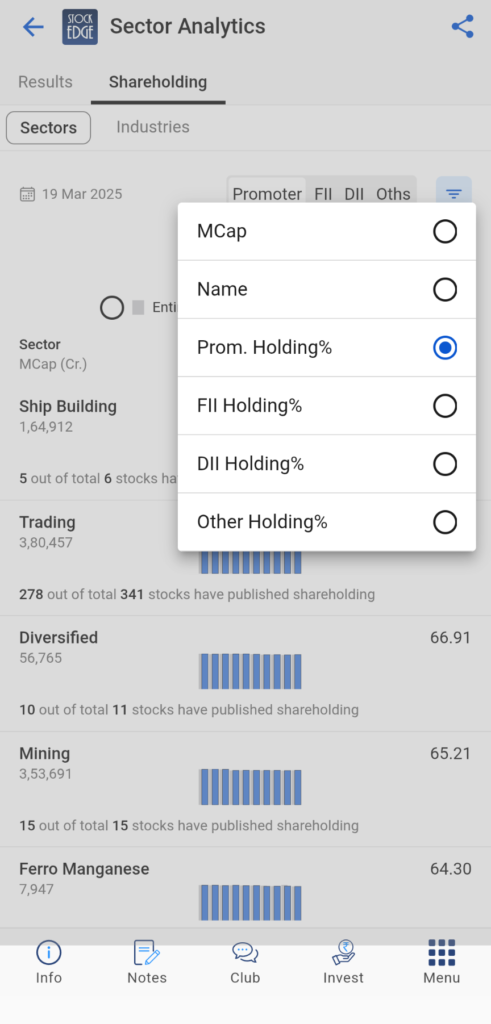
As you can see from the above screenshot, the highest to lowest shareholding patterns in sectors/industries you can find from sector analytics. In this case, the ship building sector has the highest promoted holdings.
You can watch the YT video for further explanation on how you may improve your analysis of sectors/industries to find strong stocks.
The Bottom Line
In the ever-evolving world of investing, sector analytics serves as a powerful compass, guiding you toward strong stocks within flourishing industries. By keeping a pulse on market trends, leveraging key financial metrics, and staying informed about sector-specific developments, you can uncover promising opportunities. Remember, the growth of a sector often propels its leading companies to new heights. So, whether you are a seasoned investor or a newcomer in the stock market, harness the insights from the sector analytics feature of StockEdge to make informed decisions and position your portfolio for long-term success.
Happy investing!


