Table of Contents
“In the midst of chaos, there is also opportunity” by Sun Tzu who was a Chinese philosopher, and writer. So, is there an investing opportunity in HDFC Bank stock after its drastic fall?
HDFC Bank, the second most valuable brand in India, has recently become the most disliked stock in the market. This shift in sentiment occurred as the stock experienced a nearly 10% decline in the middle of January 2024 following the release of its Q3 earnings. Being the most heavyweight stock of Nifty 50 and Nifty Bank, both the indices fell heavily. This made HDFC Bank a culprit. As of 22nd January 24, HDFC Bank stock is trading at ₹1478/share. So, is it a good time to accumulate HDFC bank stock?
In today’s blog, we will be doing HDFC Bank stock analysis to understand what went wrong in Q3 earnings and why HDFC Bank stock was punished heavily. So, without further ado, let’s get started:
To start with HDFC Bank stock analysis, the first and foremost thing is to have an understanding of the company.
Company Overview
In India, HDFC Bank is one of the top-tier banks in the private banking sector. The total business (loans + deposits) of over ₹45 lakh crore, post the merger of HDFC Ltd. and HDFC Bank. With effect from 1st July 2023, the bank has merged with its parent company, HDFC Ltd, which was a behemoth in the housing finance segment with an AUM of ₹7 lakh crore. This merger created synergy for this large financial conglomerate, which is expected to benefit from the low operating cost ratios of HDFC Ltd and the lower cost of funds from HDFC Bank.
HDFC Bank offers a range of services, for both commercial and investment banking. Renowned for its robust presence in the retail segment and strong asset quality, HDFC Bank is considered one of the top-performing banks in the country.
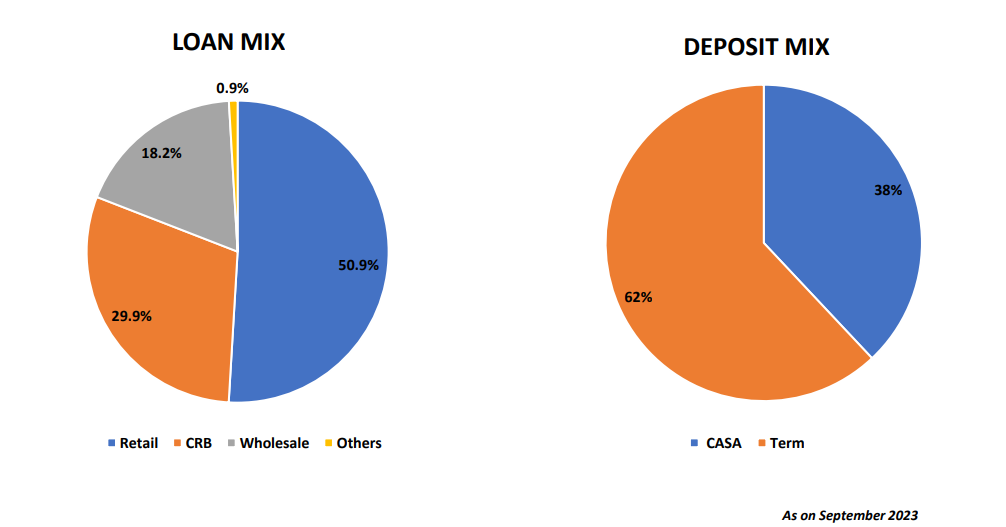
In the above image, you can see the loan and deposit mix of HDFC Bank as of September 23.
While analyzing the stocks, you must understand the overall sector in which the stock is. Nevertheless, the bank has a solid foundation, but HDFC Bank’s stock analysis is unfinished without understanding the overall banking sector.
Sectoral Outlook – Banking
The recent data from the Reserve Bank of India (RBI) in its fortnightly release indicates a noteworthy growth of 20% year-on-year (YoY) in bank credit for September 2023. This positive trend suggests an increasing demand for credit within the Indian economy.
One significant metric to assess the potential for further growth in the banking sector is the credit-to-GDP ratio. Currently, India’s credit-to-GDP ratio stands at approximately 55%, a figure that is comparatively lower than that of developed countries and other members of the BRICS (Brazil, Russia, India, China, and South Africa).
The lower credit-to-GDP ratio implies that there is substantial room for expansion in India’s banking sector. Furthermore, continued economic reforms, programmes for financial inclusion, and technological developments are making banking services more accessible. The government’s emphasis on developing the infrastructure and other economic sectors also contributes to the rise in credit demand. As businesses expand and new projects are undertaken, the need for financing from the banking sector grows.
Let’s analyze the bank’s fundamentals based on growth, profitability, efficiency, solvency, and valuation as we continue our study on HDFC Bank stock analysis.
Additionally, it is a part of Nifty 50, which is the India’s benchmark index. To know more about Nifty 50 stock read; All About NIFTY50, Components of NIFTY50, and How to Invest in it
Growth of HDFC Bank
Credit Growth
Loans serve as the primary revenue generators for a bank, much like sales functions for a manufacturing company. Therefore, the greater the growth in loans, the more favorable it is for the bank.
In Q3 FY24, overall loan growth came in at 4.9% on a sequential basis to ₹24.46 lakh crore. Over the last five years, the bank has reported a robust compound annual growth rate (CAGR) of 19.4% in credit growth, consistently outpacing the industry average.
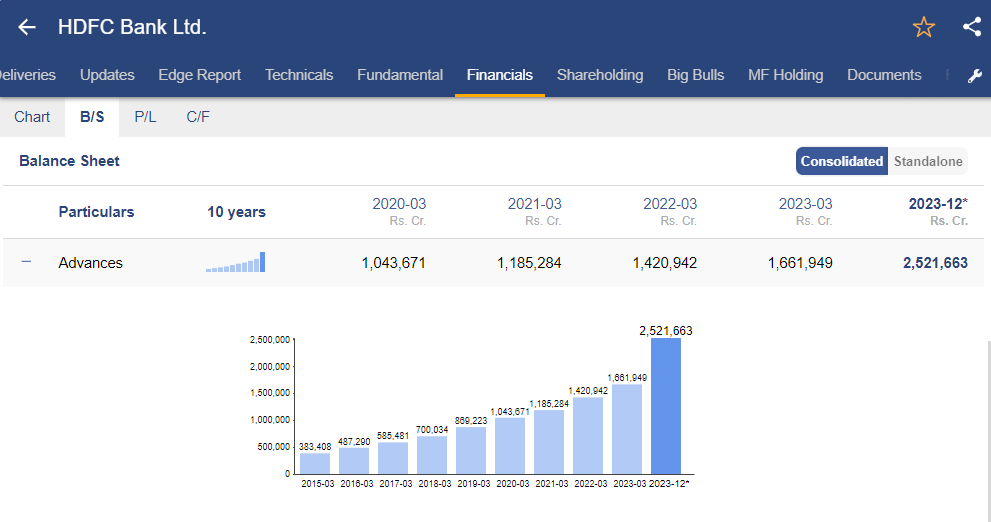
In the above image, you can see loan growth of HDFC Bank has been consistently growing over the years.
Deposit Growth
In Q3 FY24, there was a year-on-year (YoY) increase of 27.7% and a quarter-on-quarter (QoQ) rise of 1.9% in deposit growth, reaching ₹22.1 lakh crore. Retail deposits witnessed a sequential increase of ₹40,000 crore. Notably, the retail segment now constitutes a significant 84% of the total deposit base. Corresponding to the growth in loans, HDFC Bank has demonstrated robust momentum in deposits, with a commendable 19% compound annual growth rate (CAGR) over the past 5 years.
Net Interest Income (NII)
NII is how much money a bank makes from loans and investments after subtracting what it pays for deposits and other debts—it shows how well a bank earns from its core activities. In Q3 FY24, HDFC Bank posted net interest income (NII) growth of 41.9% YoY, which was largely driven by advances in growth. In contrast to the previous quarter, in Q2 FY24, NII growth stood at 30.3% YoY.
Profit After Tax (PAT)
In Q3 FY24, PAT increased by 39.1% YoY, whereas on a standalone basis, it increased by 33.5% YoY and 2.5% QoQ; this was partly aided by a lower tax rate during the quarter owing to some tax write-back.
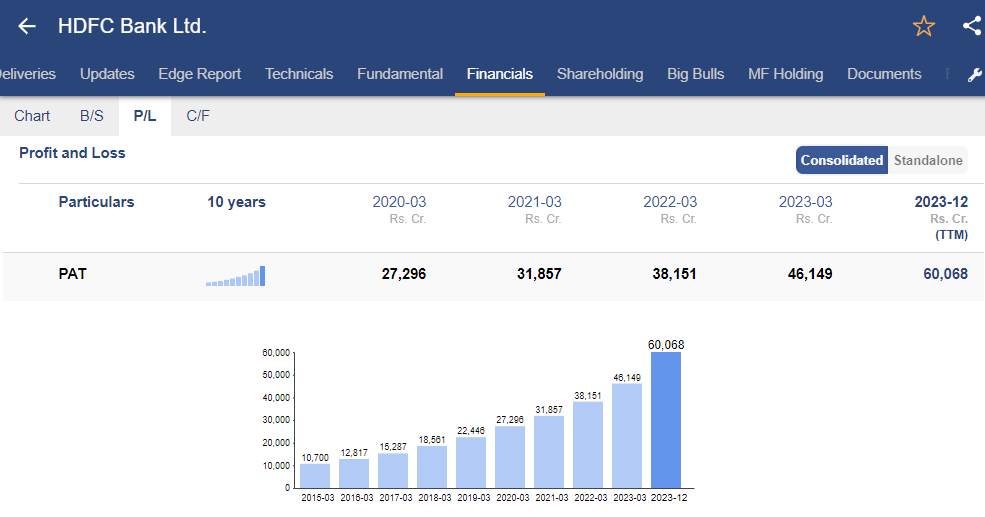
As you see, there is a consistent rising PAT of HDFC Bank over the years which shows the bank’s rising profitability.
Profitability of HDFC Bank
Net Interest Margin (NIM)
At this point of time, you all must have been in a doubt. If the bank’s financials are strong, why did HDFC Bank stock fall so badly?
Why did HDFC Bank fall post Q3 results?
The reason behind this NIM. A bank’s net interest margin (NIM) is a key indicator of the profitability of its core interest-earning activities. It is calculated as the percentage difference between the interest earned on loans and investments and the interest paid on deposits and other liabilities. A higher NIM suggests better profitability from lending and investing.
The bank’s core net interest margin (NIM) experienced a quarter-on-quarter decline of 25 basis points, dropping from 3.85% to 3.6%, attributed to the increased cost of deposits. However, HDFC Bank has kept NIMs at healthy levels of over 4% (average loan basis) mark in the past 5 years.
The decline of NIM for the bank was already expected after the merger of HDFC Ltd and HDFC Bank. The non-banking companies always have a higher cost of borrowing than banks. So, post-merger, the average cost of borrowing increased, and hence, there was a fall in NIM for the HDFC Bank.
Here is the overall trend of HDFC Bank NIM ratio over the years.
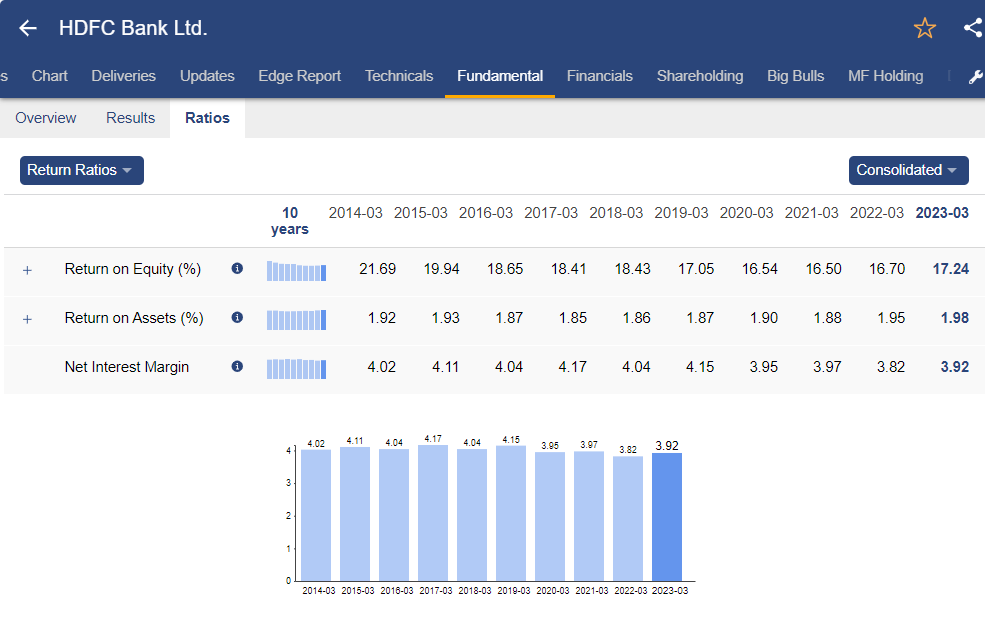
Track the net interest margin (NIM) ratio of HDFC Bank in StockEdge.
Yield on Advance
The yield on advances for a bank is the percentage of income generated from interest on loans in relation to the total value of the loans, indicating the profitability of the lending activities. A higher yield on advances signifies greater earnings from the loan portfolio.
The movement towards secured lending and better-rated corporates have impacted yields in FY22, but with the repricing of loans, yields are expected to pick up. The Yield on Advance for HDFC Bank stood at 10.10% for FY23.
Efficiency Of HDFC Bank
HDFC Bank stock analysis is not complete until its efficiency ratios are properly analyzed, you can analyze efficiency ratios and other ratios of HDFC Bank from StockEdge itself.
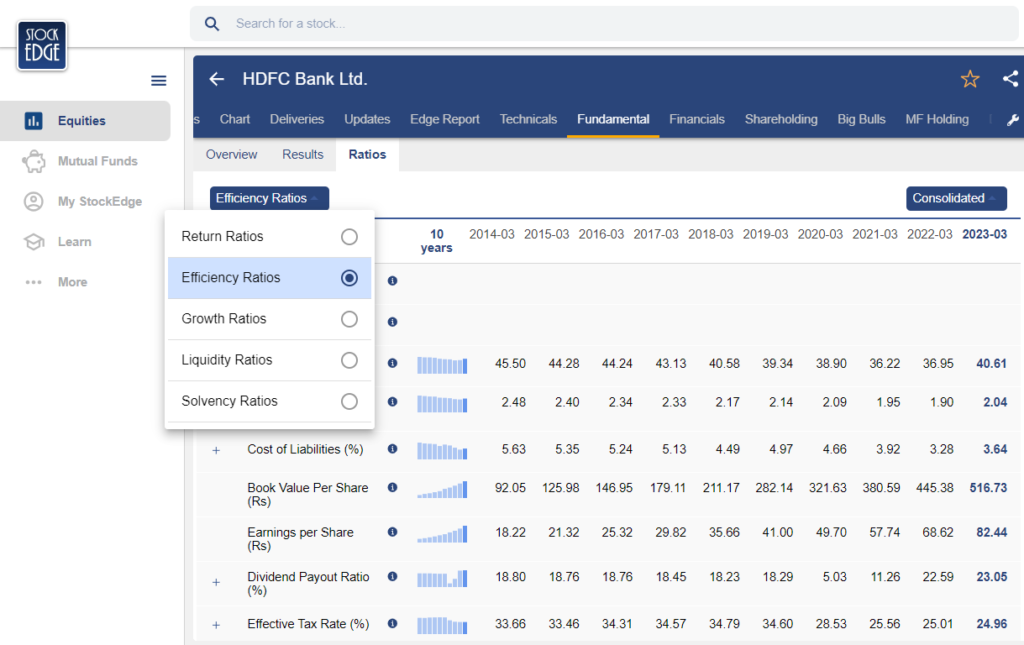
Cost to Income Ratio
The cost-to-income ratio is a tool to measure the efficiency of cost management in banks which is basically the percentage of operating expenses in relation to its total income. A lower cost-to-income ratio indicates better cost control and operational efficiency for the bank.
Nevertheless, it’s crucial to recognize that the cost-to-income ratio can fluctuate significantly due to the impact of gains and losses in the treasury. Meanwhile, HDFC Bank has observed a rise in the cost-to-income ratio attributed to network expansion and merger-related expenses. In the third quarter of FY 24, HDFC Bank disclosed a cost-to-income ratio of 40.3%, marking a slight decline of 10 bps from the preceding quarter.
Credit Cost
A bank’s credit cost shows the financial impact of credit risk and is an indicator of the costs related to potential loan defaults and non-performing assets.
The credit cost ratio for HDFC Bank was 0.49%. This is because the bank’s credit cost has continued to be lower than that of its comparable peers, which is an indirect indicator of improved asset quality performance.
Gross NPA & Net NPA (Non Performing Assets)
These are crucial indicators of a bank’s asset quality and financial health. Non-performing assets for a bank are the total value of loans that are not being repaid on time. So, the lower the ratios, the better it is for a bank. In Q3 FY24, the asset quality improved on a sequential basis as GNPA and NNPA ratios declined by 8 bps and 4 bps, respectively, to 1.26% and 0.31%.
Liquidity & Solvency of HDFC Bank
Credit – Deposits Ratio
The credit deposit ratio is the proportion of a bank’s loans relative to its total deposits, indicating the extent to which the bank utilizes its deposits for lending activities. A higher credit deposit ratio suggests a more aggressive lending approach by the bank and vice versa.
For HDFC Bank the ratio is generally around 85% levels however post merger this ratio has been on a higher side mainly on account of addition of over ₹6 lakh crore of loan book from HDFC ltd as compared to only ₹1.5 lakh crore addition of deposits.
CASA Ratio
HDFC Bank has a great liability profile with a CASA ratio of 38% as of December 2023. There was a fall in the CASA ratio mainly on account of the shift of deposits towards the term segment owing to better interest rates. Also, deposits coming in from HDFC Ltd. were term deposits only.
Capital Adequacy Ratio
HDFC Bank has always maintained a strong capital adequacy ratio and well above regulatory requirements. In Q3 FY24, HDFC Bank CRAR stands at 18.4%.
Valuation Of HDFC Bank
Price to Equity ratio (P/E) Ratio
The PE Ratio of HDFC Bank stock on TTM basis stands at 18.42, compared to the industry average PE of 18.32. It indicates HDFC Bank’s valuation is in line with the industry average.
Case Study on HDFC Bank Stock
We have a case study report prepared by our team of analysts. This fundamental report on HDFC Bank stock provides you with a detailed analysis of the company as well as how it stands among its competitors.
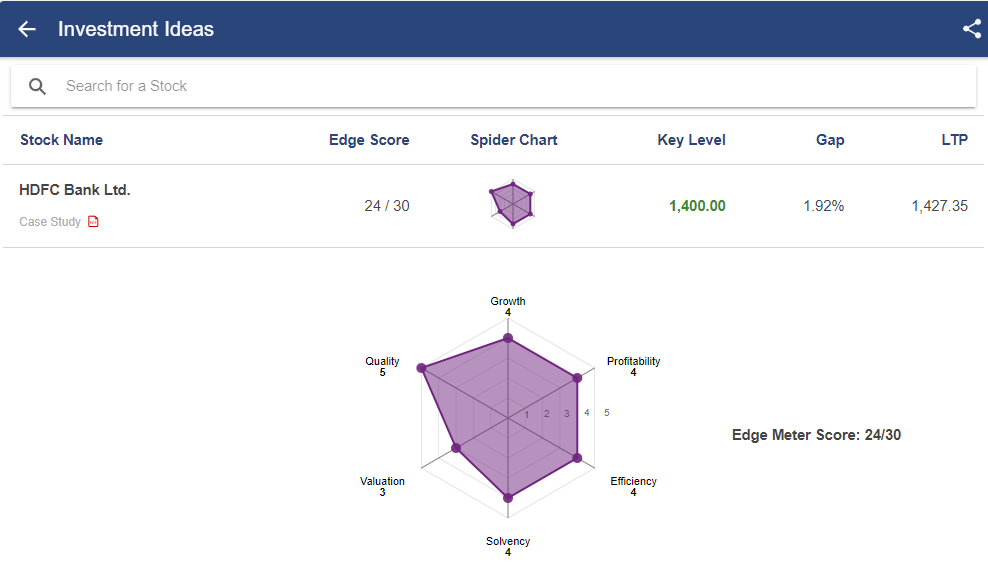
As you can see, HDFC Bank stock has rating based on 6 parameters:
- Growth
- Quality
- Profitability
- Efficiency
- Solvency
- Valuation
Based on the above parameters, HDFC Bank stock scored 24/30. Read the case study report on HDFC Bank stock.
Management Quality & Shareholding Pattern of HDFC Bank Stock
Currently Mr. Sashidhar Jagdishan is MD and CEO of the bank and has taken over the reigns from banking veteran Mr Aditya Puri.
Mr. Sashidhar Jagdishan has been with the bank for 24 years now.
Coming to the shareholding pattern of HDFC Bank stock, you can check it from the StockEdge App itself.
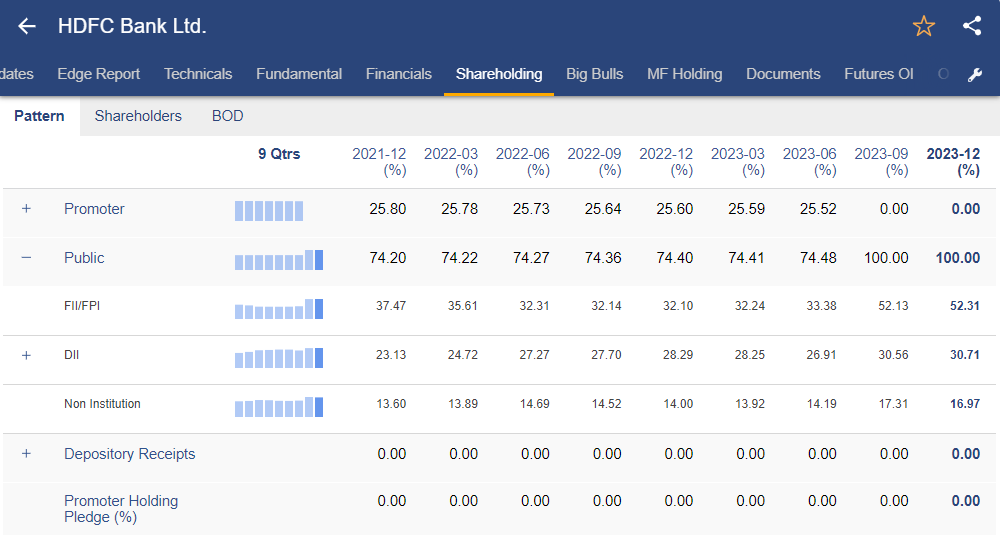
HDFC Bank has seen sharp rise in its stake from FII and DII owing to merger with HDFC ltd in Q2FY24 and holding steady in this quarter of Q3 FY 24 as well.
Future Outlook of HDFC Bank Stock
HDFC Bank is known to maintain strong operating metrics and has industry-leading performance on this parameter. Although NIMs have seen a moderation in the near term owing to changes in product mix and excess liquidity. It is expected to improve over the long term. Management expects the cost-to-income ratio to decline gradually to the mid-30s level.
Conclusion
The study on HDFC Bank stock analysis reveals a strong foundation marked by consistent growth in loans and deposits. Despite recent challenges affecting the stock price, the long-term potential remains promising, especially with the bank’s prudent management and robust financial performance.
To find other investing opportunity in the stock market, you can read our previous blog: Nestle India Stock Analysis: Hidden Potential for Investors
Happy Investing!


