Table of Contents
Key Takeaways
- Strong Brand Portfolio: Nestlé India boasts iconic brands like Maggi, Nescafé, KitKat, and Milkmaid, making it a household name across the country.
- Impressive Financials: Nestlé India showcases strong capital efficiency, low debt, and a premium market valuation driven by brand strength.
- Robust Management and Ownership: Led by Chairman and MD Suresh Narayanan, whose tenure was extended for five years in June. Nestlé S.A. holds a 62.76% stake, ensuring strong parent company support.
- Growth Potential in FMCG Sector: With India’s packaged food market valued at $100 billion, there’s significant room for growth, especially as the country transitions from unorganized to organized sectors.
- Stock Split and Accessibility: In January 2024, Nestlé India underwent its first-ever stock split in a 1:10 ratio, making shares more accessible to retail investors.
Do you love eating Maggi? You must be wondering what kind of a silly question this is: who doesn’t love Maggi? In 1983, Maggi, 2 minutes instant noodles, was introduced in India, and with the passing of time, it has now become a sentimental connection with people across generations in India. The company that introduced Maggi to India is Nestlé, a global leader in the Fast-Moving Consumer Goods (FMCG) sector, which is a Swiss multinational company with a rich history dating back to 1866.
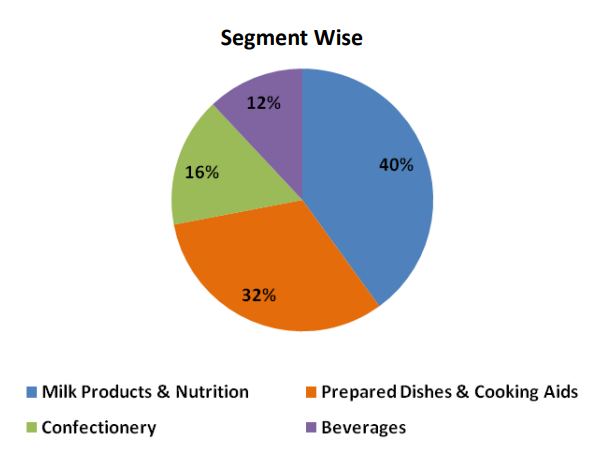
Its presence in the FMCG space spans various categories, including milk products and nutrition, beverages, cooked food and cooking aids, chocolates, and confectionery, as well as across geographies, including India.
The company was established in India in 1959, and Nestle India stock was listed in 1969 on the Bombay Stock Exchange (BSE). The share price of a company climbed from a few hundred rupees a share to ₹27000/share. Recently, Nestle India stock had its first-ever stock split in a 1:10 ratio and is currently trading at ₹2547/share as of 15th Jan 2024.
So, is it still worth investing in Nestle India stock post-stock split? Let’s find out.
Company Overview
Nestle India, currently headquartered in Gurgaon and its parent company Nestle S.A. of Switzerland, owns a 62.76% stake in the company. It is one of the world’s largest food and beverage players. It is one of the world’s largest food and beverage players often featuring as top gainers in the market.
A few of its prominent brands are Nescafe, Nestlè Everyday, Ceregrow, Nangrow, Maggi, Kitkat, Milkybar, Milkmaid, Milo, Nestea, Munch, Bar one, Polo, Nestle Milk and many more. Which one is your favorite?
Additionally, it is important to note the company follows the period of 1st January to 31st December as its financial year for the preparation of its financial statements.
The revenue mix of Nestle India for different product categories based on CY22 is shown below:
The company has a pan India presence with nine manufacturing facilities, four branch offices.
FMCG – Sectoral Outlook
The total Food & Beverages market size in India is valued at USD 800 bn. Of this, the packaged food market size is USD 100 bn, and the branded packaged market size is USD 40 bn. Hence, it has a vast scope for expansion. As of today, India is way behind in the packaged food industry, below China at 4.2x and other southeastern Asian countries like the Philippines at 3.3x, which suggests ample headroom for growth in the segment.
The transition from an unorganized to an organized segment in the sector is likely to continue in the coming years in India. Consumer trends and increasing salience towards the adoption of brands in small towns and villages have propelled the growth of FMCG companies.
Financial Highlights
Analyzing financial statements such as income statements, balance sheets, and cash flow statements helps investors assess the company’s ability to generate returns, manage debt, and sustain growth, enabling informed and prudent investment choices.
Income statement of Nestle India Ltd.
The income statement, commonly known as the profit and loss statement, gives you an understanding of its financial performance, such as its sales growth, profitability, etc.
At StockEdge, we have organized the income statement in a way that will help you analyze it with ease rather than going through the conventional way of downloading the documents from the stock exchanges, which could be time-consuming and tiresome to many.
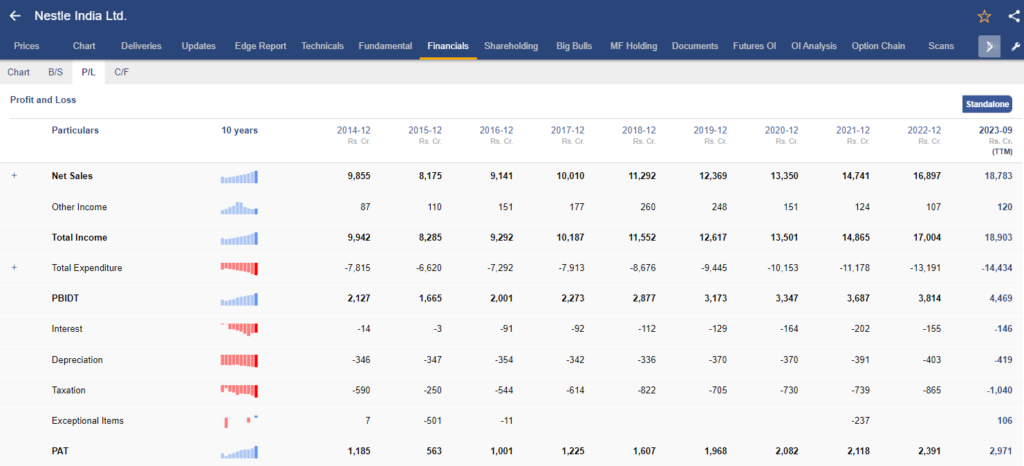
In the above image, you can see the annual income statement of Nestle India stock. Every detail is in front of your eyes, starting from the top-line sales figures to the bottom-line Net profit of the company.
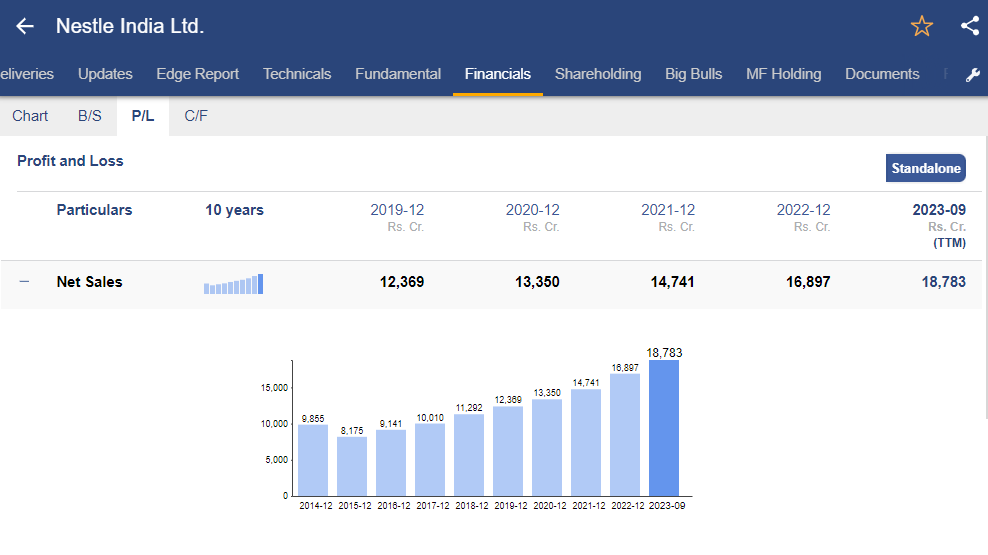
Sales Growth
In 9M CY23, net sales were ₹14,526 cr, a growth of 15 % YoY. Growth was broad-based and aided by pricing, volume, and product mix.
- Milk Products & Nutrition (+15 % YoY)
- Prepared Dishes & Cooking Aids (+11 % YoY)
- Confectionery (+21 % YoY)
- Powdered & Liquid Beverages (+19 % YoY)
EBITDA Growth
In 9M CY23, EBITDA was ₹ 3,376 cr, a growth of 23 % YoY. The cost environment is witnessing some softening, especially in the prices of edible oils and packaging materials & fuels. The management had stated that any cost headwind is likely to be mitigated through a combination of improving product mix.
PAT Growth
In 9M CY23, PAT was ₹2,343 cr, a growth of 33% YoY. PAT growth was aided by higher operating profit and an exceptional gain of ₹106 cr. Adjusted PAT growth for the period was 27% YoY.
Balance Sheet of Nestle India Ltd.
The balance sheet follows the accounting equation: Assets = Liabilities + Equity. It provides a company’s financial position, stability, and overall health.
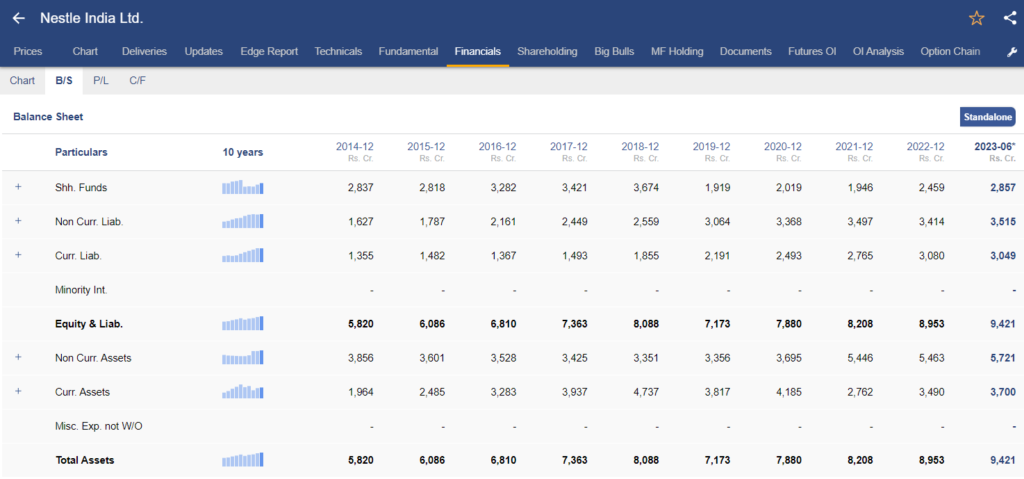
In the above image, you can see the balance sheet of Nestle India Ltd. It provides an overview of the financial position as on date. What are the assets and liabilities of the company? Liabilities of a company can be both short term and long term.
Nestle India continues to have a negligible amount of debt on its balance sheet for a very long time. As of H1 CY23, the company has only ₹29 cr of long-term debt compared to its total fixed assets of ₹3238 cr.
Cash Flow Statement of Nestle India Ltd.
A cash flow statement provides a summary of how a company generates and uses cash over a specific period of time. It has three different sections:
- Operating cash flow statement
- Financing cash flow statement
- Investing cash flow statement
Out of these the most important one being the cash flow from operations as it provides you with an understanding of how the company generated cash from its core business operations. A positive cash flow from operation signifies that the company has generated higher cash revenue than its expenditure.
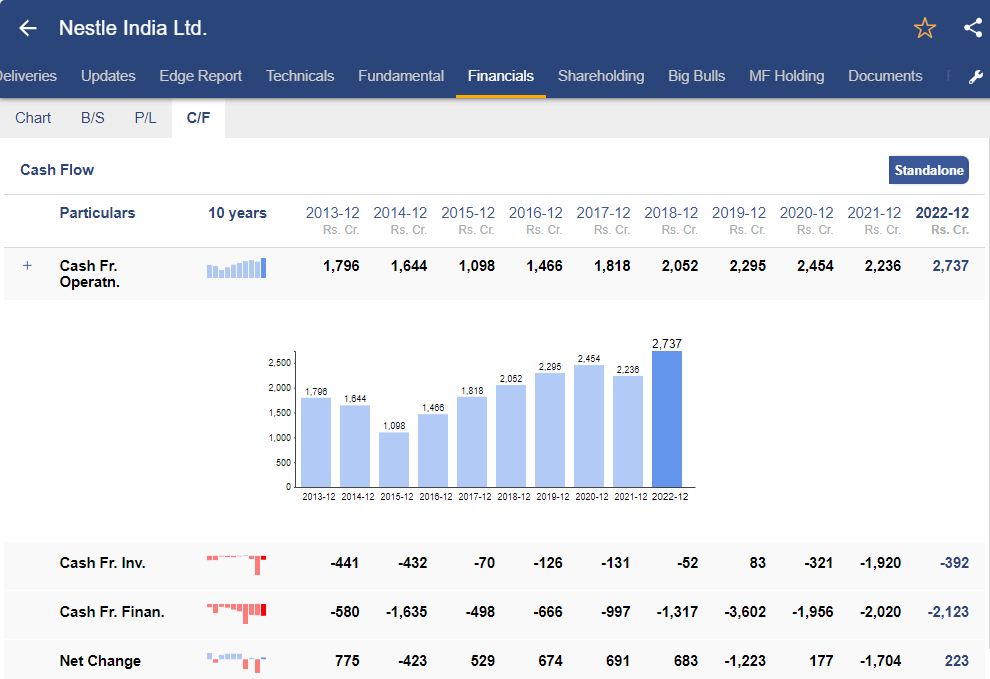
In CY22, Nestle India reported a cash flow from operations amounting to ₹2,737 crore, a notable increase compared to the previous year’s figure of ₹2,236 crore. This improvement can be attributed to enhanced operating profit and effective working capital adjustments.
In investing activities, there was a significant decrease in cash outflow, amounting to ₹392 crore, as opposed to the previous year’s outflow of ₹1,920 crore. This is due to a decrease in substantial investments made by the company in the prior year.
The cash outflow in financing activities at ₹2,123 crore, majorly due to dividend payment of ₹2,025 crore. This indicates the company’s commitment to returning value to its shareholders through dividend distribution.
Overall, the company’s cash flow dynamics in CY22 reflect a positive trend in operating performance.
Ratio Analysis of Nestle India Stock
Ratio analysis of a company involves evaluating a company’s financial performance by examining certain ratios which are derived from its financial statements. It makes easy comparing the financial performance to its industry benchmarks or competitors.
Ratio has different classifications like profitability ratios, solvency ratios, return ratios and more as you can see in the image below, you can analyze all such ratios directly from StockEdge.
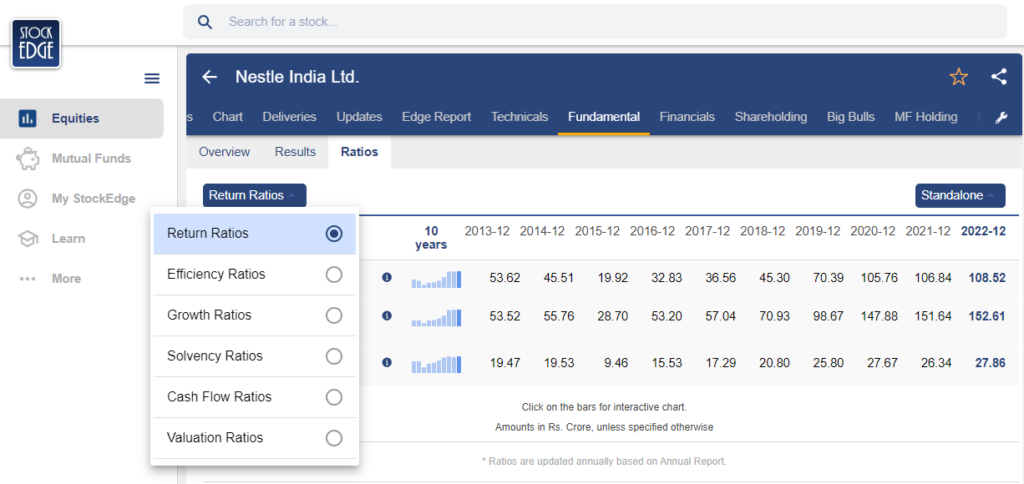
Here are the return ratios of the Nestle India stock, starting with the two most important ratios which are ROE and ROCE.
What is ROE and ROCE?
ROE is a profitability ratio that measures the company’s ability to generate net income as a percentage of shareholders’ equity, whereas ROCE assesses the efficiency of a company in utilizing its total capital, including both equity and debt.
Return on Equity (ROE)
In CY22, ROE was 108.52%. The metric saw improvement compared to last year, as in CY21, it incurred an exceptional expense of ₹236.5 cr.
Return on Capital Employed (ROCE)
In CY22, ROCE was 152.61% v/s 151.64% in CY21. During the period, the company could report improved operating profit despite the prevailing inflationary trend witnessed in the input costs.
Debt to Equity Ratio (D/E Ratio)
The company has negligible amount of debt in its balance sheet so the D/E ratio stands at 0.1.
Price to Equity Ratio
Presently, Nestle India is valued at a trailing twelve-month (TTM) price-to-earnings (PE) multiple of 83.53x. This high valuation is reflective of the market’s recognition of the company’s robust brand presence, often referred to as a “moat,” particularly in the packaged food sector.
Management Quality & Shareholding Pattern
Suresh Narayanan, the company’s chairman and managing director, was given a five-year extension to his contract in June. The management’s main focus remains on expanding market penetration and attaining volume growth, especially in its core product line.
Coming to the shareholding pattern of Nestle India stock, you can check it from the StockEdge App itself.
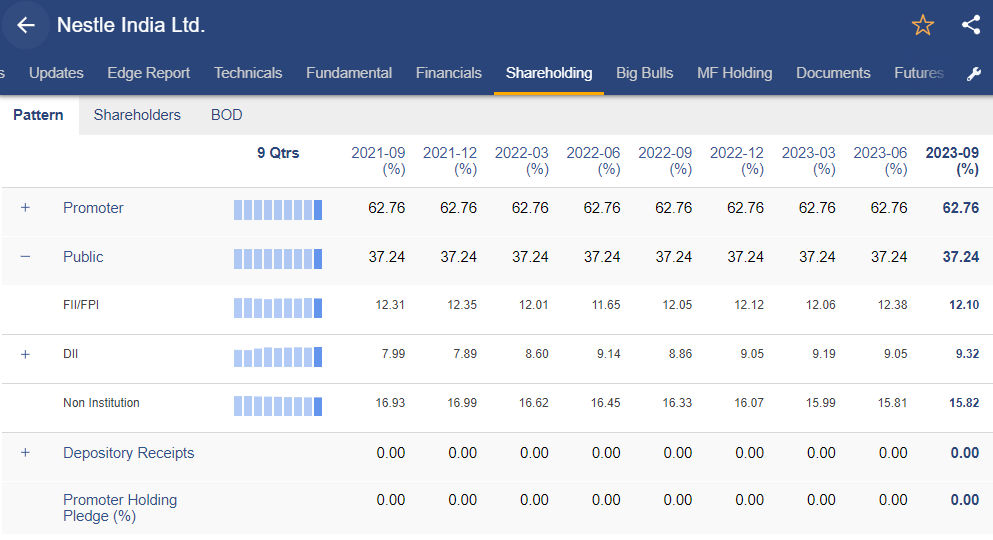
Nestle India’s ownership structure has proven stable, with the promoter keeping a steady 62.76% stake over an extended period of time.
Noteworthy adjustments in investor positions have been observed, as the FII (Foreign Institutional Investor) stake saw a decline from 12.38% in the second quarter of CY23 to 12.10% in the third quarter, while the DII (Domestic Institutional Investor) stake witnessed an increase from 9.05% to 9.32% during the same period.
These alterations reflect an evolving investor interest in Nestle India stock, with FIIs and DIIs making strategic adjustments to their holdings. In contrast, the promoter’s stake remains unwavering, underscoring a consistent and steadfast commitment to the company.
Future Outlook of Nestle India Stock
Nestle India’s achievements are rooted in a strong amalgamation of elements, encompassing a formidable brand presence, a varied product lineup, an expansive distribution network, and the utilization of exclusive technology from its parent corporation. This is further supported by substantial research and development capabilities.
The company is strategically leveraging these strengths to enhance its presence in the e-commerce landscape, with a particular emphasis on hyperlocal (quick commerce) channels. E-commerce, contributing to 6.1% of quarterly sales, has experienced a 20% growth in the first three-quarters of CY23, driven by quick commerce.
Nestle India’s strategic focus remains on core categories such as milk & nutrition, chocolates & confectionery, and coffee & beverages, aiming to capitalize on growth and expansion opportunities within these segments. Key brands like Nescafé, Kitkat, Everyday, Maggi noodles, and Masala-AeMagic continue to play a pivotal role as significant growth drivers.
The company is actively pursuing rural expansion, with rural sales presently contributing around 20%-25% to overall domestic sales. Nestle India plans to intensify its efforts in rural areas, emphasizing capacity expansion and introducing new products to cater to the unique needs and preferences of the rural consumer base. This holistic approach highlights Nestle India’s dedication to ongoing growth, continuous innovation, and an expanded footprint in the market.
Case Study on Nestle India Stock
We have a case study report prepared by our team of analysts. This fundamental report on Nestle India stock provides you with a detailed analysis of the company as well as how it stands among its competitors.
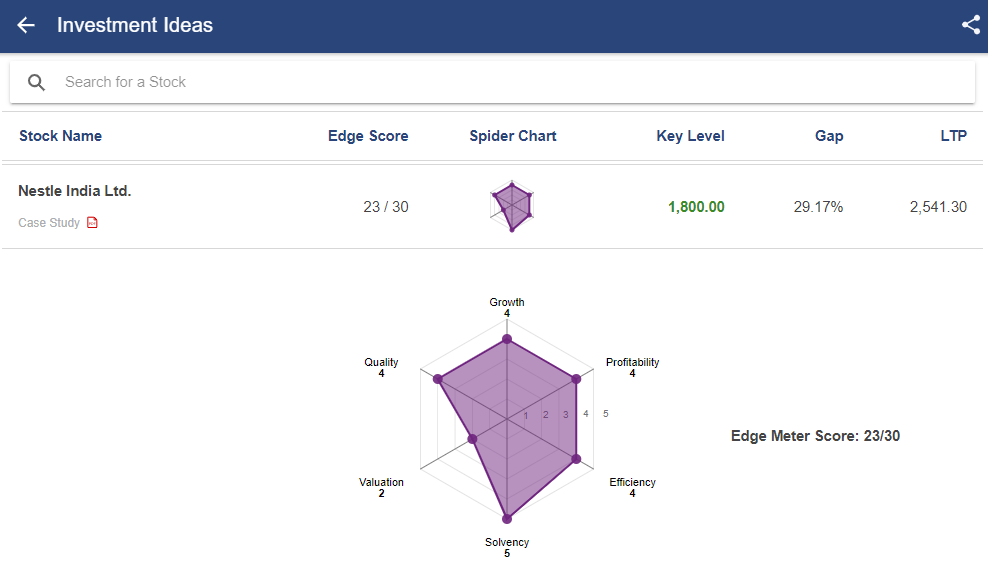
As you can see, Nestle India stock has rating based on 6 parameters:
- Growth
- Quality
- Profitability
- Efficiency
- Solvency
- Valuation
Based on the above parameters, Nestle India stock scored 23/30. Read the case study report on Nestle India stock.
Conclusion
In conclusion, Nestle India emerges as a compelling investment opportunity for several reasons. The company’s steadfast focus on core categories, bolstered by a strong brand presence and diversified product mix, positions it well for sustained growth. Utilizing the exclusive technology from its parent company and having strong research and development capabilities further strengthens Nestle India’s competitive advantage. The strategic emphasis on expanding e-commerce channels, particularly in the quick commerce segment, aligns with evolving consumer trends.
Additionally, the company’s commitment to rural expansion, new product launches, and continuous innovation underscores its proactive approach to tapping into diverse market segments. With a proven track record, consistent financial performance, and a visionary growth strategy, Nestle India presents itself as an attractive prospect for investors seeking a reliable and resilient investment in the FMCG sector.
Apart from Nestle India stock, there are other stocks which are part of the Nifty 50 index. Read this blog All About NIFTY50, Components of NIFTY50, and How to Invest in it.
Happy Investing!
Which company introduced Maggie in India?
Nestle India introduced the iconic 2 minute instant noodles in India.
When did Nestle established in India?
Nestlé, a global leader in the Fast-Moving Consumer Goods (FMCG) sector, is a Swiss multinational company that established itself in India in the year 1959.
When was Nestle India stock listed in the stock exchanges?
Nestle India stock was listed in 1969 on the Bombay Stock Exchange (BSE).


