Table of Contents
Today, we are here to discuss a powerhouse that’s been leading the Indian health and wellness market for over 139 years – none other than Dabur India Ltd. Headquartered in Ghaziabad, Dabur Stock has been an iconic company, and every Indian household is familiar with one or more Dabur products. Incorporated in 1884, Dr. S.K. Burman in Kolkata founded Dabur India to produce and distribute natural ayurvedic medicines for treating diseases such as cholera, malaria, and plague.
Today Dabur Stock is the world’s largest Ayurvedic and Natural Health Care company. Dabur India Ltd. was named from the initials of his popular address, ‘Daktar Burman‘.
Dabur Stock has garnered immense brand loyalty due to decades of trust and reliance on its exceptional products by consumers. The latest advertising slogan for the company, “Ye Bharat Hai Humara, Ye Dabur Hai Hamara,” articulates the enduring popularity of this brand among the Indian people. On a daily basis, the Dabur brand enriches the lives of billions by harmonising ancient Ayurvedic wisdom with contemporary scientific innovation.
Dabur India’s strong heritage in Ayurveda and focus on natural ingredients gives them a leading edge in the growing health and wellness market. Their knack for innovation opens up new opportunities for them to capitalize on changing consumer lifestyles. Dabur India is not just about healthcare. It also has strong positioning in various categories such as fruit juices as well as oral care and hair care, all of which have natural/Ayurveda at its heart. No wonder they’re a leader in multiple categories.
These factors made Dabur Stock an attractive investment choice.
Dabur Stock was listed on the stock exchanges in 1999 and over the last 10 years, it has given an annualised return of 12%. As on date 9th Jan 24; the Dabur Stock traded at ₹548 per share.
To further determine if the Dabur Stock is still attractive or not, we will examine its current financial status in today’s blog.
Dabur India Ltd. – Company Overview
Dabur is the 4th largest FMCG company in India and its key consumer products categories include Hair Care, Oral Care, Health Care, Skin Care, Home Care and Foods. The company launched a fruit drink named Real during 1996-97, which has further strengthened its brand presence in the food products market. Dabur’s power brands include Dabur Chyawanprash, Dabur Honey, Dabur Lal Tail, Dabur Honitus, Dabur Pudin Hara, Dabur Red Paste, Dabur Amla Hair Oil, Vatika, and Real Fruit Juice.
Dabur possesses an extensive distribution system with a substantial presence in both urban and rural markets. Additionally, the company has a significant international presence in nine different countries such as the Middle East, North America, and SAARC, contributing about 25% of its total revenue.
In FY23, Dabur Stock invested ₹481 million in cash to acquire a 51% stake in Badshah Masala Private Limited. The strategic motivation behind this acquisition was to strengthen its brand presence both domestically and internationally by tapping into the swiftly expanding market of blended spices.
Revenue-Mix of Dabur Stock
In the intricate landscape of corporate finance, very few entities command as much attention and respect as Dabur India Ltd. The company has an extensive product portfolio comprising a vast array of products across various FMCG categories.

The above image shows the robust product categories across Dabur’s India business. In FY23, the company launched 25 new products, 9 of which were in the Home and Personal Care category, 13 in the Healthcare segment, and 3 in the Food and Beverage division. Let’s have a look at the revenue structure of the company:

Dabur Stock derives almost 71% of its revenue from its Indian business, prompting the company to continually evolve and align with the dynamic demographics of the country. The company is rebranding its core brands for India’s younger generation by making them more relevant through fresh formats and appealing packaging.
Sector Outlook – FMCG
In the competitive FMCG landscape, Dabur Stock has consistently demonstrated its commitment to quality, innovation, and consumer satisfaction. Before investing in a company, it is critical to have a thorough understanding of its industry dynamics. So, let’s have a look at India’s FMCG industry.
The FMCG industry is the fourth-largest sector in the Indian economy. The sector is categorised into three major segments: (a) household and personal care, which accounts for 50% of the industry, (b) healthcare accounts for 31%, and (c) food and drinks contributes to 19% of the industry.
The surge in demand for immune-boosting products during the COVID-19 pandemic has driven consumers towards healthier choices, favouring organic and superfood-based options across diverse FMCG categories. In response, companies are introducing products that align with the heightened awareness of health and wellness.
Increasing health consciousness and awareness of the drawbacks of Western medications are driving a surge in consumer preference for Ayurvedic products, with a growing distribution network enhancing accessibility in both urban and rural areas.
The Indian FMCG industry had experienced volume impact due to rising inflation from disrupted supply chains and increased costs, attributed to calibrated price hikes amid broader economic challenges, including demonetization and GST implementation over the last few years.
Financial Highlights of Dabur Stock
“Know what you own, and why you own it.” The famous quote by Peter Lynch on stock investing says that you should know how the company is faring in the finance field before investing your money in it. To know the financial background of Dabur Stock, we must analyse its financial statement.
There are three types of financial statements: income statements, balance sheets, and cash flow statements.
Income statement of Dabur Stock
The income statement, also known as the profit and loss statement, provides information about the company’s financial performance, such as sales growth, profitability, and so on.
At StockEdge, we have organised the income statement in such a way that you can easily analyse it rather than going through the traditional and time-consuming method of obtaining the documents from the stock exchanges.

In the above image, you can see the annual income statement of Dabur Stock. Everything you need to see is right there, from the company’s top-line sales numbers to its bottom-line net profit.
Sales Growth
In FY23, the company achieved revenue of ₹11,530 cr, with net sales growth of 6% YoY and a CAGR of 8.3% over the last five years. The food and beverage division experienced accelerated growth following the integration of the Badshah masala business, a move finalised in the fourth quarter of FY23. In FY23, Dabur Stock’s food and beverage vertical, including Badshah business gained approximately 34% year-on-year.

EBITDA Growth
Earnings before interest taxes depreciation and amortization, commonly referred to as EBITDA of the company stood at ₹2,164 cr in FY23 which shows decline of 4% on YoY basis. The company faced an upward trajectory in input costs, primarily in the food and beverage sector, and the redemption of media expenditures, leading to moderate growth in EBITDA.
PAT Growth
The bottom-line growth, illustrated by the Profit After Tax (PAT), stands as a crucial measure of a company’s financial well-being and operational success. PAT decreased by 2% YoY to ₹1,703 cr in FY23 due to an operating profit contraction during the year.
Balance Sheet of Dabur Stock
A balance sheet provides a reference document that offers an overview of the organization’s financial well-being. It empowers individuals to assess the liquidity of the company by comparing current assets and liabilities, as well as to compute the rate of return generated by the company.

In the above image, you can see the balance sheet of Dabur Stock. It provides an overview of the financial position as of date. What are the assets and liabilities of the company? Liabilities of a company can be both short-term and long-term. Here the company had long-term borrowings of ₹299 cr, compared to its fixed assets of ₹3,754 cr in FY23.
Cash Flow statement of Dabur Stock
The cash flow statement summarises Dabur Stock’s cash inflows and outflows, assessing its capacity to manage cash responsibly, meet debt obligations, and fund operational costs, making it a key component among the three primary financial statements alongside the income statement and balance sheet.
The major components of the cash flow statement are:
- Cash flow from operating activities
- Cash flow from investing activities
- Cash flow from financing activities

Cash flow from operations is the most essential of them since it explains how the company generates cash from its primary business operations. A positive cash flow from operations indicates that the company generated more cash revenue than it spent during the period.

During FY23, cash flow from operations decreased by 17.4% year-over-year to ₹1,488 cr. This was due to a substantial increase in current assets, including investments, trade receivables, and inventories.
The company’s investing activity results in a net cash outflow of ₹587 cr from investing operations, mainly due to the purchase of property, plant, and equipment. A negative cash flow from investing operations indicates that the company is investing in assets for future growth.
Finally, the cash outflow from financing activities was ₹1,035 cr, primarily due to dividend payments.
Ratio Analysis of Dabur Stock
Ratio analysis, a vital aspect of fundamental equity analysis, involves reviewing financial documents like the balance sheet and income statement to gain valuable insights into a company’s liquidity, operational efficiency, and profitability.
Ratios are classified into several types, including profitability ratios, solvency ratios, return ratios, and more, as shown in the graphic below. In order to evaluate all of these financial ratios straight from StockEdge

The return ratios of Dabur Stock are as follows, beginning with the two most crucial ratios: ROE and ROCE.
What is ROE and ROCE?
ROE reflects a company’s ability to generate income efficiently, where higher values signal effective equity leverage for growth. On the other hand, ROCE evaluates profit efficiency as a percentage of total capital employed, providing stakeholders with insights into effective capital utilisation.
Return on Equity (ROE)
Dabur India is actively looking for ways to lower borrowing expenses and increase investment returns, all while sticking to safe and cautious financial practices, focusing on safety, liquidity, and returns. The increased use of e-commerce platforms to boost premiumization and rising investment in strong brands will aid the company’s operating profit and ROE growth. Due to a decrease in net profit in FY23, the ROE of Dabur Stock declined to 19.8% from 22.1% in FY22.
Return on Capital Employed (ROCE)
Dabur Stock’s ROCE ratio declined to 23.9% in FY23 from 26.7% in FY22 owing to decline in profitability. Moreover, the company is constantly expanding into new categories in order to expand its core business and enhance demand in existing areas, reviving volume growth across its portfolio.
Debt to Equity Ratio
The Debt-to-Equity Ratio is a financial indicator that measures a company’s leverage by comparing total debt to shareholders’ equity. In FY23, Dabur Stock had a low debt-equity ratio of 0.11x. The company plans to fund its capital expenditures mostly through internal accruals. As of September 30, 2023, the company has ₹542 million in short-term debt and ₹769 million in long-term debt.
Price to equity (P/E) Ratio
The Price-to-Earnings Ratio (P/E) is a financial metric that compares a company’s current stock price to its earnings per share (EPS). Dabur Stock had a PE ratio of 53.54x as of September 2023, which is in line with the industry average.
Management Quality & Shareholding Pattern of Dabur Stock
Analyzing the Shareholding Pattern unveils insights into the benefits and risks tied to an entity’s ownership structure. Evaluating management quality is essential for investment decisions, as financial results alone may not offer a comprehensive understanding of the company. Warren Buffett has frequently emphasized the significance of a company’s management quality and expressed his preference for businesses run by competent and trustworthy leadership.
Throughout the challenging pandemic period, Dabur Stock’s management showcased agility and responsiveness by adjusting to evolving market conditions. They achieved this through a streamlined portfolio and updated positioning, aligning with the rising demands of their consumers.
You may see the shareholding pattern of Dabur Stock directly from the StockEdge App.

As you can see, promoters’ ownership in the company has largely remained stable at 66.23% over the first two quarters of FY24, which indicates a strong promoter’s investment in Dabur Stock. In comparison, DIIs boosted their interest from 8.37% in Q4 FY23 to 8.81% in Q1 FY24 and 9.86% in Q2 FY24. A sustained increase in DII stakes mostly indicates a healthy outlook for the company. The FII’s also held a healthy stake of 18.37% in Dabur Stock as of September 2023.
Future Outlook of Dabur Stock
Dabur Stock seeks to focus on its key brands by strategic investments aimed at increasing visibility, expanding distribution, and accelerating innovation through the introduction of new products and variants. By FY23, Dabur Stock has expanded its direct reach to 1.4 million outlets, reached 1,00,000 villages in the rural sector from 60,000 in FY22, and intends to grow it further in the future.
In order to boost profitability in other geographies, the company is strengthening its footprint and increasing its distribution network. As a result, management is optimistic about maintaining double-digit growth in its international business. The company intends to continue innovating and launching a range of Ayurveda-based products in modern, easy-to-use formats. Since healthcare is the most margin-accretive segment, Dabur Stock is intending to structurally shift the focus of its product portfolio from the home and personal categories to the healthcare segment.
Moreover, the company is planning to foray into the sanitary napkin business to compete with Procter & Gamble and Johnson & Johnson and has also initiated its footprints in the branded spices and seasoning category by acquiring the Badshah spice brand.
The management is cautious about the price hike to mitigate the inflationary trends due to the weak demand scenario and therefore will strategically increase the prices. Despite incurring legal expenditures in H1 FY24, the management expects margin expansion across categories and maintains their overall operating margin guidance of 19% in FY24.
Furthermore, in order to expand engagement with millennials and Generation Z, each of Dabur Stock’s brands places a particular emphasis on its digital channel, which accounted for approximately 6% of sales in FY23. Eventually, the company’s e-commerce revenue contribution is estimated to reach 19%-20% by FY27.
Case Study of Dabur Stock
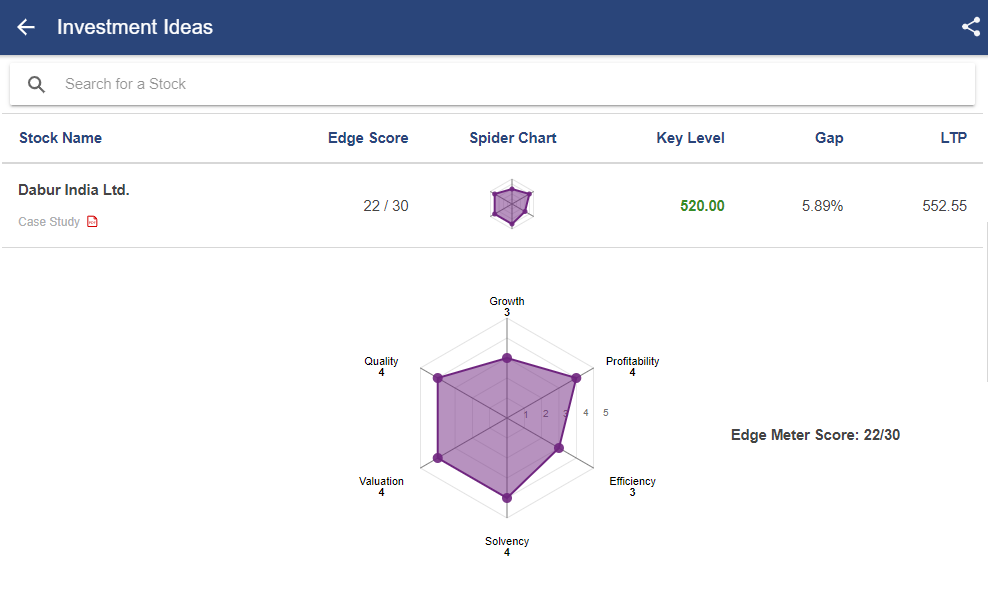
Our group of analysts has compiled a case study report on Dabur Stock. This report presents a detailed fundamental analysis of Dabur Stock, in addition to a comparison of its position with respect to its competitors.

As you can see, Dabur Stock have rating based on 6 parameters:
- Growth
- Quality
- Profitability
- Efficiency
- Solvency
- Valuation
Based on the above parameters, Dabur Stock scored 22/30. Read the case study report here.
Conclusion
Renowned for its commitment to Ayurveda and holistic wellness, Dabur Stock has not only etched its mark in the hearts of millions but has also developed a robust revenue portfolio. In addition to that, the recent acquisition of Badshah Masala by Dabur has successfully increased the company’s market share in the blended spice industry.
Sustained efforts towards innovation, advertising, strategic pricing, and expanding market presence via e-commerce platforms would contribute to the increment and retention of market share for the company. Moreover, with continual development through new and innovative products, expanding into newer markets and leveraging consumer sentiment and behaviour to maximise premiumization will help the company meet demand even more effectively. The future growth and diversification plan of Dabur Stock are equally promising and have created a healthy outlook for investors.
Happy Investing!


