Table of Contents
“Har ghar kuch kehta hai” is the iconic tagline of Asian Paints, India’s largest paint manufacturer. Undoubtedly, you are familiar with Asian Paints, renowned for its extensive range of decorative paints catering to both domestic and international markets. Painting homes during Diwali or any festive occasion has become a tradition, and when it comes to paints, Asian Paints is the first name that springs to mind. The company has consistently demonstrated its position as one of the premier paint manufacturers in the country.
While buying decorative paints from Asian Paints simply because they are the best! Why not invest in Asian Paints stock?
Do you know the company has been manufacturing paints even before the country’s independence in 1942? However, the company was listed on the stock exchanges in 1994 and over the last 10 years, its stocks have given a return of more than 500% and a CAGR of 20% in 10 years. As on date 27th Nov 23; the Asian Paints stock price trades at ₹3136 per share.
Additionally, Asian Paints stock is part of the Nifty 50 index. To find out the list of stocks that are part of Nifty 50 click here.
In today’s blog, we are going to analyze the company’s current financial position to find out if it is still a good stock to invest in or if it has lost its charm.
Asian Paints Ltd. – Company Overview
Asian Paints Ltd, a Mumbai-based Indian multinational paint company, is one of the key players in the paint industry. The company is renowned for its expertise in producing a wide variety of paints for both decorative and industrial applications.
Within the realm of decorative paints, Asian Paints offers an extensive portfolio covering interior and exterior wall finishes, adhesives, waterproofing solutions, undercoats, enamels, and wood finishes. In the industrial segment, Asian Paints offers paints for automotive, marine, and packaging coatings. Additionally, the company also manufactures protective coatings, powder coatings, floor coatings, and road marking for industrial applications.
The company boasts an impressive in-house decorative paint manufacturing capacity of 17,30,000 kilo-liters per annum in India, supported by 27 in-house paint manufacturing facilities globally. With a widespread presence, Asian Paints reaches approximately 1,60,000 touch points across India.
Revenue-Mix of Asian Paints
The company has a vast product portfolio of both commercial and industrial paints for domestic and international markets. Let’s take a look at the company’s revenue structure:
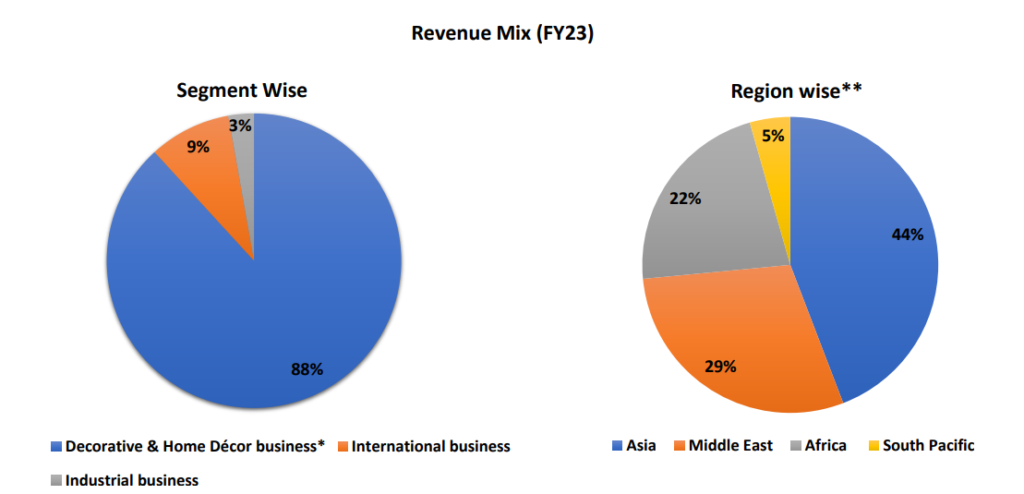
As you can see, the majority of the company’s revenue comes from decorative paints and home decor businesses. However, please note that as Asian Paints recently entered into the home decor business, the revenue contribution only stands at 4% of the overall decorative paint business as of FY23.
Sector Outlook – Paints
Before delving into the financial highlights of Asian Paints, let’s understand the overall sector. It is essential to have a deep understanding of the dynamics of the industry before investing in a stock of that sector. So, without further ado, let’s start with an overview of India’s paint industry.
The domestic paint industry, comprising both the decorative and industrial paint segments, is valued at over ₹70,000 crore. Approximately 75% of this market is attributed to the decorative paint segment, while the industrial paint segment accounts for the remaining 25%. Projections indicate that the Indian paint industry is anticipated to expand, reaching a market size of ₹1,00,000 crore within the next five years. Moreover, the Indian paint industry has been witnessing a gradual shift in customers’ preferences from traditional whitewash to high-quality paints like emulsions and enamel paints, which is providing the basic stability for the growth of the overall sector. Additional measures from the government to make houses affordable would aid the decorative paint demand in future.
The growth of the paint market in India is fueled by key factors such as an increase in the disposable income of the average middle class, swift urbanization, and the introduction of innovative products. These innovations include paints that are environmentally friendly, odor-free, and resistant to dust and water, contributing significantly to the market’s expansion.
One more factor that could drive the overall sector is weakening crude oil prices. It is an essential component in producing paints, and the weakening of crude oil prices can be beneficial for the paint industry.
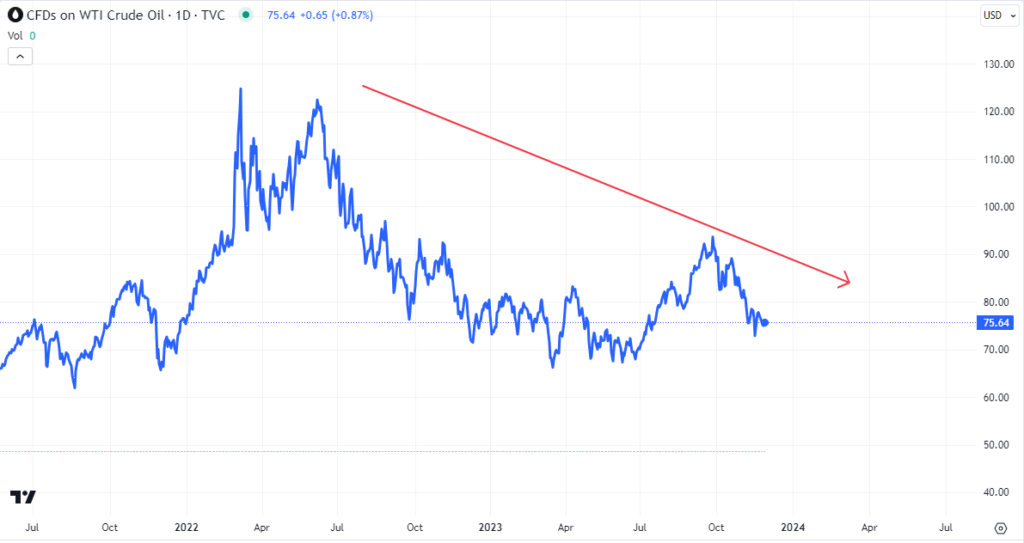
As you can see, in the chart of WTI crude, it is down by almost 40% from its peak of $125 per barrel to $75 per barrel.
Financial Highlights
“Price is what you pay, value is what you get” by Warren Buffett
This is a very famous quote in the stock market: while you are investing in stocks, you are paying their current market price, which is essentially the share price, but to find out the actual value or if it is worth investing in that stock, you must analyze the financial statement of the company.
Basically, there are three financial statements: income statement, balance sheet and cash flow statements.
Income statement of Asian Paints
The income statement, commonly known as the profit and loss statement, gives you an understanding of its financial performance, such as its sales growth, profitability, etc.
At StockEdge, we have organized the income statement in a way that will help you analyze it with ease rather than going through the conventional way of downloading the documents from the stock exchanges, which could be time-consuming and tiresome to many.
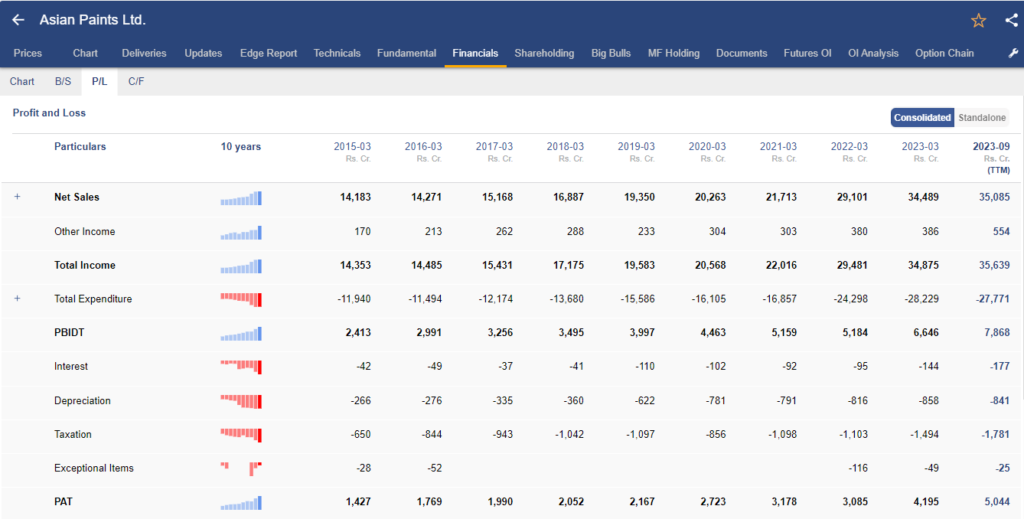
In the above image, you can see the annual income statement of Asian Paints. Every detail is in front of your eyes, starting from the top-line sales figures to the bottom-line Net profit of the company.
Sales Growth
In FY23 , the company achieved revenue of ₹34 ,489 cr, with net sales growth of 18.5 % YoY. The decorative volume growth was 14 % YoY.
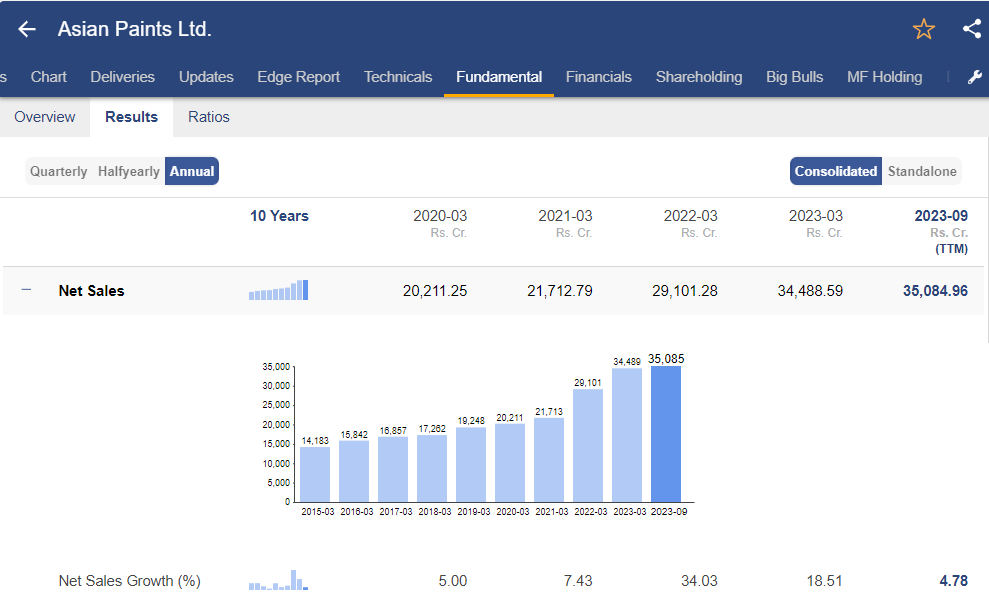
The international business experienced a year-on-year growth of 6.2%, although business conditions posed challenges in Asian nations. In contrast, the African and Middle East markets saw robust double-digit growth. The home improvement sector similarly achieved a double-digit growth rate.
EBITDA Growth
Earning before interest taxes depreciation and amortization, commonly referred to as EBITDA of the company stood at ₹6,260 cr, a growth of 30% YoY in FY23, which was largely attributable to the growth in the top-line.
PAT Growth
Bottom-line growth, as exemplified by the Profit After Tax (PAT) is a pivotal indicator of a company’s financial health and operational success. Asian Paints recorded a PAT of ₹4,101 crores in FY23. Additionally, robust 34% Year-over-Year (YoY) growth in PAT underscores the company’s ability to not only generate increased revenue but also to manage its expenses effectively.
Balance Sheet of Asian Paints
The balance sheet follows the accounting equation: Assets = Liabilities + Equity. It provides a company’s financial position, stability, and overall health.
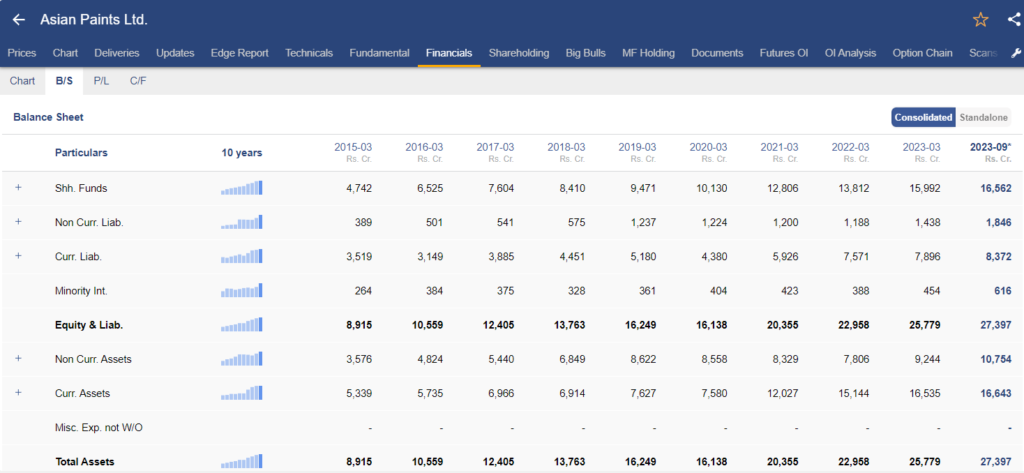
In the above image, you can see the balance sheet of Asian paints. It provides an overview of the financial position as on date. What are the assets and liabilities of the company? Liabilities of a company can be both short term and long term. Here Asian Paints have long term liabilities of 76 cr, compared to its fixed assets of 6790 cr in FY23.
A prudent company will always have a reasonable level of debt relative to their fixed assets.
Cash Flow statement of Asian Paints
A cash flow statement provides a summary of how a company generates and uses cash over a specific period of time. It has three different sections:
- Operating cash flow statement
- Financing cash flow statement
- Investing cash flow statement
Out of these the most important one being the cash flow from operations as it provides you with an understanding of how the company generated cash from its core business operations. A positive cash flow from operation signifies that the company has generated higher cash revenue than its expenditure.
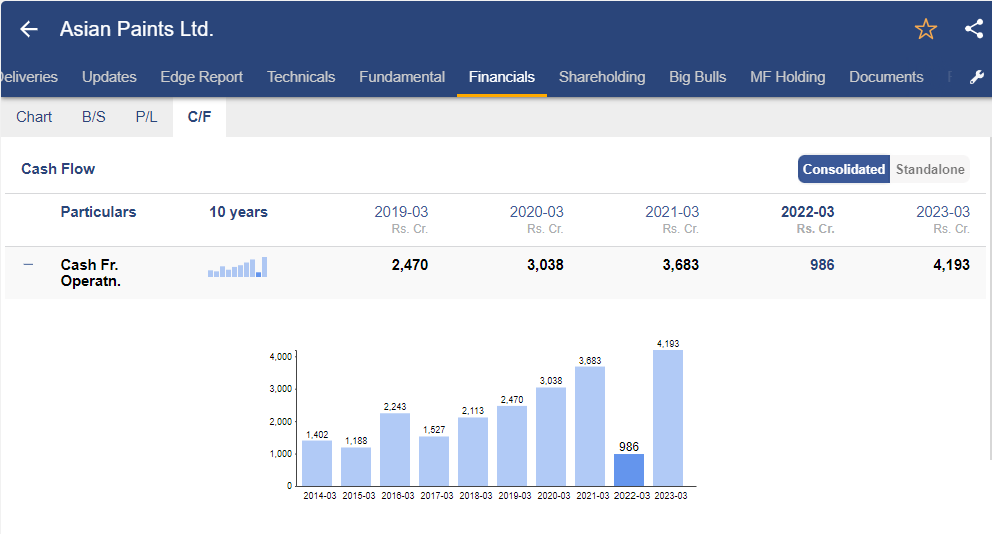
In the fiscal year 2023, the company recorded a cash flow of ₹4,193 crores. The year-over-year increase in the Cash Flow from Operations (CFO) was primarily driven by the rise in net profit before tax and adjustments related to working capital.
The investing activity of the company stands at a net cash outflow of ₹1,275 cr from investing activities, primarily owing to the purchase of property, plant and equipment. A negative cash flow in investing activities suggest that the company is investing in acquiring assets for its future growth.
Lastly, The cash outflow from financing activities was ₹2,140 cr, mainly on account of payment of dividends.
Ratio Analysis of Asian Paints
Ratio analysis of a company involves evaluating a company’s financial performance by examining certain ratios which are derived from its financial statements. It makes easy comparing the financial performance to its industry benchmarks or competitors.
Ratio has different classifications like profitability ratios, solvency ratios, return ratios and more as you can see in the image below, you can analyze all such ratios directly from StockEdge.
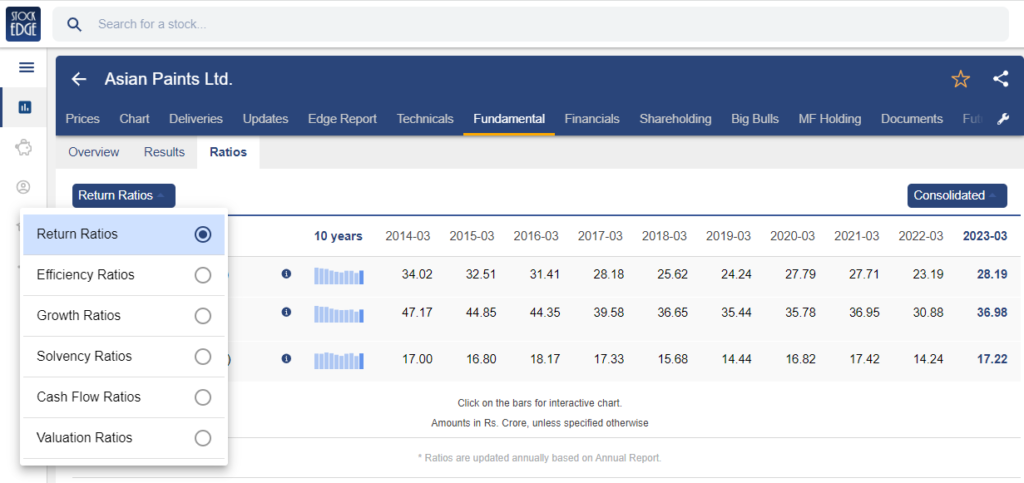
Here are the return ratios of the Asian Paints stock, starting with the two most important ratios which are ROE and ROCE.
What is ROE and ROCE?
ROE is a profitability ratio that measures the company’s ability to generate net income as a percentage of shareholders’ equity, whereas ROCE assesses the efficiency of a company in utilizing its total capital, including both equity and debt.
Return on Equity (ROE)
In FY23 ROE improved to 28% for Asian Paints and more importantly the company is maintaining a ROE of 23%-28% in the past 5 years. It is highest among all other peers in the same paint industry.
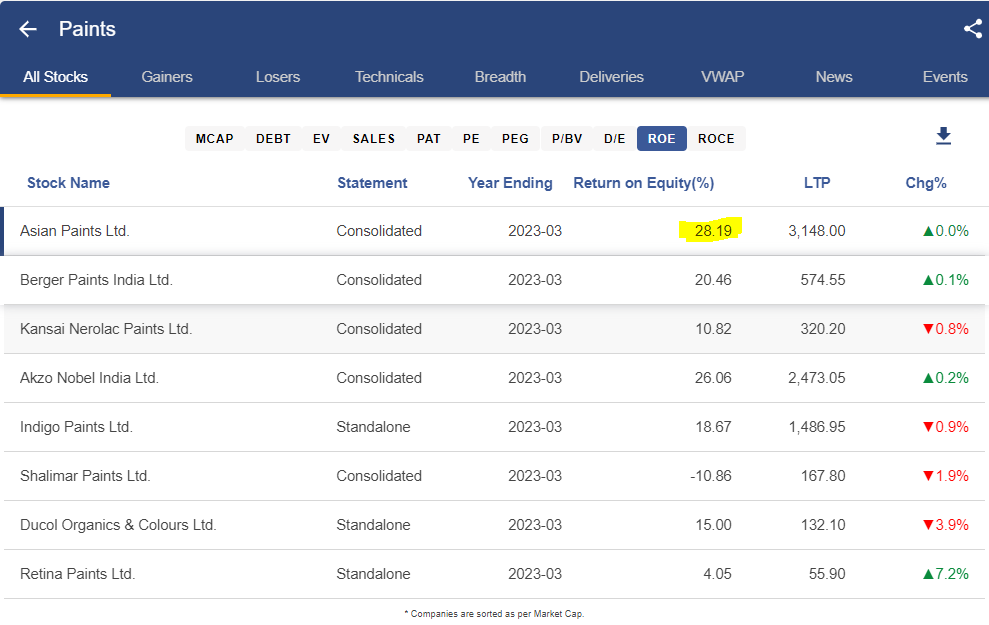
Take a look at ROE of Asian paints stock vis a vis other stocks in the same industry, from the StockEdge app.
Return on Capital Employed (ROCE)
In the fiscal year 2023, the Return on Capital Employed (ROCE) rose to 37%. During the first quarter of the fiscal year 2024, the company expanded its retail presence by adding 6,000 touchpoints. Favorable developments in the monsoon season and an extended festival period bode positively for future demand.
Debt to Equity Ratio
The Debt-to-Equity Ratio is a financial metric that assesses a company’s leverage by comparing its total debt to shareholders’ equity. Asian Paints have a debt-to-equity ratio of 0.06. As on 31st March 2023, the company had long-term and short-term debt worth ₹76 cr and ₹896 cr, respectively.
Price to equity (P/E) Ratio
The Price-to-Earnings (P/E) Ratio is a financial metric that evaluates a company’s valuation by comparing its current stock price to its earnings per share (EPS).
Asian Paints leadership position in the domestic paints industry along with its largest distribution network provides the company with a premium valuation. It is currently trading at a TTM PE multiple of 67.39x.
Management Quality & Shareholding Pattern
While making investment decisions, analyzing the company’s management quality is a key factor because it influences operational efficiency, financial performance, risk management, and the ability to create value for shareholders.
The management of Asian Paints, Mr. Amit Syngle, who is the MD and CEO of the company has been associated for more than 29 years. He is a mechanical engineer and a postgraduate in management from UBS, Chandigarh. He started his career with the company as a management trainee. He has worked in various capacities and across functions sales, marketing, supply chain, research and technology.
Coming to the shareholding pattern of Asian Paints stock, you can check it from the StockEdge App itself.
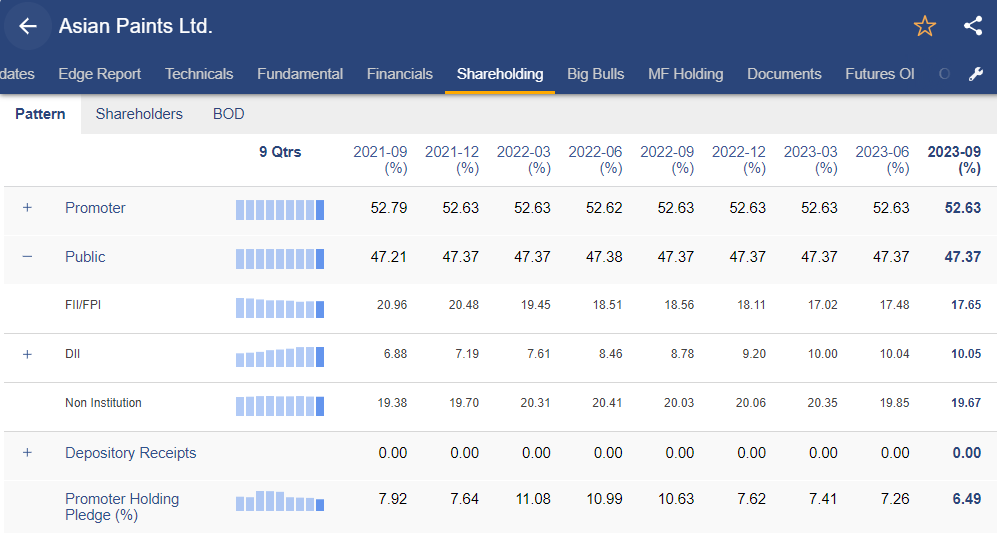
As you can see for the past ten quarters, promoters’ stake in the company stood at 52.63%, which is a healthy sign. In contrast, FIIs stake increased from 17.02% in Q4 FY23 to 17.48% in Q1 FY24 and 17.65% in Q2 FY24. A continuous increase in stakes by the FIIs generally suggest a positive outlook for the company.
Future Outlook Of Asian Paints Stock
Asian Paints is making significant strides in diversifying its revenue streams, aiming to achieve 8%-10% revenue contribution from the home décor segment by FY26. The company is proactively investing in capacity expansions, both brownfield and greenfield, across multiple plant locations, signaling a commitment to future growth. The ambitious plans for the kitchen and bathware segment, coupled with the establishment of Beautiful Home Studio in Chennai, underscore Asian Paints’ focus on luxury offerings and market leadership. Overall, the company’s strategic initiatives and investments suggest a positive outlook for its future prospects.
Case Study of Asian Paints
We have a case study report prepared by our team of analysts. This report provides you with a detailed fundamental analysis of the company as well as how it stands among its competitors.
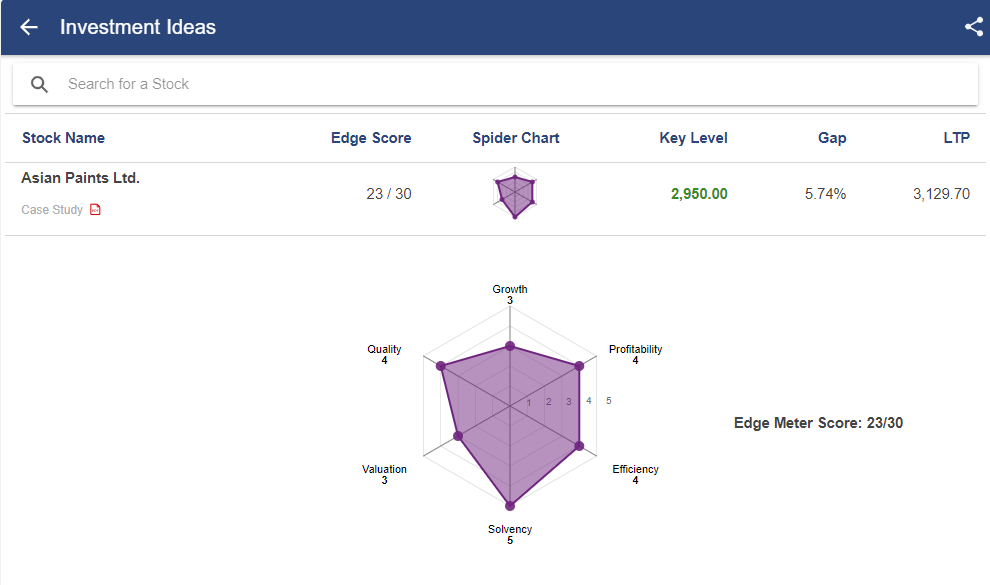
As you can see, Asian Paints stocks has rating based on 6 parameters:
- Growth
- Quality
- Profitability
- Efficiency
- Solvency
- Valuation
Based on the above parameters, Asian Paints stock scored 23/30. Read the case study report here.
Conclusion
The Asian Paints stock report highlights a promising outlook for investors. The company’s strong financial performance, as evidenced by the impressive Return on Capital Employed (ROCE) in FY23, indicates effective utilization of resources. Furthermore, the addition of 6,000 retail touchpoints in the first quarter of FY24 reflects a strategic expansion plan. Favorable conditions, such as good progress in the monsoon and an extended festival season, position Asian Paints well for sustained demand. Additionally, the long-standing leadership of Mr. Amit Syngle, with over 29 years of dedicated service, adds a layer of stability and expertise to the company’s management.
Happy Investing!


