Key Takeaways
- Weekend Advantage: With markets closed, weekends allow calm, structured research without reacting to intraday noise.
- StockEdge Scans: Pre-designed stock scans save time by filtering thousands of companies into a focused shortlist.
- 5 Essential Scans: Weekly breakouts, volume & delivery, SMA, RSI, and combination scans help build a reliable watchlist.
- Research Benefits: Scans bring clarity, consistency, time-saving, and customization to your weekend stock selection.
- Investor Routine: Running a fixed set of scans every weekend builds discipline and ensures a fresh, data-backed watchlist for the week ahead.
For most traders and investors, weekdays are chaotic. You’re reacting to every tick, headline, and price move, leaving little time for structured research. By Friday evening, you may ask yourself: “Am I really making informed decisions, or just reacting to noise?”
The weekend offers the perfect reset. With markets closed, you finally get the time to analyze calmly, free from the pressure of intraday moves. But there’s one challenge: with thousands of listed companies, how do you decide which stocks to focus on?
This is where weekly screener or stock scans come in. Unlike daily fluctuations that attract intraday traders, weekly data filters out the short-term noise and highlights the bigger picture. For a seasoned trader or investor who wants to build a positional view for the medium term, weekly stock scans are far more reliable. They show you which stocks are breaking out of long consolidations, holding key averages, or attracting serious buying interest.
What are Stock Scans?
Stock scans are pre-designed filters that allow you to screen stocks based on price action, volume, technical indicators, and fundamentals. Here is the list of StockEdge Scans.
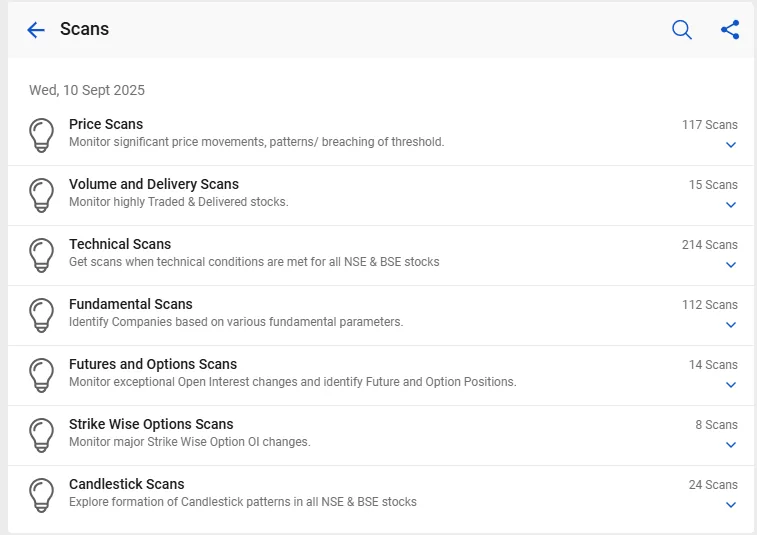
Stock scans save hours of manual effort by giving you a ready shortlist of actionable ideas. To know more about the StockEdge Scans, read our blog How StockEdge Screener Works.
Benefits of Using Stock Scans (From Your Perspective)
- Clarity – Instead of relying on random market tips, you get structured, data-backed stock ideas. For example, a weekly breakout scan will directly show you which stocks are crossing important price levels, so you know exactly why a stock is on your radar.
- Time-Saving – Manually checking charts and indicators for 1,000+ listed stocks is almost impossible. Stock scans allow you to filter thousands of stocks in seconds and highlight only the ones matching your criteria. This way, your weekend research can be done in a focused 30-40 minutes.
- Consistency – The stock market rewards discipline. By running the same set of scans every weekend, you build a consistent watchlist instead of chasing noise. Over time, this habit improves both your stock selection and your confidence in sticking to a process.
- Customization – Every investor or trader has a different style. With stock scans, you can mix and match filters. For example, combining a “weekly RSI above 60” with a “price above 200 DMA” to create a personalized strategy that matches your risk appetite.
5 Essential Stock Scans for Weekend Research by StockEdge
Weekly Breakout Scans
A breakout on the weekly chart carries more weight than a single-day spike. It signals a shift in trend and often precedes strong moves. This helps you avoid short-term market noise and focus on bigger opportunities.
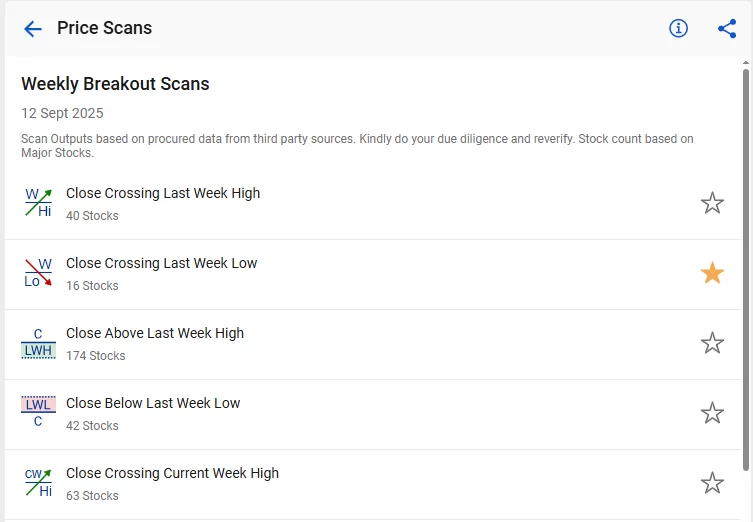
As you can see, here, under StockEdge Scans, you will get a scan for both bullish and bearish stocks. Let’s understand how to implement this.
Let’s take a look at Close Crossing last week’s high. Here, you will find the stock that closes daily above the previous week’s high, which is a bullish signal. Stocks that have fulfilled this criteria will appear under this scan.
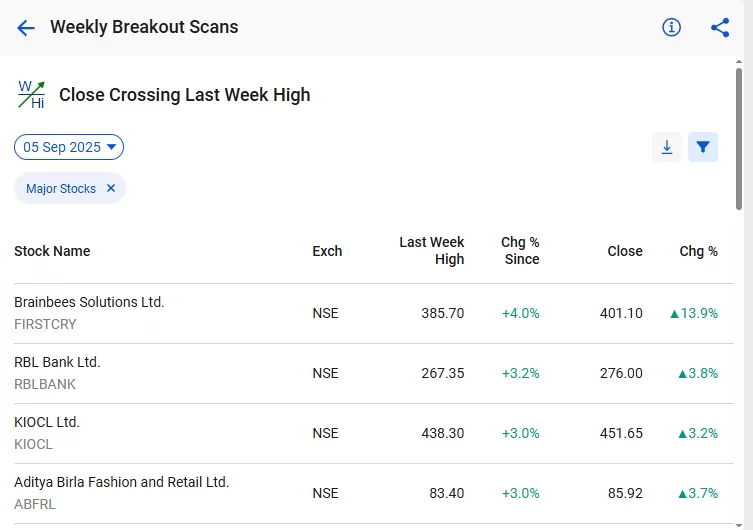
As you can see in the above image, here is the list of major stocks that have fulfilled the criteria; you can also download the list in a CSV file for further analysis. As you can see, Brainbees Solutions Ltd. is shown on the scan on 04th September. Let’s check how this price will perform.
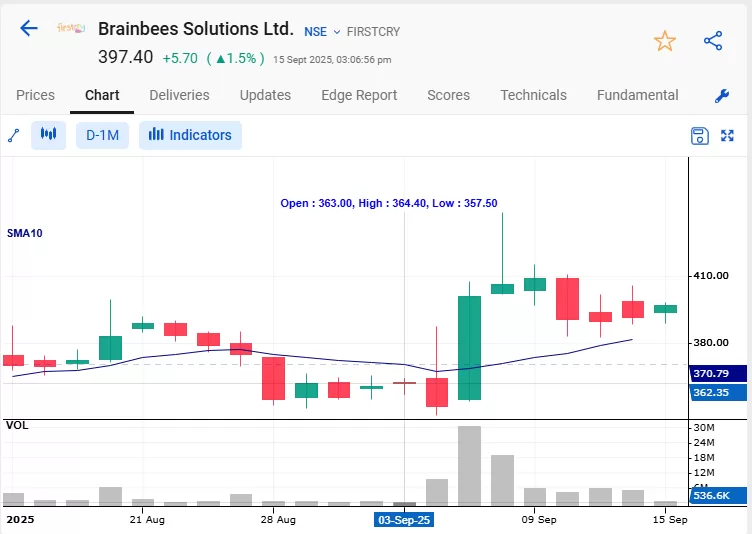
The above image is the daily chart, which shows that the stock price has increased by almost 4%. And the following price scan is “Close Crossing Last week’s Low”, which is a bearish signal as the stock price has given a daily closing below the previous week’s low. In a similar way, you can explore other weekly breakout scans.
Volume and Delivery This Week Scans
Volume means the total number of shares traded in a stock during a day or a given period (week/month). It includes all transactions, whether intraday traders bought/sold or long-term investors participated. If the volume is high, it depicts a lot of trading activity, but not necessarily long-term interest.
Delivery shows how many shares traders actually took delivery of, instead of just buying and selling intraday. When the price rises with a high delivery percentage, it suggests serious investors or traders are buying. This indicates institutional accumulation, a more reliable signal of sustained interest.
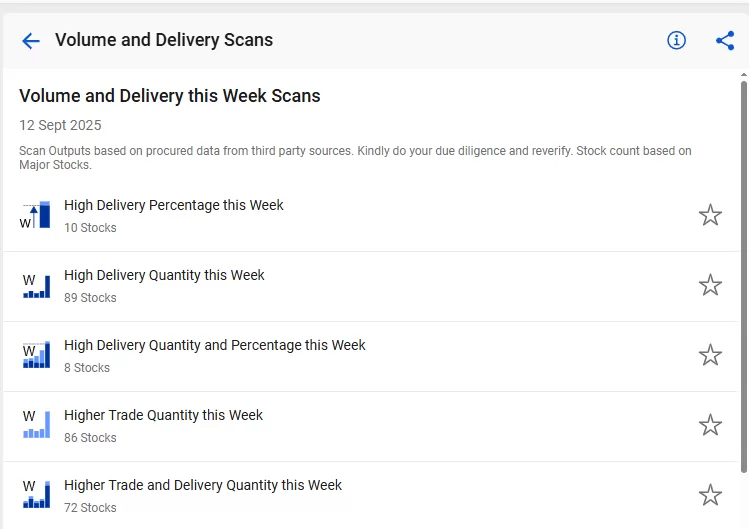
Let’s understand how this works. As you can see, there are multiple scans. Let’s know if “High Delivery Quantity and Percentage this Week” will work. This scan highlights stocks where both delivery quantity and delivery percentage are unusually high compared to normal.
In simple terms, it not only checks whether more shares have been traded during the week but also whether a larger proportion of those shares were actually taken into Demat accounts instead of being squared off intraday.
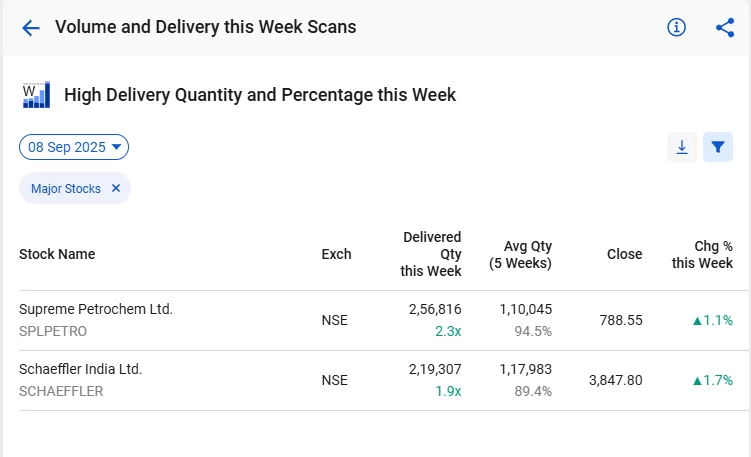
As you can see, Supreme Petrochem Ltd appeared in the scan on 08th September. This means investors are showing a strong and sustained interest in the stock.
Weekly Simple Moving Averages (SMA) Scans
A Simple Moving Average (SMA) is a technical indicator that calculates the average price of a stock over a specific period. For example, a 20-week SMA adds up the closing prices of the last 20 weeks and divides by 20. This smooths out price fluctuations and helps you see the broader trend instead of daily noise.
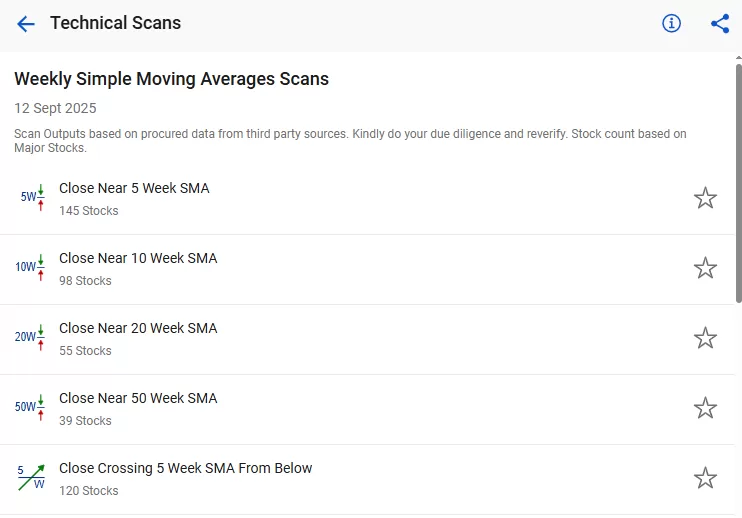
When you use a Weekly SMA Scan, you are essentially checking whether a stock is crossing above or below these important levels. A close above the SMA suggests strength and potential continuation of the trend, while a close below the SMA can be an early warning of weakness. Let’s understand how to use one of these indicators.
Let’s look at the Close Crossing 5 Week SMA From Below, which shows the stock’s price crosses above its 5 Week SMA value from below. It signals potential short-term bullish momentum and a shift towards upward price movement.
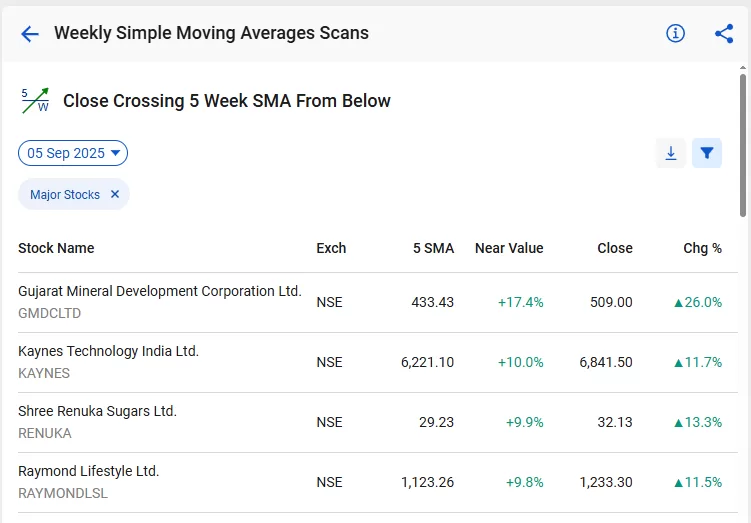
Now, let us discuss some of the scans and how they can generate buy and sell signals with them. From the above image, we can see the list of stocks that fulfil this criterion.
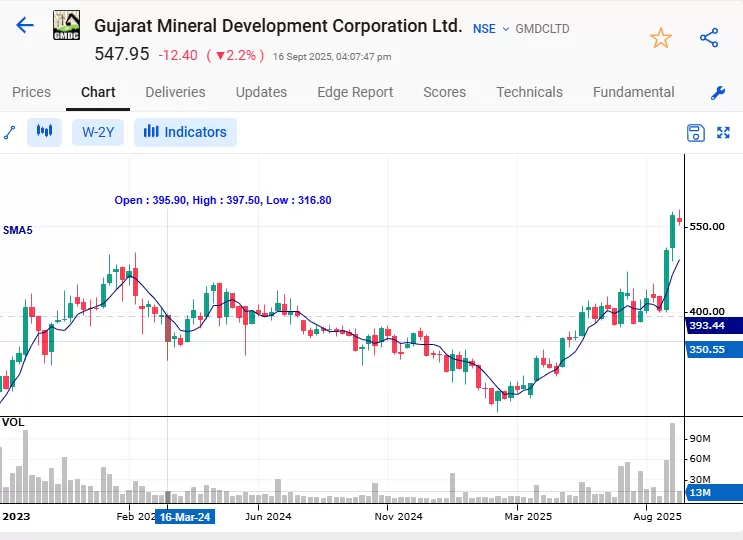
From the technical chart above, we can see how the stock’s price crosses above its 5-week SMA value from below and gives a bullish indication.
Weekly Relative Strength Index (RSI) Scans
The Relative Strength Index (RSI) is a momentum oscillator that oscillates between zero and 100. It is considered overbought when exceeding 70 and oversold when falling below 30. Consequently, a trader might consider buying when the RSI rises above 30 from below and selling when it drops below 70 from above.
In StockEdge, you’ll find a wide range of Relative Strength Index scans to help you easily filter and select stocks for trading.
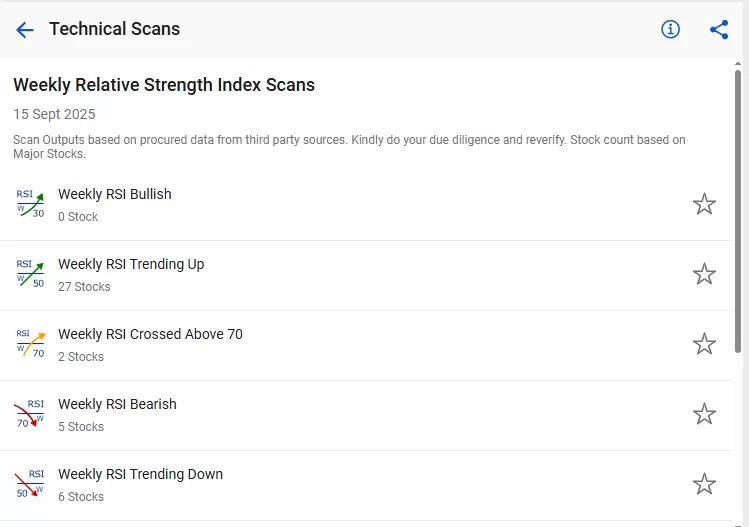
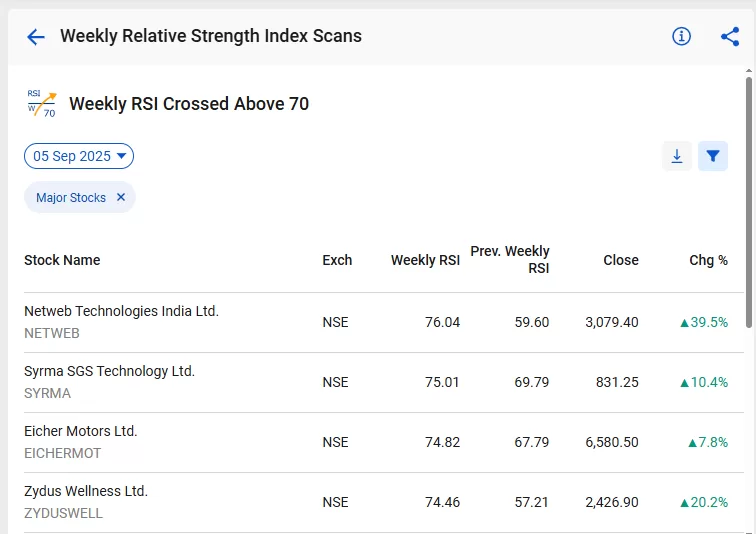
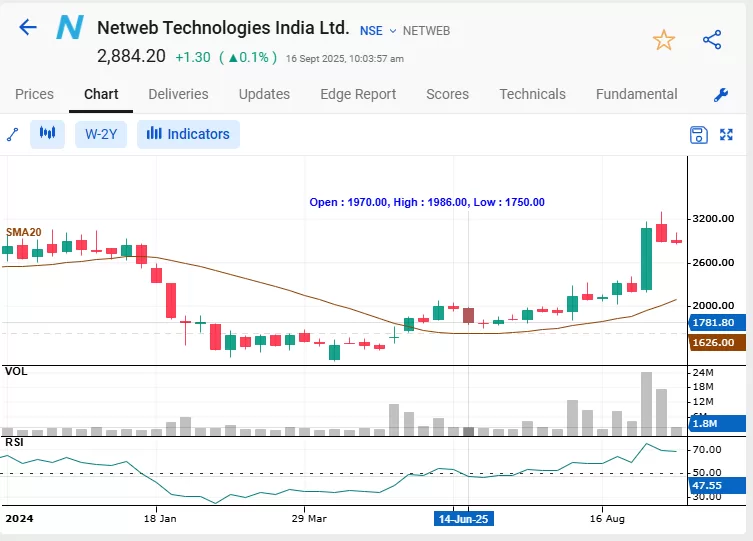
Let’s understand one of the indicators, Weekly RSI Crossed Above 70. This is a bullish scan that indicates that the RSI has crossed 70, which means it is entering the overbought zone. Following is a list of stocks which has fulfilled this criterion on 05th September:
If you want to see the technical chart of Netweb Technologies India Ltd., then you can click on the company and find the technical chart with RSI plotted on the subgraph:
Combination Scans
A combination Scan or Combo Scan gives you an edge to identify stocks not only by a single parameter but also by a number of different criteria for selecting stocks. So, how do you create your own combination scans? Follow these steps:
- Go to My StockEdge
- Click on “My Combo Scan”, which you will find under “My Data.”
- To add a combination scan, click on the + button in the top right corner
- Give a name to your combo scan and click Add.
- Click on Add Scans and start adding your favorite scans.
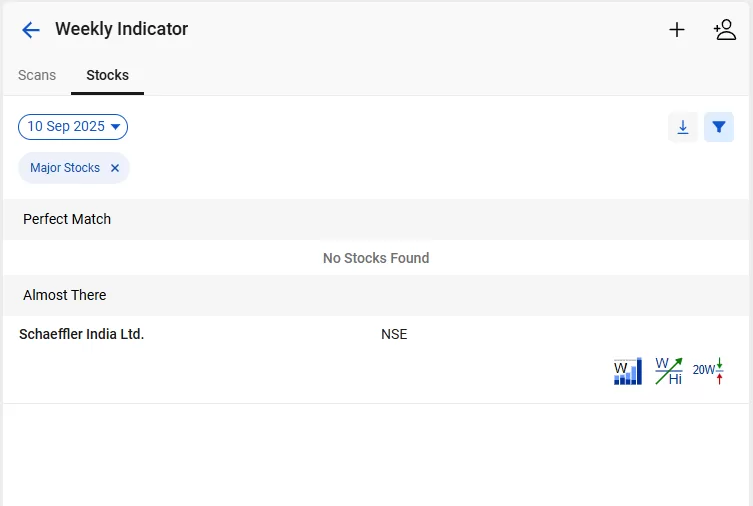
Start using StockEdge scans and create your own combination scans to screen stocks for trading or investing.
Conclusion
A successful trader or investor doesn’t rely on guesswork, but they rely on structured research. By integrating StockEdge scans into your weekend routine, you’ll always start the week with a fresh, data-backed watchlist that keeps you ahead of the curve.
Frequently Asked Questions (FAQs)
How to use StockEdge Scans?
Simply open the Scans section in the app, choose from Technical, Fundamental, or Combination scans, and apply filters to generate stock ideas. We also have a complete tutorial on How to Use StockEdge scans. You can check it out for a step-by-step guide to make the most of this feature.
Which StockEdge scans are best for beginners?
Beginners can start with Breakout scans, Moving Average scans, and RSI scans, as they are simple yet effective.
How often should I update my watchlist?
Ideally, every weekend, the weekly data gives a balanced view without over-trading.
Can I combine multiple scans in StockEdge?
Yes, you can apply multiple scans to refine your list and increase accuracy. For example, combining a Weekly Breakout with High Volume Scan improves conviction.
Is StockEdge suitable only for traders or also for investors?
StockEdge is for both. Traders use technical scans for short-term moves, while investors use fundamental scans to identify long-term opportunities.


