Key Takeaways
- Undervalued stocks offer hidden opportunities: These are companies trading below their intrinsic worth due to market overreactions, temporary slowdowns, or being overlooked sectors.
- Value investing focuses on long-term growth: Investors seek fundamentally strong businesses with solid earnings, low debt, and consistent cash flow, not just trending stocks.
- Both numbers and management matter: Ratios like P/E, P/B, ROE, and PEG help spot undervaluation, but factors like leadership quality, brand strength, and innovation drive sustained value.
- StockEdge Screeners simplify research: With tools like “P/E below industry average” and “Increase in DII shareholding,” investors can easily filter and analyse undervalued companies.
- Patience is the real edge: Successful value investing is about staying disciplined during market swings and holding quality stocks until their true worth is recognised.
Have you ever found yourself in a situation where you were trying to find a needle in a haystack?
That’s how it feels when you start looking for undervalued stocks. With over 6000 listed companies, including NSE and BSE, and constant market noise, identifying which stocks are worth your money can feel nearly impossible.
But with the right approach & tools like the StockEdge Screener, you can quickly filter through the noise to find undervalued companies trading below their true worth.
In this blog, we’ll explore what undervalued stocks really are, why they become undervalued, how to identify them and how StockEdge can make your search smarter, faster, and more rewarding.
What are Value Stocks?
You’ve probably come across this quote: “Price is what you pay, value is what you get.”
It’s one of those Warren Buffett ideas that never gets old. And honestly, it perfectly sums up what value investing is all about. In simple words, value investing involves buying stocks that are undervalued relative to their potential.
So, how can we determine that this company is undervalued? The answer lies in its intrinsic value. Intrinsic value is the business’s actual worth, based on its earnings, assets, and long-term growth potential.
So, basically, value stocks are usually not the ones that make headlines every week. They quietly keep growing, generating profits, and paying dividends over time.
Why are stocks undervalued?
Stocks can be undervalued for various reasons, but the core reason is the disconnect between a company’s fundamental financial health and investors’ perceptions of its value. Let’s discuss a few case studies.
Cyclical Business
Cyclical businesses are those whose performance closely follows the ups and downs of the economy, such as the automotive, steel, and airline industries. Their earnings rise during economic booms and fall during downturns.
Take the automotive sector during the 2020 COVID-19 pandemic as an example. Companies like Mahindra & Mahindra Ltd. saw sharp declines in car sales as consumer demand plummeted and supply chains were disrupted. As a result, its stock price fell significantly, making it appear unattractive in the short term.
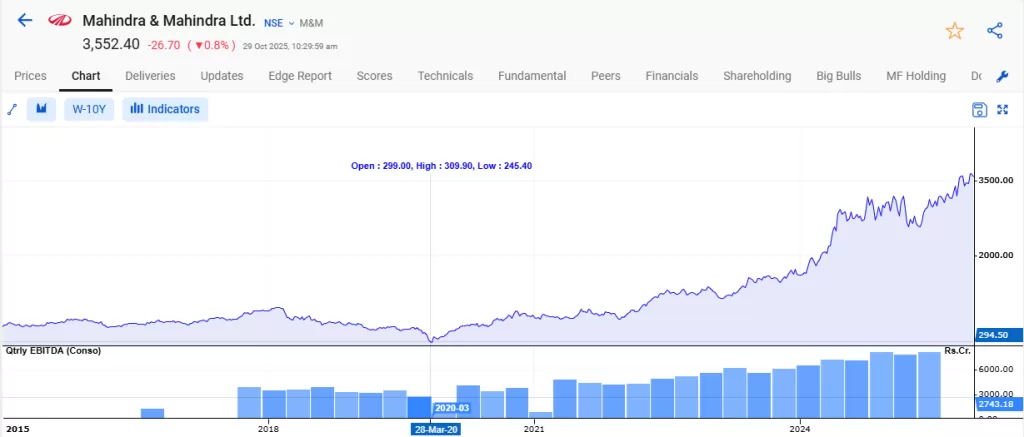
However, this decline didn’t reflect the company’s long-term potential. When the economy recovered and demand for vehicles rebounded, their sales and profitability improved sharply, and the stock price followed.
Seasonal Business
Seasonal businesses experience fluctuations in sales and profits depending on the time of year; like companies in the air conditioning, apparel, or tourism industries. These patterns can sometimes make their stocks look weak during off-seasons, leading to temporary undervaluation.
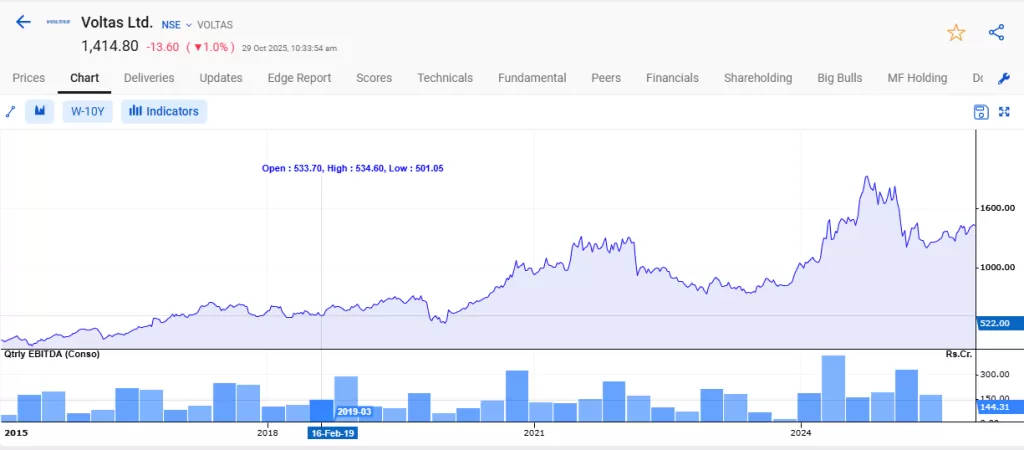
Voltas Ltd, an air conditioning company, earns most of its revenue in summer. During cooler months, weaker sales can make the stock look unattractive, but demand and prices typically rebound in the next hot season.
Market Panic or Temporary Negative News
During a market panic or a wave of negative news, investor confidence tends to collapse almost overnight. Fear takes over logic, and what follows is a chain reaction. At that time, everyone rushes to sell, often without checking whether the company is actually in trouble. This often pushes stock prices below their true value.
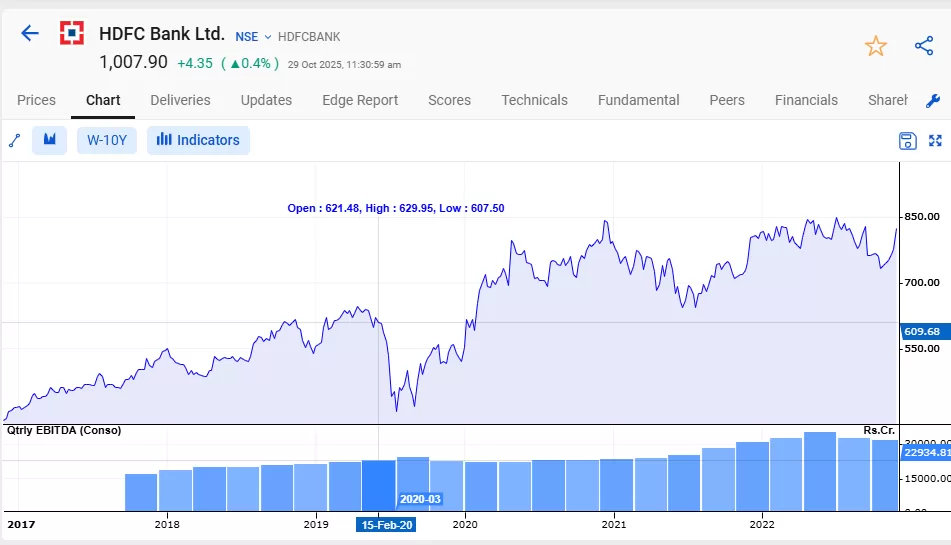
During the 2020 COVID-19 market crash, shares of HDFC Bank fell sharply as investors feared economic slowdown and rising loan defaults. However, the bank’s fundamentals remained strong, and as the economy recovered, its stock rebounded significantly.
Market Blind Spots
Market blind spots occur when investors overlook certain companies, sectors, or opportunities because they’re not in the spotlight or are misunderstood. This lack of attention can cause fundamentally strong stocks to trade below their true value.
Take E.I.D. – Parry (India) Ltd. as an example. A few years ago, hardly anyone talked about sugar companies. They were seen as cyclical plays dependent on monsoons, government pricing, and export quotas.
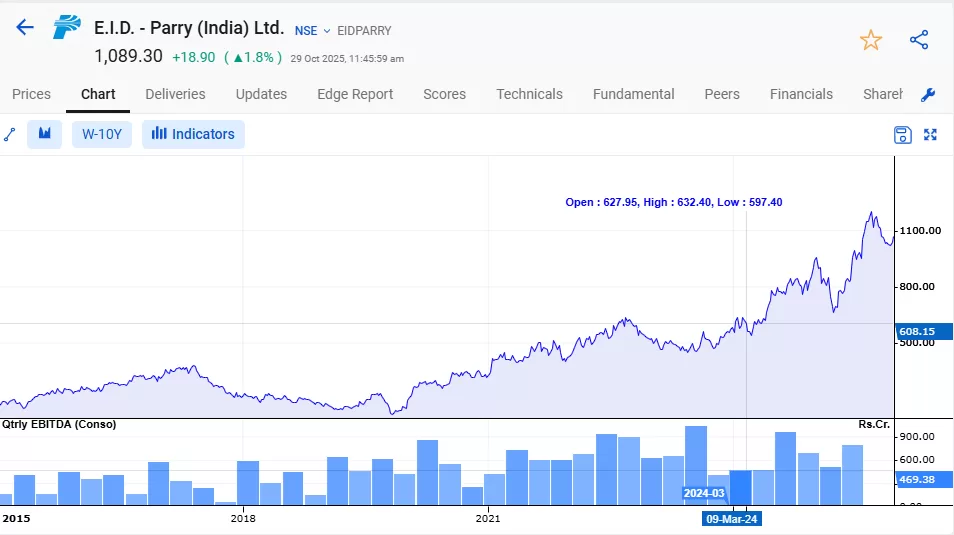
But then came the government’s ethanol blending policy, aiming to blend 20% ethanol with petrol by 2025. Suddenly, the narrative changed. Their balance sheets improved, debt reduced, and cash flows strengthened, yet for a long time, their valuations remained modest. Those who spotted the opportunity early were the ones who truly benefited.
How to Identify Value Stocks?
You can identify value stocks by combining quantitative and qualitative factors.
Quantitative Factors
First, let’s analyse quantitative metrics to determine whether a stock is undervalued.
- Price-to-Earnings (P/E) Ratio: This compares a company’s stock price to its earnings per share (EPS). A lower P/E ratio relative to the industry average or historical levels may signal that a stock is undervalued.
- Price-to-Book (P/B) Ratio: This metric compares a company’s market value to its book value (assets minus liabilities). A P/B ratio below 1, or lower than the industry average, indicates that the market is valuing the company less than its net assets.
- Return on Equity (ROE): This measures how much profit a company generates with the money invested by shareholders. A high ROE combined with a low P/B ratio is often a sign of an undervalued company.
- Debt-to-Equity (D/E) Ratio: This ratio measures a company’s financial leverage. A low D/E ratio can indicate a company is more financially stable, which is a desirable trait for a value investment.
- Price-to-Free Cash Flow (P/FCF): Free Cash Flow (FCF) is the cash a company generates after covering its operating expenses and capital expenditures. A low P/FCF ratio suggests you are paying less for every dollar of the company’s cash flow, which could indicate undervaluation.
- Price/Earnings-to-Growth (PEG) Ratio: It is a more advanced metric that refines the P/E ratio by factoring in expected earnings growth. A PEG ratio below 1 suggests that the stock is undervalued relative to its growth potential.
- Institutional Holding: A high percentage of shares owned by institutional investors often signals strong confidence in the company’s future prospects and growth potential.
Qualitative Metrics
When it comes to finding undervalued stocks, most investors stop at the numbers, low P/E, high ROE, steady profit growth, and so on. And while those metrics are crucial, they only tell half the story.
The other half lies in qualitative factors, the things you can’t always measure on a spreadsheet but that often make or break a company’s future.
- Management Quality: Competence, integrity and strength of the management is key to long term growth and unlocking value.
- Research and Development Expenditure: Large scale investments in Research ensures that a company remains competitive and has the potential to increase future earnings.
- Brand Reputation: Customer trust and confidence in the brand can justify potentially higher valuation in the future
- Quality of Customer Support: Good quality of customer support enables businesses to retain or grow their customer base.
How StockEdge Helps to Identify Undervalued Stocks Using StockEdge Screeners
StockEdge screeners provide a range of stock scans that help investors screen and analyse undervalued stocks. These tools simplify stock research by filtering data and highlighting potential opportunities with the help of various stock screeners.
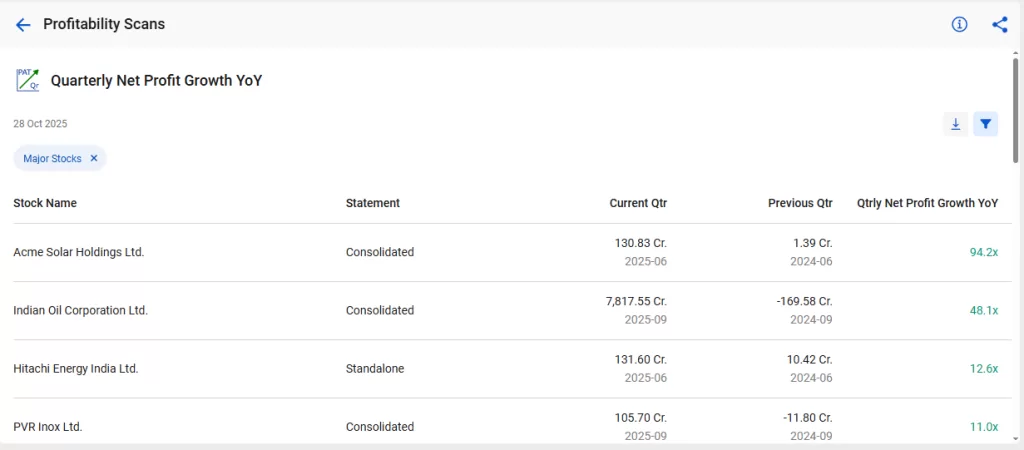
1. Quarterly Net Profit Growth YoY
It is a tool for finding companies whose net profits have increased significantly compared to the same quarter of the previous year. It helps investors identify companies that have shown strong, consistent growth, a key indicator of healthy business performance.
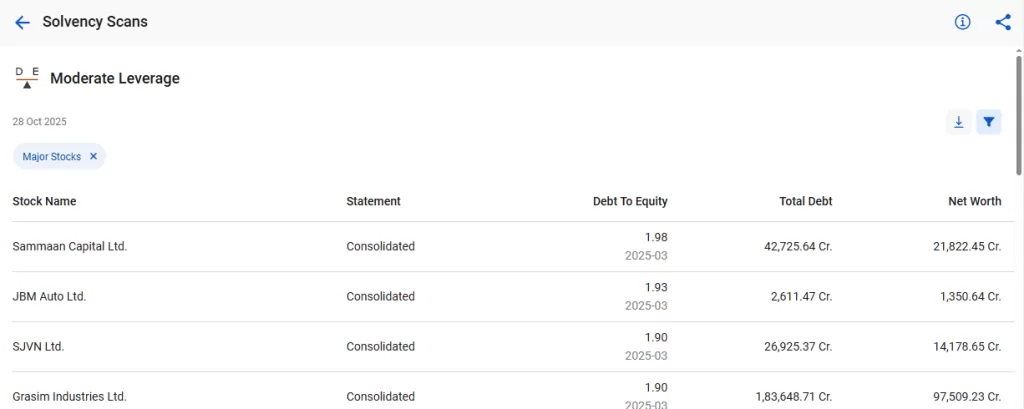
2. Moderate Leverage
It is a tool to identify companies that use a balanced mix of debt and equity to fund their operations. This approach helps to spot companies that leverage debt for growth without assuming excessive risk.
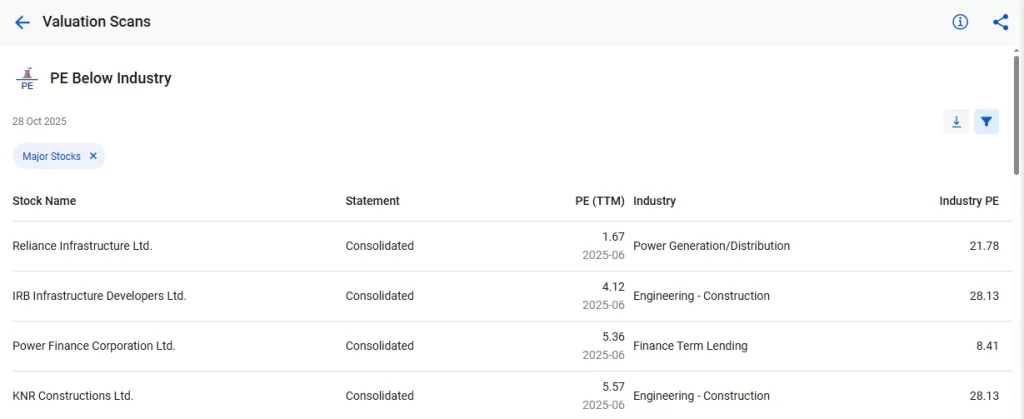
3. P/E Below Industry Average
This screener filters out those companies that are trading at a lower P/E ratio than their industry average.
It helps investors identify good buying opportunities when solid businesses are temporarily out of favour.
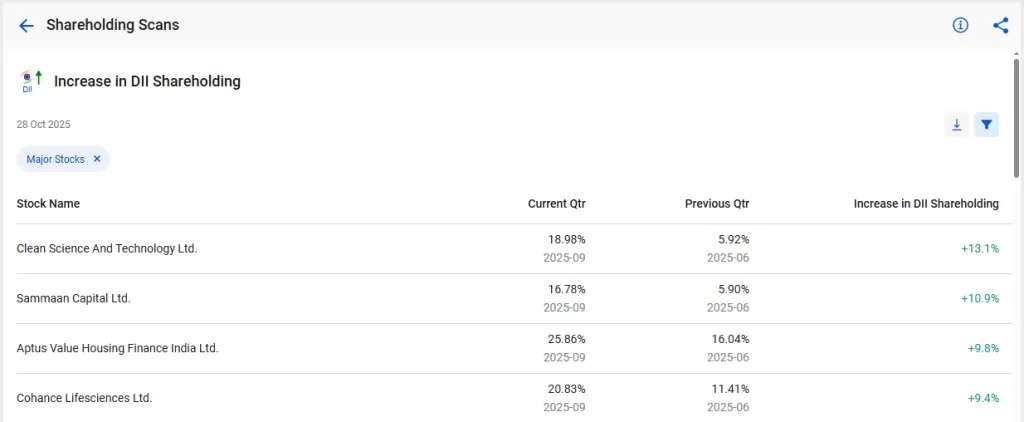
4. Increase in DII Shareholding
This tool identifies companies where domestic institutions have raised their shareholdings. An increase in DII investment indicates confidence in the company’s prospects and its potential for future growth.
5. Low PEG Ratio
This tool helps analyze and compare companies with varying P/E ratios and growth rates. A low PEG ratio indicates that the stock is undervalued relative to its growth, typically when the PEG value is below 1.
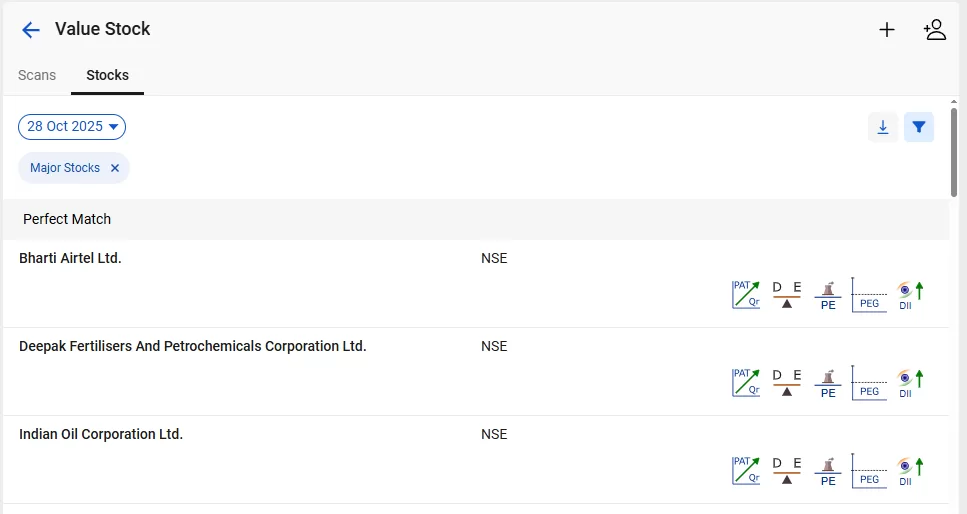
Finding Undervalued Stocks Using StockEdge Combo Screeners
A combination Scan or Combo Scan gives you an edge to identify stocks not only by a single parameter but also by a number of different criteria for selecting stocks. So, how do you create your own combination scans on StockEdge?
Follow these steps:
- Go to My StockEdge
- Click on “My Combo Scan”
- To add a combination scan, click on the + button in the top right corner
- Name your combo scan and click Add.
- Click on Add Scans and start adding your favorite scans.
Conclusion
After understanding this, it can be concluded that a successful investor is one who remains patient and disciplined during the ups and downs of the market.
With StockEdge screeners, you can identify companies trading below their intrinsic value, track improving financial trends, and monitor sectoral shifts that often go overlooked by the market.
Read Also: Weekend Market Research Routine with StockEdge Screeners
Frequently Asked Questions (FAQs)
1. What does FII shareholding screener show?
These stock screeners help to identify companies where foreign institutional investors own significant amounts of shares.
2. What does moderate leverage screener indicate?
This stock screener helps to identify companies with balanced use of debt and equity.
3. Does a low P/E always mean a good buy?
No, a low P/E does not always mean a good buy. A Low P/E ratio means that the company is cheap but it can also imply that the company has little to no future potential.
4. What does quarterly net profit growth YoY screener do?
This stock screener helps identify companies with significantly higher net profits compared to the same quarter last year year.
5. How does StockEdge help to identify value stocks?
StockEdge provides comprehensive stock screeners, including fundamental scans, price scans, and custom combo scans where you can combine multiple filters. It helps you filter thousands of stocks quickly and efficiently.


